OPEN-SOURCE SCRIPT
VXN Williams %R
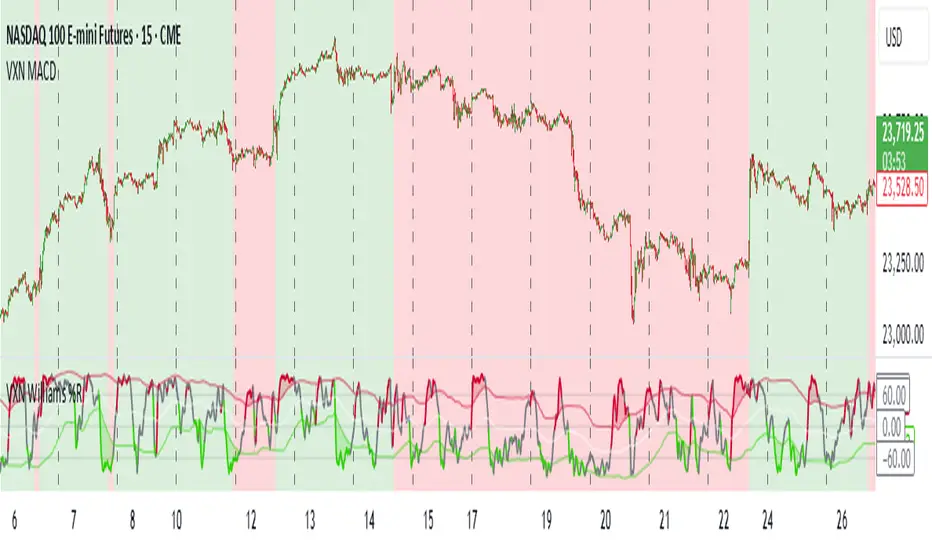
This indicator is based on other open source scripts. It's designed for trading NASDAQ futures using the Williams %R oscillator combined with Bollinger Bands.
The Williams %R is calculated based on a user-defined source and period, then smoothed with a moving average (SMA, EMA, WMA, or RMA).
Bollinger Bands are applied to the scaled Williams %R to identify overbought and oversold conditions.
The background color reflects the trend of the VXN (CBOE NASDAQ Volatility Index):
- Green background: Indicates a bullish trend (VXN EMA < VXN SMA), suggesting long entries at green peaks (Williams %R crossing above the upper Bollinger Band).
- Red background: Indicates a bearish trend (VXN EMA > VXN SMA), suggesting short entries at red peaks (Williams %R crossing below the lower Bollinger Band).
Açık kaynak kodlu komut dosyası
Gerçek TradingView ruhuna uygun olarak, bu komut dosyasının oluşturucusu bunu açık kaynaklı hale getirmiştir, böylece yatırımcılar betiğin işlevselliğini inceleyip doğrulayabilir. Yazara saygı! Ücretsiz olarak kullanabilirsiniz, ancak kodu yeniden yayınlamanın Site Kurallarımıza tabi olduğunu unutmayın.
Feragatname
Bilgiler ve yayınlar, TradingView tarafından sağlanan veya onaylanan finansal, yatırım, işlem veya diğer türden tavsiye veya tavsiyeler anlamına gelmez ve teşkil etmez. Kullanım Şartları'nda daha fazlasını okuyun.