PROTECTED SOURCE SCRIPT
Gold Total Market Cap By Wave Trader
Gold Total Market Cap (Updated 2025)
Overview
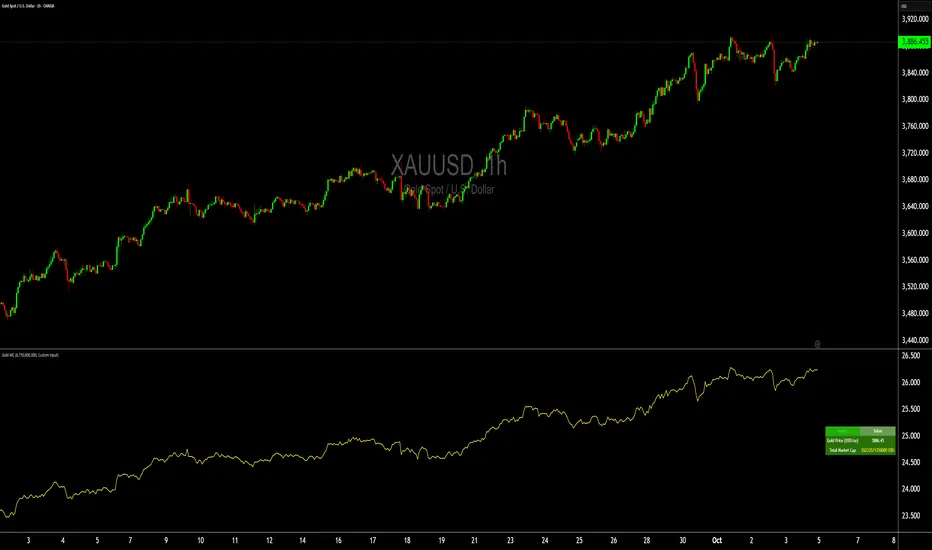
This indicator calculates and visualizes the total market capitalization of gold in real-time, based on the current XAUUSD spot price and the estimated above-ground gold supply. It transforms the raw gold price into a scaled "market cap" view (in trillions USD), helping traders contextualize gold's global value—often compared to stocks, crypto, or fiat reserves. As of October 2025, gold's cap hovers around $26–27T, underscoring its status as a premier safe-haven asset.
How It Works
Core Formula: Market Cap = Gold Price (USD/oz) × Total Supply (troy oz), scaled to trillions for chart readability.
Supply Data: Defaults to the World Gold Council (WGC) mid-2025 estimate of ~218,000 metric tonnes (~7.01B troy oz), but customizable for scenarios like historical or projected figures.
Plotted as a smooth yellow line below the price pane, mirroring gold's price movements but in cap terms.
Key Features
Dynamic Label: A real-time label on the yellow line displays the exact market cap (e.g., "26.8") for instant reference, styled like popular TradingView cap indicators.
Reference Line: Horizontal dashed line at 25T USD to highlight key thresholds (e.g., surpassing Bitcoin's cap).
Info Table: Top-right panel shows current gold price and full market cap (e.g., "26.8T USD") for quick stats.
Overlay-Free: Designed for a separate pane to avoid cluttering your main XAUUSD chart.
Data Sources & Customization
Relies on live XAUUSD close prices from TradingView.
Supply input: Switch between "WGC Mid-2025" (default) or custom values—ideal for sensitivity analysis (e.g., adding future mining output).
No external API calls; fully self-contained for fast performance.
Usage Tips
For Gold Traders: Spot divergences between price momentum and cap growth to gauge overbought/oversold conditions.
Portfolio Context: Compare to S&P 500 cap (~$50T) or BTC (~$2T) by adding multi-symbol alerts.
Timeframes: Best on daily/weekly for long-term trends; works on 1H+ for intraday macro views.
Alerts: Set notifications for cap milestones (e.g., "Gold Cap > 28T") via TradingView's alert system.
Track gold's "infinite market cap" evolution—because unlike stocks, gold's supply grows slowly, amplifying price impact. Updated for 2025 data; feedback welcome! 🚀
Overview
This indicator calculates and visualizes the total market capitalization of gold in real-time, based on the current XAUUSD spot price and the estimated above-ground gold supply. It transforms the raw gold price into a scaled "market cap" view (in trillions USD), helping traders contextualize gold's global value—often compared to stocks, crypto, or fiat reserves. As of October 2025, gold's cap hovers around $26–27T, underscoring its status as a premier safe-haven asset.
How It Works
Core Formula: Market Cap = Gold Price (USD/oz) × Total Supply (troy oz), scaled to trillions for chart readability.
Supply Data: Defaults to the World Gold Council (WGC) mid-2025 estimate of ~218,000 metric tonnes (~7.01B troy oz), but customizable for scenarios like historical or projected figures.
Plotted as a smooth yellow line below the price pane, mirroring gold's price movements but in cap terms.
Key Features
Dynamic Label: A real-time label on the yellow line displays the exact market cap (e.g., "26.8") for instant reference, styled like popular TradingView cap indicators.
Reference Line: Horizontal dashed line at 25T USD to highlight key thresholds (e.g., surpassing Bitcoin's cap).
Info Table: Top-right panel shows current gold price and full market cap (e.g., "26.8T USD") for quick stats.
Overlay-Free: Designed for a separate pane to avoid cluttering your main XAUUSD chart.
Data Sources & Customization
Relies on live XAUUSD close prices from TradingView.
Supply input: Switch between "WGC Mid-2025" (default) or custom values—ideal for sensitivity analysis (e.g., adding future mining output).
No external API calls; fully self-contained for fast performance.
Usage Tips
For Gold Traders: Spot divergences between price momentum and cap growth to gauge overbought/oversold conditions.
Portfolio Context: Compare to S&P 500 cap (~$50T) or BTC (~$2T) by adding multi-symbol alerts.
Timeframes: Best on daily/weekly for long-term trends; works on 1H+ for intraday macro views.
Alerts: Set notifications for cap milestones (e.g., "Gold Cap > 28T") via TradingView's alert system.
Track gold's "infinite market cap" evolution—because unlike stocks, gold's supply grows slowly, amplifying price impact. Updated for 2025 data; feedback welcome! 🚀
Korumalı komut dosyası
Bu komut dosyası kapalı kaynak olarak yayınlanmaktadır. Ancak, ücretsiz ve herhangi bir sınırlama olmaksızın kullanabilirsiniz – daha fazla bilgiyi buradan edinebilirsiniz.
For Training visit.
Website wave-trader.com
Website techtradingacademy.com
Slack: wavetraders.slack.com
Telegram: t.me/Wavetraders
X: twitter.com/Wave__Trader
FB: facebook.com/WTimran
Website wave-trader.com
Website techtradingacademy.com
Slack: wavetraders.slack.com
Telegram: t.me/Wavetraders
X: twitter.com/Wave__Trader
FB: facebook.com/WTimran
Feragatname
Bilgiler ve yayınlar, TradingView tarafından sağlanan veya onaylanan finansal, yatırım, alım satım veya diğer türden tavsiye veya öneriler anlamına gelmez ve teşkil etmez. Kullanım Koşulları bölümünde daha fazlasını okuyun.