Hashem Extended Stochastic (V2)Extended Stochastic with All Zones. From Neutral to Danger Zones.
The Most Complete and Extended Stochastic Indicator.
Zone

Hashem Extended StochasticExtended Stochastic with All Zones.
From Neutral to Danger Zones.
The Most Complete and Extended Stochastic Indicator.
S&R Zone SignalsThis indicator allows you to specify price zones in which to detect basic candlestick patterns.
In the example above, I have specified the most immediate support and resistance zones on GBP/USD and set the script to detect engulfing candles. If a bearish engulfing candle occurs within the resistance zone a signal will be generated; likewise for bullish engulfing candles within the support zone .
The purpose of this indicator is to generate trading alerts when these patterns occur in order to reduce the screen-time required to monitor setups. This indicator is intended for structure traders primarily, although it could be used by anyone who uses zones and candlestick patterns to enter trades.
If you leave either zone set to 0 then that zone will not be used, meaning that you can use this to detect both support and resistance signals, or only signals at support, or only signals at resistance.
Settings:
R1: First Resistance Price
R2: Second Resistance Price
S1: First Support Price
S2: Second Support Price
Draw Signals: Enable/Disable Visual Signals
How Far To Look Back: Used For Detecting Fractal Highs/Lows
Doji Size (in pips): This Changes the Size of Detected Doji Candles
Hammer Wick Size: This Changes the Size of Detected Hammers/Shooting Stars
Engulf Wick: If Enabled, Only Engulfing Candles That Engulf the Wick Will Be Valid
Show Engulfing Candles: Enable/Disable Visual Signals For Engulfing Candles
Show Doji Candles: Enable/Disable Visual Signals For Doji Candles
Show Hammer Candles: Enable/Disable Visual Signals For Hammer/Shooting Star Candles
Source Code:
Go to zenandtheartoftrading.com for the source code – it’s free!

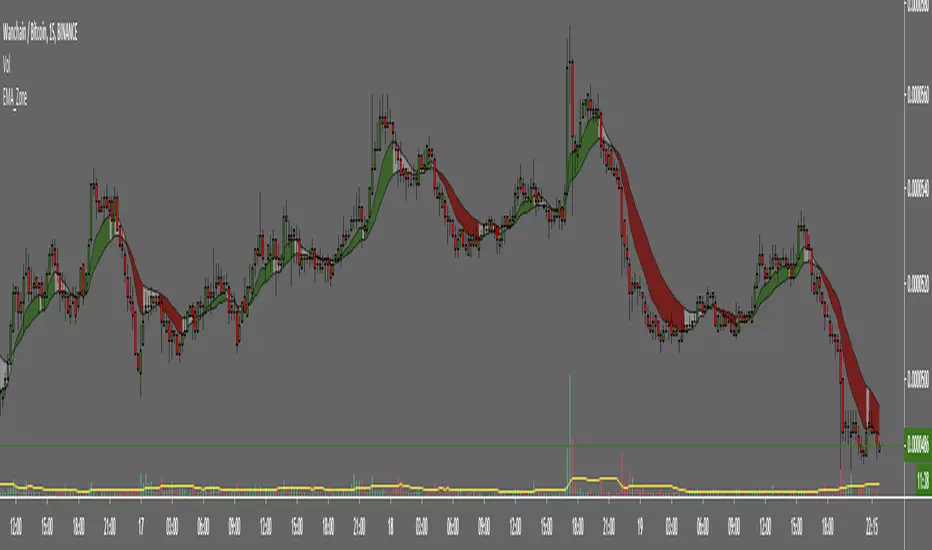
EMA ZoneIndicator to fill the ZONE between two EMAs (9 and 21 is the default)
RULES of completion:
CLOSE above "EMAs" and "EMA SLOW", and "EMA FAST" > "EMA SLOW" = green fill
CLOSE below "EMAs" and "EMA SLOW" ,and "EMA FAST" < "EMA SLOW" = red fill
CLOSE between EMAs = white fill
HTF High/LowThis simple script draws the previous higher timeframe candle high/low to your chart.
You can also make the script paint the zone between the low/open and the high/close.

Volume Zone OscillatorCopy Pasta from Investopedia
Interpretation
The VZO points to a positive trend when it rises above and maintains the 5% level, and a negative trend when it falls below the 5% level and fails to turn higher. Oscillations between the 5% and 40% levels mark a bullish trend zone, while oscillations between -40% and 5% mark a bearish trend zone. Meanwhile, readings above 40% signal an overbought condition, while readings above 60% signal an extremely overbought condition. Alternatively, readings below -40% indicate an oversold condition, which becomes extremely oversold below -60%.
The indicator panel shows horizontal lines that correspond with relative percentage levels that trigger buy and sell signals when crossed:
BUY OR COVER SIGNAL - cross from below to above the -40% line.
SELL OR SELL SHORT SIGNAL - cross from above to below the 40% line.
LESSER BUY OR COVER SIGNAL – cross from below to above the 5% line, but any subsequent violation adds a 7.5% buffer zone before the next buy signal.
A 14-period average directional index (ADX) can be used with the VZO, with values greater than 18 pointing to a trending market. A 60-period exponential moving average (EMA) is examined when ADX signals a trend, with price crossing above the moving average denoting a positive trend, while a downward crossover points to a bearish trend. These values should be tweaked and optimized by backtesting specific securities.
Price pattern and other indicators can be examined to confirm VZO buy or sell signals. Volume bars common on most price charts provides useful information in this regard, adding to signal reliability when bullish and bearish crosses align with two times or greater average volume. In addition, look for OBV to tick higher when the VZO has pushed above 50% and lower when it falls below that level. (For more, see: How to Use Volume to Improve Your Trading.)
And there are better uses for this Indicator than the above description ;)
happy trading

RSI Based Automatic Supply and DemandA script that draws supply and demand zones based on the RSI indicator. For example if RSI is under 30 a supply zone is drawn on the chart and extended for as long as there isn't a new crossunder 30. Same goes for above 70. The threshold which by default is set to 30, which means 30 is added to 0 and subtracted from 100 to give us the classic 30/70 threshold on RSI, can be set in the indicator settings.
By only plotting the Demand Below Supply Above indicator you get automatic SD level that is updated every time RSI reaches either 30 or 70. If you plot the Resistance Zone / Support Zone you get an indicator that extends the zone instead of overwrite the earlier zone. Due to the zone being extended the chart can get a bit messy if there isn't a clear range going on.
There is also a "confirmation bars" setting where you can tell the script how many bars under over 30 / 70 you want before a zone is drawn.
Here is an image of only using the "Demand Below / Supply Above" plot.
As you can see, this could be useful "Price Flow" indicator, where we would only short if a zone appears below another zone, or long if two zones in a row are going up, like stairs.

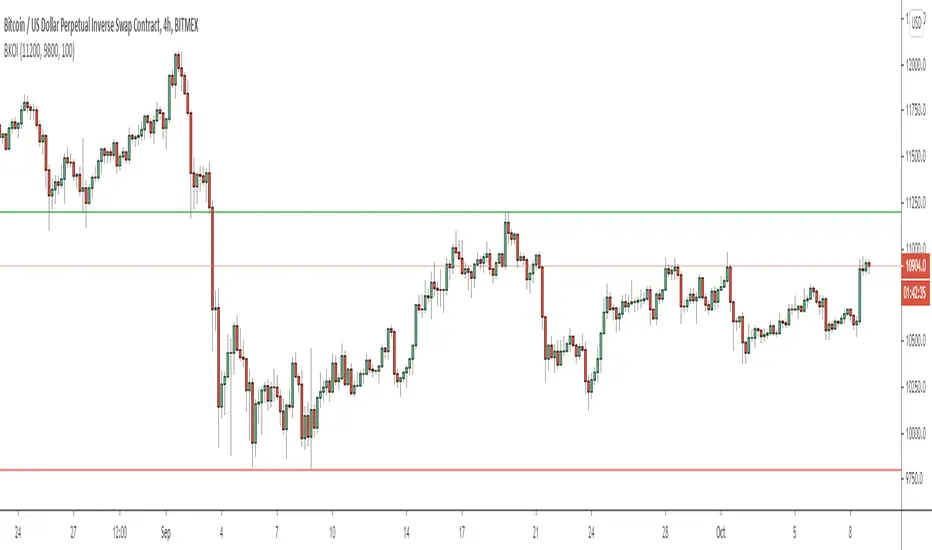
Breakout IndicatorThis script allows you to set breakout alerts.
An alert will be triggered only when price breaks and closes beyond the specified prices. You will get an alert on the first candle that closes beyond the levels you set.
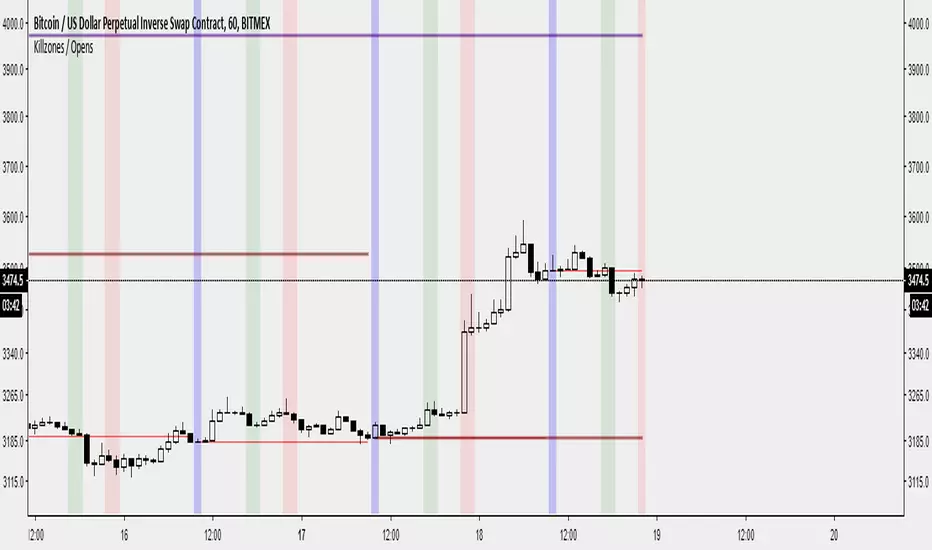
Killzones / Daily Open / Weekly Open / Monthly Open by @bartbtcI've created an indicator that :
- Displays the previous day's, week's, month's open on the current period's price action.
- Displays a vertical bar at the daily open. (The first 30-60 minutes from the daily open is commonly where the high/low of the day is made)
- Displays London/NY opens as vertical bars (london close is an option, but I have disabled it by default. I have removed Asia as I believe it is not useful - deal with it!)
Features:
- Displays daily data/killzones only on timeframes lower than 60minutes (you can modify this in the settings as you wish)
- Displays weekly open only on timeframes lower than weekly
- Displays monthly open only on timeframes lower than monthly
Let me know on Twitter on @bartbtc if there's any issues or if you have any other features you think might be useful.
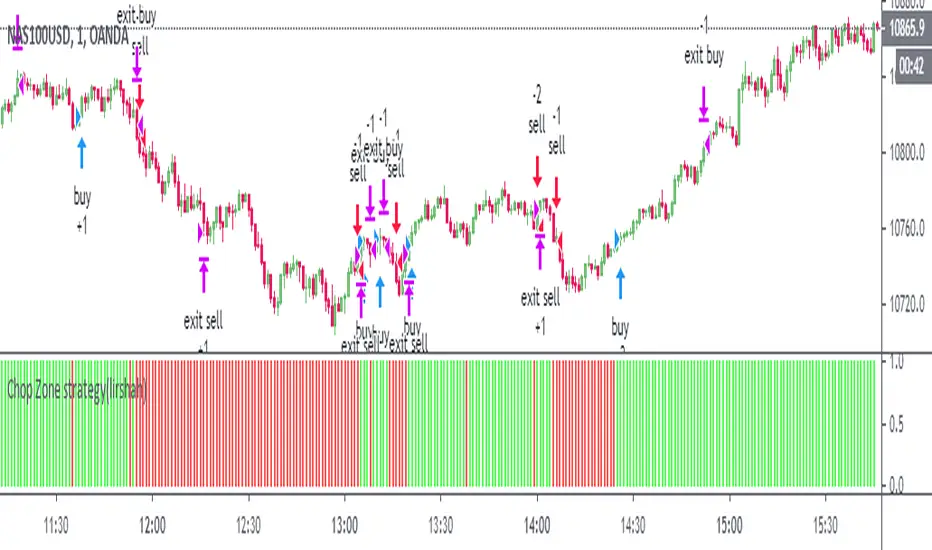
Chop Zone strategy(lirshah)This is a visual indicator designed to identify trends and choppiness.
the Chop Zone illustrates the difference between close price and its EMA by converting its values to colors.
this strategy has best performance on H1 timeframe and has a good results on several crypto pair.
MA ZonesThis simple indicator paints the zone between up to 3 different Moving Averages and Exponential Moving Averages.
For example:
The green zone is the price between the 50 EMA and the 50 MA .
The orange zone is the price between the 100 EMA and the 100 MA .
The red zone is the price between the 200 EMA and the 200 MA .

Dynamic Support & ResistanceThis indicator paints the background of the chart between 2 EMAs when all 3 given EMAs are in sync.
The default settings are:
Long-term EMA: 200 Period.
Short-term EMA 1: 50 Period.
Short-term EMA 2: 20 Period.
So according to the default settings, when the 20EMA is above the 50EMA, and the 50EMA is above the 200EMA, the area between the 20EMA and the 50EMA will turn green. When the 20EMA is below the 50EMA, and the 50EMA is below the 200EMA, the area will turn red. When the EMAs are all over the place (ie. price is consolidating), the area will be painted white.
You can change the colors in the indicator settings menu. To remove the white background, change the transparency to 100%. Unfortunately pinescript does not allow you to do this using code, otherwise I would have made that a default feature.
Enjoy! Let me know if you have any questions.
Regards,
- Matt

Volume Zone Oscillator and Price Zone (VZO/PZO) [NeoButane]" Volume Precedes Price is the conceptual idea for the oscillator."
"The main idea of the VZO was to try to change the OBV to look like an oscillator rather than an indicator, also to include time; primarily to identify which zone the volume is located in during a specific period "
How to read this indicator:
Positive reading -> bullish
Negative reading -> bearish
-60 or 60 is seen as the limit of the oscillator range, and a pullback should be expected from there.
Plus and minus signs have been added to the top and bottom for VZO and PZO, with an adjustable threshold to trigger.
Alert conditions have been added to this indicator for ease of use.
Volume Zone Oscillator, write-up by the author (recommended reading)
http:capitalsynergy.com/resources/IFTA09VZO.pdf
Volume Zone Oscillator, uses and formula
https:www.investopedia.com/articles/active-trading/072815/how-interpret-volume-zone-oscillator.asp
Price Zone Oscillator, uses and formula
https:www.investopedia.com/terms/p/price-zone-oscillator.asp

Forex Trade Sessions / Zones + Next Session VisibleAllows User To See Next Session.
Contains all 5 Forex Sessions: New York, London, Frankfurt, Asia (Tokyo), Sydney
Warning! A little buggy on smaller time frames like the 5 minute. 15 minute seems to work fine!

Gap finder (gold minds)This tool highlights where gaps happens and outlines in the chart where the gap zones are. If there is a gap up there is a green line, a gap down it is red. The gap zone is highlighted in blue. You can choose the size of your gap with the input menu to the desired size. Feel free to ask comment below. Made for the Gold Minds group

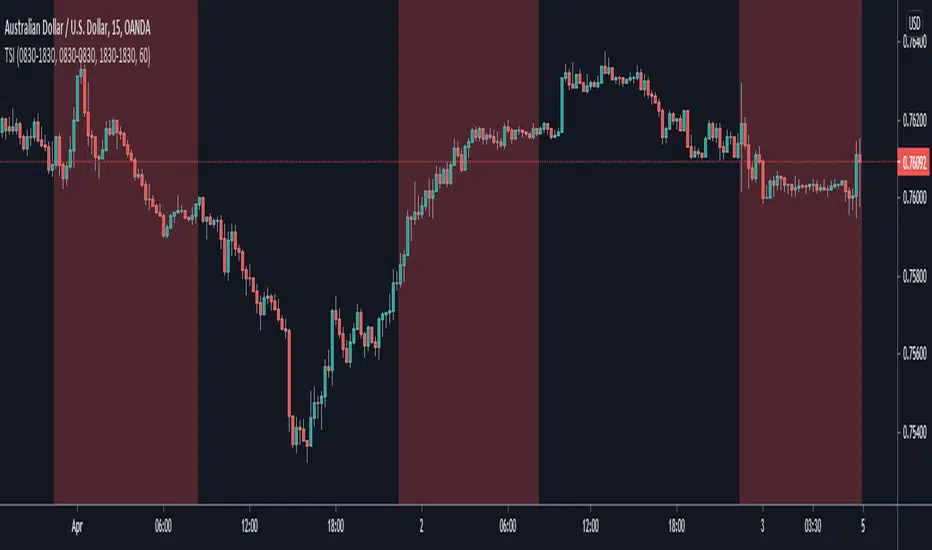
Trading Session IndicatorThis indicator is basically just a back-testing tool. All it does is highlight the background of your charts with the specified color within the specified timezone.
This is useful particularly for back-testing purposes, such as testing a day-trading strategy within a particular period of the day or ignoring signals that fall within the given timeframe (which is useful for ignoring setups during your testing that appear while you're asleep or at work etc.)
Take it easy :)
- Matt.
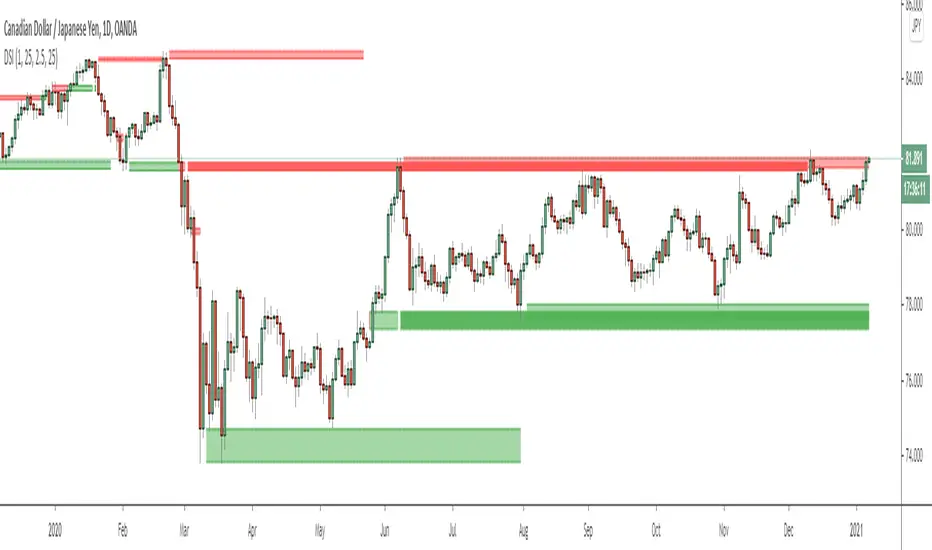
Dynamic Structure IndicatorThis is a dynamic structure indicator designed to map potential support and resistance zones (in all markets). It does this by looking back x amount of candles to identify major swing highs and lows on the specified reference timeframe, and then it draws a zone between the highest/lowest wick and the highest/lowest candle close across the chart until a new zone is created.
The settings are important because it gathers data from a separate reference timeframe, so sometimes it will map zones that aren’t really appropriate for lower timeframes. On lower timeframes (1Hr and under) I’d recommend setting the reference timeframe to your actual trading timeframe and increasing the lookback period to fine-tune the zone mapping. The script is set for 4 Hour forex charts by default.
Please note: the max zone option is disabled by default because it is different for every instrument, but this is a useful feature that I recommend using. Sometimes the indicator picks up huge gaps that aren’t really considered support or resistance zones. If this happens to you, use the zone size settings to invalidate huge (or tiny) zones. The zone size is in pips.
To be honest I didn’t get this indicator to be quite as accurate as I envisioned and it’s still a work in progress as I learn pine script, but this is the best I’ve been able to get it to function and with the right settings it works fairly well so I figured I might as well release this first version. Maybe someone with better skills than me can help refine it to more accurately identify major fractals and levels - if so, please get in touch! All traders should be able to identify their own major levels by eye anyway, but this script is intended to be a building block for future signal indicators I wish to develop.
Last of all - please don’t use this indicator to trade blindly! Often price will blast right through these zones and the zones aren’t always accurate. Remember that structure levels only work if they’re obvious to other traders, and always wait for confirmation signals that meet your trade plan rules before entering trades – especially reversals or counter-trend trades.
If you have any questions or tips to improve the script, feel free to leave a comment or private message me.
Enjoy, and good luck out there :)
- Matt.
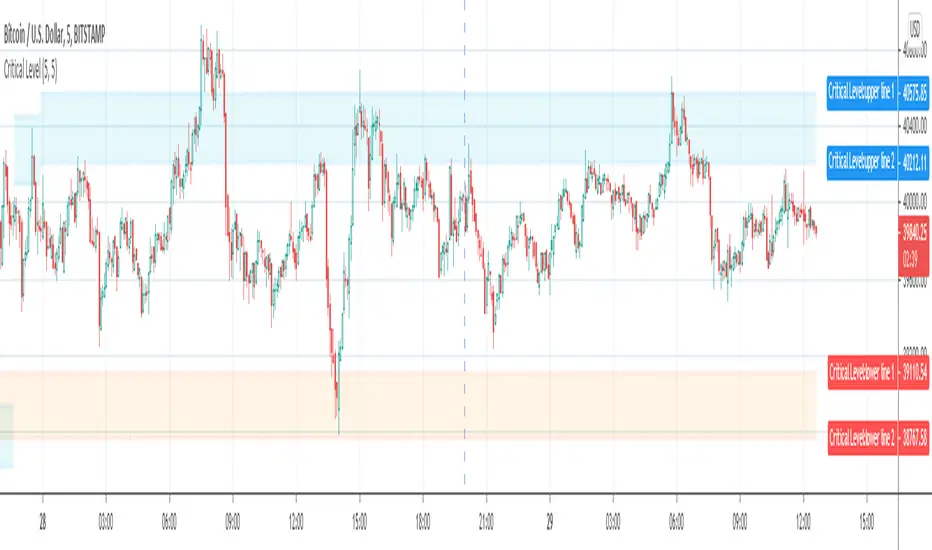
Critical Support & Resistance Level (supply & demand zone)Support & Resistance Level and Supply & Demand Zone are very common and popular jargon in technical analysis.
What is the difference between Support & Resistance Level and Supply & Demand Zone?
In my opinion, Support & Resistance Level is the value of price that tested couple times and hard to break. The zone is formed by two adjacent levels where price may oscillate between those two levels.
Imagine the levels as horizontal lines, and the zones are areas between two horizontal lines.
Why are they important?
In a nutshell, they indicate where the price direction may reverse so you can act accordingly.
There are a couple methods to draw the Support & Resistance Level and Supply & Demand Zone, In most case, people will use swing high or low, or pivot points as the level. But there are too many of them, and not all pivot points will become Support & Resistance Level.
Some of the support or resistance level is hard to break, but after the price break through that level, resistance will become support and vice versa, I define it as Critical Level .
If you draw a critical support or resistance level from the current bar and move backward to where it started, you will notice that some levels are formed by the pivot points from hundreds of bars ago. It's impossible to discover the Critical Levels if you don't have enough bars loaded on chart.
The purpose of this indicator is to plot critical support and resistance level automatically on chart.
It will work on all market, Stock, Forex and Futures. It also works on all timeframes.
Inputs:
The Strength inputs control the intensity of Support & Resistance Level.
The Alert input is the switch of alert function.
By enable Enhanced mode, the indicator will be more critical.
Check Showline input to plot level lines on chart, otherwise, it will plot zones only.
Time zoneRegular script to allocate the specified time range within a day.
TradingView in time is specified by UTC. I Moscow time (GMT +3) and the time specified in the script Default 1:00 - 13:00 Moscow time equal 09:00 - 21:00 ie -8 Hours from the Moscow time (-7 in summer).
========== ==========
Обычный скрипт для выделения указанного диапазона времени внутри дня.
Время в TradingView указывается по UTC. У меня московское время (GMT +3) и время указанное в скрипте по умолчания 01:00 - 13:00 по московскому времени равняется 09:00 - 21:00 , т.е. -8 часов от московского времени (-7 в летнее время).

[RS]Support and Resistance V0Support and Resistance using donchian channels to validate tops/bottoms
(note: while donchians follow price closely within look back window, this will only update new top/bottom when making new extremes in the donchian channel)
combo with other systems:

The Zone Trades v1.0The Zone is mention in New Trading Dimensions by Bill Williams,PhD.
The Zone is used for Entry Signal
Green Zone are painting Green Bars when Awesome Oscillator (AO) and Accelerater/Decelerator (AC) are both increasing.
Red Zone are painting Red Bars when Awesome Oscillator (AO) and Accelerater/Decelerator (AC) are both decreasing.
Gray Zone are painting Gray Bars AO and AC in difference changing
Gray Zone are indicate the indecision between bulls and bears.
Bill Williams, PhD. mention that Green Zone or Red Zone usually happen 6-8 bars Continuously.
The First Bar that change to be Green or Red color is the Signal Bar.
Entry Signal is the second bar in the same color as the Signal bar happen with Volume
Price go higher the high of previous Green Bar is Buy Signal. Entry Buy (Long) and place Stop at 1 tick lower the Low of previous bar.
Price go ;ower the Low of previous Red Bars is Sell Signal. Entry Sell (Short) and place Stop at 1 tick higher the High of previous bar.
Do not Entry if Green Bars or Red Bars completed 5 bars continuously.

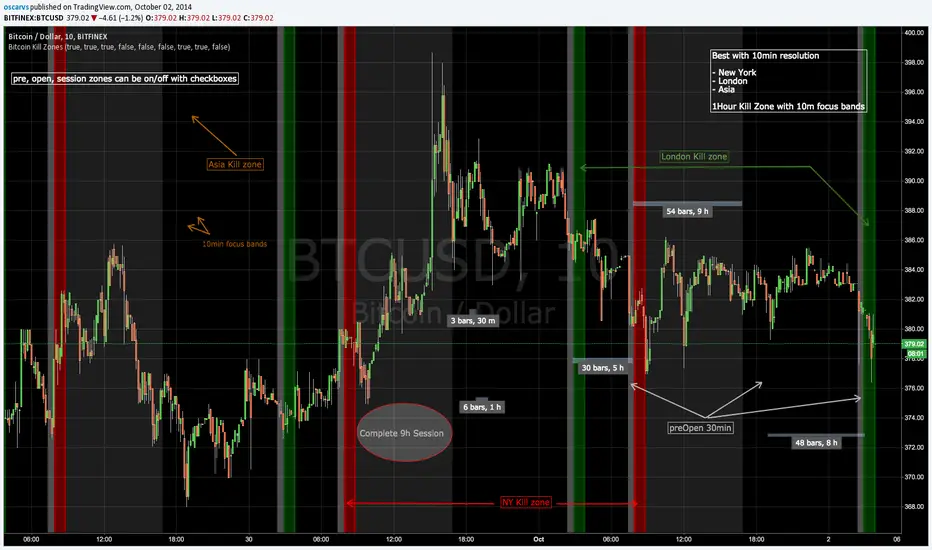
Bitcoin Kill ZonesGRAB THE LASTEST VERSION HERE:
*********************
This indicator shows when the candle is entering New York, London or Asia Kill Zone (open market).
gray: 30min before market opens.
red, green, orange: First 1 hour with 10min focus bands.
silver: complete 30min session market until close.
FIX NOTE:
Set this hours for Asia to fix the 1 hour difference:
2330-0000
0000-0010
0010-0050
0050-0100
0100-0900
* this is beta, in planning to mark dynamically ranges before/after open/close session and use some Fibs to have some ripple effect indicator
Updated code: github.com