Dynamic Swing Anchored VWAP STRAT (Zeiierman/PineIndicators)Dynamic Swing Anchored VWAP STRATEGY — Zeiierman × PineIndicators (Pine Script v6)
A pivot-to-pivot Anchored VWAP strategy that adapts to volatility, enters long on bullish structure, and closes on bearish structure. Built for TradingView in Pine Script v6.
Full credits to zeiierman.
Repainting notice: The original indicator logic is repainting. Swing labels (HH/HL/LH/LL) are finalized after enough bars have printed, so labels do not occur in real time. It is not possible to execute at historical label points. Treat results as educational and validate with Bar Replay and paper trading before considering any discretionary use.
Concept
The script identifies swing highs/lows over a user-defined lookback ( Swing Period ). When structure flips (most recent swing low is newer than the most recent swing high, or vice versa), a new regime begins.
At each confirmed pivot, a fresh Anchored VWAP segment is started and updated bar-by-bar using an EWMA-style decay on price×volume and volume.
Responsiveness is controlled by Adaptive Price Tracking (APT) . Optionally, APT auto-adjusts with an ATR ratio so that high volatility accelerates responsiveness and low volatility smooths it.
Longs are opened/held in bullish regimes and closed when the regime turns bearish. No short positions are taken by design.
How it works (under the hood)
Swing detection: Uses ta.highestbars / ta.lowestbars over prd to update swing highs (ph) and lows (pl), plus their bar indices (phL, plL).
Regime logic: If phL > plL → bullish regime; else → bearish regime. A change in this condition triggers a re-anchor of the VWAP at the newest pivot.
Adaptive VWAP math: APT is converted to an exponential decay factor ( alphaFromAPT ), then applied to running sums of price×volume and volume, producing the current VWAP estimate.
Rendering: Each pivot-anchored VWAP segment is drawn as a polyline and color-coded by regime. Optional structure labels (HH/HL/LH/LL) annotate the swing character.
Orders: On bullish flips, strategy.entry("L") opens/maintains a long; on bearish flips, strategy.close("L") exits.
Inputs & controls
Swing Period (prd) — Higher values identify larger, slower swings; lower values catch more frequent pivots but add noise.
Adaptive Price Tracking (APT) — Governs the VWAP’s “half-life.” Smaller APT → faster/closer to price; larger APT → smoother/stabler.
Adapt APT by ATR ratio — When enabled, APT scales with volatility so the VWAP speeds up in turbulent markets and slows down in quiet markets.
Volatility Bias — Tunes the strength of APT’s response to volatility (above 1 = stronger effect; below 1 = milder).
Style settings — Colors for swing labels and VWAP segments, plus line width for visibility.
Trade logic summary
Entry: Long when the swing structure turns bullish (latest swing low is more recent than the last swing high).
Exit: Close the long when structure turns bearish.
Position size: qty = strategy.equity / close × 5 (dynamic sizing; scales with account equity and instrument price). Consider reducing the multiplier for a more conservative profile.
Recommended workflow
Apply to instruments with reliable volume (equities, futures, crypto; FX tick volume can work but varies by broker).
Start on your preferred timeframe. Intraday often benefits from smaller APT (more reactive); higher timeframes may prefer larger APT (smoother).
Begin with defaults ( prd=50, APT=20 ); then toggle “Adapt by ATR” and vary Volatility Bias to observe how segments tighten/loosen.
Use Bar Replay to watch how pivots confirm and how the strategy re-anchors VWAP at those confirmations.
Layer your own risk rules (stops/targets, max position cap, session filters) before any discretionary use.
Practical tips
Context filter: Consider combining with a higher-timeframe bias (e.g., daily trend) and using this strategy as an entry timing layer.
First pivot preference: Some traders prefer only the first bullish pivot after a bearish regime (and vice versa) to reduce whipsaw in choppy ranges.
Deviations: You can add VWAP deviation bands to pre-plan partial exits or re-entries on mean-reversion pulls.
Sessions: Session-based filters (RTH vs. ETH) can materially change behavior on futures and equities.
Extending the script (ideas)
Add stops/targets (e.g., ATR stop below last swing low; partial profits at k×VWAP deviation).
Introduce mirrored short logic for two-sided testing.
Include alert conditions for regime flips or for price-VWAP interactions.
Incorporate HTF confirmation (e.g., only long when daily VWAP slope ≥ 0).
Throttle entries (e.g., once per regime flip) to avoid over-trading in ranges.
Known limitations
Repainting: Swing labels and pivot confirmations depend on future bars; historical labels can look “perfect.” Treat them as annotations, not executable signals.
Execution realism: Strategy includes commission and slippage fields, yet actual fills differ by venue/liquidity.
No guarantees: Past behavior does not imply future results. This publication is for research/education only and not financial advice.
Defaults (backtest environment)
Initial capital: 10,000
Commission value: 0.01
Slippage: 1
Overlay: true
Max bars back: 5000; Max labels/polylines set for deep swing histories
Quick checklist
Add to chart and verify that the instrument has volume.
Use defaults, then tune APT and Volatility Bias with/without ATR adaptation.
Observe how each pivot re-anchors VWAP and how regime flips drive entries/exits.
Paper trade across several symbols/timeframes before any discretionary decisions.
Attribution & license
Original indicator concept and logic: Zeiierman — please credit the author.
Strategy wrapper and publication: PineIndicators .
License: CC BY-NC-SA 4.0 (Attribution-NonCommercial-ShareAlike). Respect the license when forking or publishing derivatives.
Zeiierman

Dual-Phase Trend Regime Strategy [Zeiierman X PineIndicators]This strategy is based on the Dual-Phase Trend Regime Indicator by Zeiierman.
Full credit for the original concept and logic goes to Zeiierman.
This non-repainting strategy dynamically switches between fast and slow oscillators based on market volatility, providing adaptive entries and exits with high clarity and reliability.
Core Concepts
1. Adaptive Dual Oscillator Logic
The system uses two oscillators:
Fast Oscillator: Activated in high-volatility phases for quick reaction.
Slow Oscillator: Used during low-volatility phases to reduce noise.
The system automatically selects the appropriate oscillator depending on the market's volatility regime.
2. Volatility Regime Detection
Volatility is calculated using the standard deviation of returns. A median-split algorithm clusters volatility into:
Low Volatility Cluster
High Volatility Cluster
The current volatility is then compared to these clusters to determine whether the regime is low or high volatility.
3. Trend Regime Identification
Based on the active oscillator:
Bullish Trend: Oscillator > 0.5
Bearish Trend: Oscillator < 0.5
Neutral Trend: Oscillator = 0.5
The strategy reacts to changes in this trend regime.
4. Signal Source Options
You can choose between:
Regime Shift (Arrows): Trade based on oscillator value changes (from bullish to bearish and vice versa).
Oscillator Cross: Trade based on crossovers between the fast and slow oscillators.
Trade Logic
Trade Direction Options
Long Only
Short Only
Long & Short
Entry Conditions
Long Entry: Triggered on bullish regime shift or fast crossing above slow.
Short Entry: Triggered on bearish regime shift or fast crossing below slow.
Exit Conditions
Long Exit: Triggered on bearish shift or fast crossing below slow.
Short Exit: Triggered on bullish shift or fast crossing above slow.
The strategy closes opposing positions before opening new ones.
Visual Features
Oscillator Bands: Plots fast and slow oscillators, colored by trend.
Background Highlight: Indicates current trend regime.
Signal Markers: Triangle shapes show bullish/bearish shifts.
Dashboard Table: Displays live trend status ("Bullish", "Bearish", "Neutral") in the chart’s corner.
Inputs & Customization
Oscillator Periods – Fast and slow lengths.
Refit Interval – How often volatility clusters update.
Volatility Lookback & Smoothing
Color Settings – Choose your own bullish/bearish colors.
Signal Mode – Regime shift or oscillator crossover.
Trade Direction Mode
Use Cases
Swing Trading: Take entries based on adaptive regime shifts.
Trend Following: Follow the active trend using filtered oscillator logic.
Volatility-Responsive Systems: Adjust your trade behavior depending on market volatility.
Clean Exit Management: Automatically closes positions on opposite signal.
Conclusion
The Dual-Phase Trend Regime Strategy is a smart, adaptive, non-repainting system that:
Automatically switches between fast and slow trend logic.
Responds dynamically to changes in volatility.
Provides clean and visual entry/exit signals.
Supports both momentum and reversal trading logic.
This strategy is ideal for traders seeking a volatility-aware, trend-sensitive tool across any market or timeframe.
Full credit to Zeiierman.

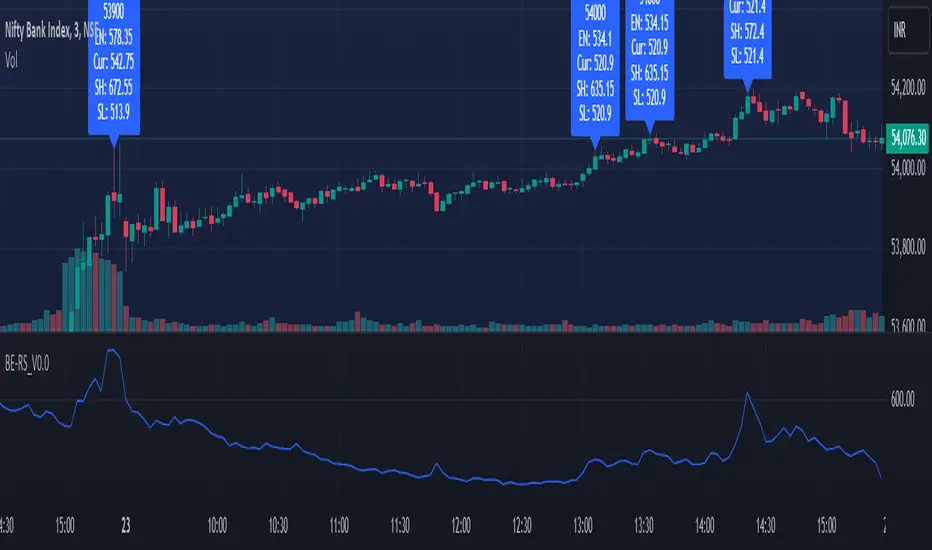
Rolling Straddle PremiumScript is Basically intended to provide insight's on the Rolling Straddle premium for the selected index based on the input settings.
Important thing to consider for the script to work seamlessly:
Specify the LTP in the input field (need not be very accurate)
Specify the Expiry Date for the Option Strike.
Ensure Profile matches to the chart script (Index Script)
Note: Zones marked in Blue, is the max level that indicator can track the option prices. beyond which it may fail to track, during such time consider reloading the indicator with Latest LTP .
Labels on the chart indicate that If i had shorted the Straddle, what would be my current position of that Straddle. however the rational behind shorting is only the pivot high points (not sure if this is right or wrong! )
Note On Labels: Labels are delayed basis the pivot point candles specified in the indicator settings.
EN: Entry Price (Straddle Premium) of the Strike Specified.
Cur: Current Price ( Current Straddle Premium ) of the Strike Specified.
SH: Max Straddle Premium ( Increase in Premium ) since position is active.
SL: Min Straddle Premium ( Premium Erosion ) since position is active.
Implied Orderblock Breaker (Zeiierman)█ Overview
The Implied Order Block Breaker (Zeiierman) is a tool designed to identify enhanced order blocks with imbalances. These enhanced order blocks represent areas where there is a rapid price movement. Essentially, this indicator uses order blocks and suggests that a swift price movement away from these levels, breaking the current market structure, could indicate an area that the market has not correctly valued. This technique offers traders a unique method to identify potential market inefficiencies and imbalances, serving as a guide for potential price revisits.
The indicator doesn't scan for imbalances in the traditional sense — where there's an absence of trades between two price levels — but instead, it identifies quick movements away from key levels that suggest where an imbalance might exist. Relying on crossovers and cross-unders in conjunction with pivot points and examining the high/low within the same period provides an innovative method for traders to spot these potentially undervalued or overvalued areas in the market. These inferred imbalances can be crucial for traders looking for price levels where the market might make significant moves.
█ How It Works
Bullish
Crossover: The closing price of a bar crosses above a pivot high, which is an indication that buyers are in control and pushing the price upwards.
New Low Within Period: There is a lower low within the same period as the pivot high. This suggests that after setting a high, the market pulled back to set a new low, potentially leaving a price gap on the way up as the price quickly recovers.
Bearish
Crossunder: The closing price of a bar crosses under a pivot low, indicating that sellers are taking control and driving the price down.
New High Within Period: There is a higher high within the same period as the pivot low. This condition suggests that the market rallied to a new high before falling back below the pivot low, potentially leaving a gap on the way down.
█ How to Use
The enhanced order blocks are often revisited, and the price may aim to 'fill' the potential imbalance created by the rapid price movement, thereby presenting traders with potential entry or exit points. This approach aligns with the idea that imbalances are frequently revisited by the market, and when combined with the context of Order Blocks, it provides even more confluence.
Example
Here, if the price drops rapidly after setting a new high—crossing under the pivot low—it may skip over certain price levels, creating a 'gap' that signifies an area where the price might have been overvalued (imbalance), which the market may revisit for a potential price correction or revaluation.
█ Settings
Period: Determines the number of bars used for identifying pivot highs and lows. A higher value gives more significant but less frequent signals, while a lower value increases sensitivity but might give more false positives.
Pivot Surrounding: Specifies the number of candles to analyze around a pivot point. Increasing this value broadens the analysis range, potentially capturing more setups but possibly including less significant ones.
-----------------
Disclaimer
The information contained in my Scripts/Indicators/Ideas/Algos/Systems does not constitute financial advice or a solicitation to buy or sell any securities of any type. I will not accept liability for any loss or damage, including without limitation any loss of profit, which may arise directly or indirectly from the use of or reliance on such information.
All investments involve risk, and the past performance of a security, industry, sector, market, financial product, trading strategy, backtest, or individual's trading does not guarantee future results or returns. Investors are fully responsible for any investment decisions they make. Such decisions should be based solely on an evaluation of their financial circumstances, investment objectives, risk tolerance, and liquidity needs.
My Scripts/Indicators/Ideas/Algos/Systems are only for educational purposes!

Golden Swap (Zeiierman)█ Overview
The Golden Swap indicator, as designed by Zeiierman, focuses on identifying reversal points around the key levels indicated by the indicator. This pattern works by analyzing the relationship between current and past price movements, considering factors like price symmetry, baseline boundaries, and precision pin bar formations. It can offer insights into potential market reversals, allowing for more precise entries and exits.
█ How It Works
Golden Swap Long
In a market with bullish momentum, we expect the price to dip a bit before it continues to rise again. This dip is like a small retreat in an overall march upwards. So, the pattern aims to assess whether the current period's dip is relatively shallow, indicating that the overall bullish momentum remains robust despite temporary price fluctuations.
Golden Swap Short
In a market with bearish momentum (indicating selling pressure or bearish sentiment), we may still see the price rise a bit before continuing its drop. This temporary rise is like a slight bounce in an overall downward movement. In simpler terms, even when the price bounces up a bit, it's not strong enough to overcome the recent pressure of selling. The sellers are still dominating, and the price will likely continue to drop.
█ The signal is reinforced by symmetry, BaselineBound criteria, and a bearish Precision PinBar.
⚪ Symmetry in Price Movements: The pattern uses the Symmetry Precision filter to analyze the symmetry of recent price movements. This helps in determining the likelihood of a reversal. A high degree of symmetry suggests a more reliable reversal signal.
⚪ BaselineBound Criteria: This component involves the BaselineBound Threshold, which acts as a filter to validate the strength of the potential reversal. Bullish and bearish conditions are assessed based on how the current close price compares to a calculated range around the high and low of the previous period.
⚪ Precision PinBar Analysis: The pattern also incorporates the Precision PinBar filter, which evaluates the characteristics of the recent price bars. A Precision PinBar is a candlestick with a small body and a long tail, indicating a potential reversal.
⚪ Display of Key Levels: The indicator can show Open, High, and Low levels for selected timeframes, helping traders identify key price points.
█ How to Use
The Golden Swap pattern is a valuable confirmation tool, particularly around key levels or session highs and lows. It highlights instances where a previous high or low has been respected, followed by a price reversal—flipping back up in an upward trend (Golden Swap Long) or flipping back down in a downward trend (Golden Swap Short). When this pattern emerges near a key level, it strongly suggests that the price will continue moving in the direction indicated by the current trend.
Consider it akin to a minor liquidity hunt above the previous high or below the previous low. The presence of the Golden Swap pattern, especially when aligned with other indicators and filters, enhances its reliability as a signal for the continuation of the prevailing market trend.
█ Settings
Timeframe Selection: Choose from various timeframes for signal calculation.
Filter Adjustments: Fine-tune the Symmetry Precision, BaselineBound Threshold, and Precision PinBar settings to filter signals according to specific criteria.
Display Options for Key Levels: Enable or disable the display of key price levels and select timeframes for these levels.
█ Related script using the same pattern filtering techniques
-----------------
Disclaimer
The information contained in my Scripts/Indicators/Ideas/Algos/Systems does not constitute financial advice or a solicitation to buy or sell any securities of any type. I will not accept liability for any loss or damage, including without limitation any loss of profit, which may arise directly or indirectly from the use of or reliance on such information.
All investments involve risk, and the past performance of a security, industry, sector, market, financial product, trading strategy, backtest, or individual's trading does not guarantee future results or returns. Investors are fully responsible for any investment decisions they make. Such decisions should be based solely on an evaluation of their financial circumstances, investment objectives, risk tolerance, and liquidity needs.
My Scripts/Indicators/Ideas/Algos/Systems are only for educational purposes!

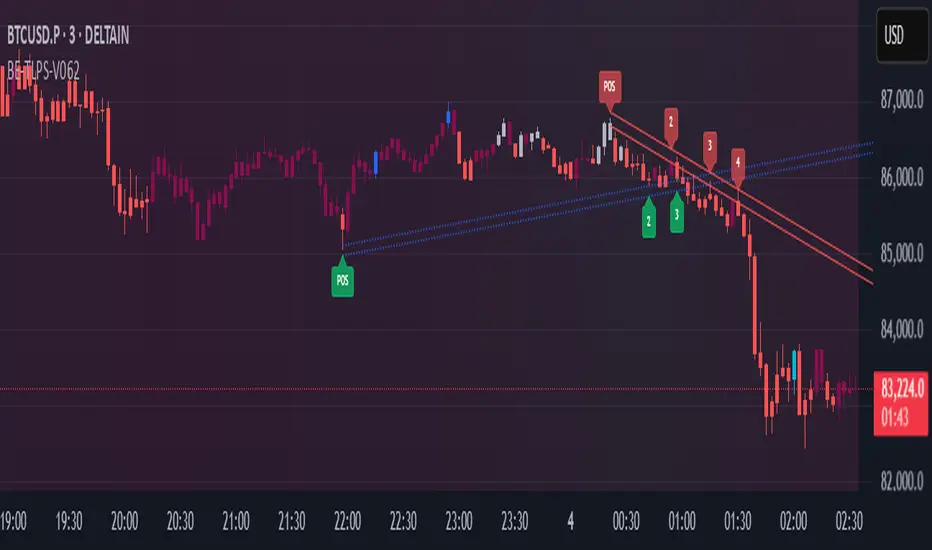
BE-TrendLines & Price SentimentsOverview
The trendline is one of the most potent and flexible tools in trading. A rising trendline indicates an upward trend, a falling trendline indicates a downward trend, and a flat trendline indicates a range-bound bond market.
Breakouts, price bounces, and reversal / Retest tactics are all types of trades that may be made using a trendline. Additionally, stop-loss and profit-trailing orders can be based on trendlines as support and resistance levels, appropriately.
Technical Calculations for Trendlines & Price Sentiments:
Pivot points for a specified time frame and the Prevailing High/Low for the most recent bars are used to derive trendlines. While Pivot Points alert us to price movements, High/Low tells us where Bulls and Bears find a middle ground. This provides a remarkable set of conditions from which to extrapolate the efficacy of the Trendlines.
The term "price sensitivity" refers to how much a change in the price of a product causes consumers to alter their purchase habits. It's the relationship between price shifts and shifts in consumer demand. So, for example, if a 30% jump in the cost of a product leads to a 10% drop in purchases, we can conclude that the item has a price sensitivity of 0.33%.
Basis the above theoretical statement, If the underlying asset's price drops, the indicator shall compute data on the amount of volume being pumped (Inflow vs Outflow) into the market (if available), or the percentage by which the price has changed. This will be compared to the recent drop rate to see if the behavior has changed at the similar value zone and non similar value zone. similar calculation shall be done if the price of the underlying rises.
Traders may benefit from hearing about Trendlines in their "Story Telling" form, which we now present. To help you comprehend it better, candles are divided into three Sentiment groups based on their color. Colors: Green (with its shades), Silver, and Red (including its shades). Green signifies a Bullish Trend, Silver a neutral trend, and Red a Brearish Trend.
Bullish Trend
Bearish Trend
Neutral Trend
Sentiment Price Cycle in Trending Market: Green (Directional Bullish), Dark Green (Bullish Trend Loosing its Strength), Silver (Neutral Trend), Red (Directional Bearish), Dark Red (Bearish Trend Loosing its Strength)
Sentiment Price Cycle in RangeBound Market: Green (Over Brought), Silver (Neutral) & Red (Over Sold)
How to Initiate Trade when price is within TL:
Fake Break Out Trade:
BreakDown Trade:
BreakOut Trade:
Couple of Other Features in the Indicator:
Single Alerts = These are the alerts where in, as and when the Event happens Alerts shall the trigerred. like On BreakOut, BreakDown, TouchOf Up TrendLine, TouchOf DownTrendLine, Retest Of Up TrendLine, Retest of DownTrendLine.
Conditional Alerts = These are those type of Alerts where in you can combine 2 or 3 conditions to trigger an Alert. Like
Sample 1 - After Down TL is tested for 3 times, If BreakOut happens and the setiment turns Bullish within 5 Candles.
Sample 2 - After Up TL is tested for 2 times, If Price Bounces backUp from TL and the setiment turns Bullish within 5 Candles.
Similarly you can customize the combination of events for getting the alert.
DISCLAIMER: No sharing, copying, reselling, modifying, or any other forms of use are authorized for our documents, script / strategy, and the information published with them. This informational planning script / strategy is strictly for individual use and educational purposes only. This is not financial or investment advice. Investments are always made at your own risk and are based on your personal judgement. I am not responsible for any losses you may incur. Please invest wisely.
Happy to receive suggestions and feedback in order to improve the performance of the indicator better.
Confirmation (Expo)
Confirmation (Expo) is a trading confirmation tool that can confirm any indicator, trend, setup, signal, or strategy. Once you have chosen the input source (any indicator) you can use the tool to confirm the trend, trend strength, overbought/oversold areas, retracements, and reversals. This tool is built for traders that already have a strategy or preferred indicator that they want to confirm. As a default, the indicator oscillates between overbought (or strong positive trend)/oversold (or strong negative trend). However, depending on the settings and input source many different layouts can occur.
Real-Time Alerts
No Repainting
Works on any market and in any timeframe
HOW TO USE
To confirm any indicator, trend, setup, signal, or strategy
INDICATOR IN ACTION
4 hour - chart
I hope you find this indicator useful , and please comment or contact me if you like the script or have any questions/suggestions for future improvements. Thanks!
I will continually work on this indicator, so please share your experience and feedback as it will enable me to make even better improvements. Thanks to everyone that has already contacted me regarding my scripts. Your feedback is valuable for future developments!
-----------------
Disclaimer
Copyright by Zeiierman.
The information contained in my scripts/indicators/strategies/ideas does not constitute financial advice or a solicitation to buy or sell any securities of any type. I will not accept liability for any loss or damage, including without limitation any loss of profit, which may arise directly or indirectly from the use of or reliance on such information.
All investments involve risk, and the past performance of a security, industry, sector, market, financial product, trading strategy, or individual’s trading does not guarantee future results or returns. Investors are fully responsible for any investment decisions they make. Such decisions should be based solely on an evaluation of their financial circumstances, investment objectives, risk tolerance, and liquidity needs.
My scripts/indicators/strategies/ideas are only for educational purposes!
ACCESS THE INDICATOR
• Contact me on TradingView or use the links below

Breakout & Trend & Scalping (Zeiierman)█ Overview
Breakout & Trend & Scalping (Zeiierman) transforms time, volume, and trend behavior into a unified visual framework for identifying market expansion, compression, and breakout phases. Instead of viewing price as an isolated movement, the indicator reinterprets it as a continuous relationship between time-driven flow, volume displacement, and trend momentum.
The system constructs a hybrid analytical field using OBV-based flow modeling, time–trend alignment, and adaptive candle smoothing, providing a clear and fluid representation of both breakout probability and structural trend strength.
This advanced framework adapts to different market contexts, including intraday scalping, swing-trend validation, and multi-timeframe continuation analysis, revealing how volume and trend energy accumulate before volatility expansion.
⚪ Why This One Is Unique
Unlike conventional breakout or trend indicators that rely solely on price or volatility, this tool integrates time-weighted OBV mechanics, multi-timeframe trend correlation, and volatility-normalized candle transformation.
Its design leverages an adaptive Time–Trend Integration Engine that adjusts dynamically based on the selected timeframe and method. The result is a fluid, self-normalizing view of market rhythm, capturing not only the visible structure of trends but also the hidden buildup of momentum that precedes breakouts.
█ Main Feature: BTS Adaptive Candle System
The BTS Adaptive Candle System unifies time-based and trend-based flow analysis into a single visual model of market behavior. It synchronizes short-term momentum with long-term trend equilibrium, revealing how volume and directional energy evolve across different temporal structures.
The flow is inherently adaptive. During stable phases, it compresses volatility to emphasize directional persistence and trend continuity. When acceleration builds, it expands to highlight breakout potential and the ignition of new momentum.
Green-to-red and (red-to-green) transitions indicate shifts in order-flow dominance, while color intensity reflects the relative strength of participation. The built-in smoothing system filters out random noise while maintaining fast response to emerging direction, making the BTS Candle System equally effective for scalping precision, breakout confirmation, and long-term trend tracking.
█ How to Use
⚪ Trend Trading
Bullish trends appear when candles remain near the top of their range with bright, steady coloration. This structure shows sustained accumulation and consistent trend support. Fading color or mixed tones suggest short pauses or shallow pullbacks within an ongoing uptrend.
Bearish trends form when candles cluster near the lower range and deepen in red intensity, reflecting growing selling pressure. Consistent red sequences mark continued distribution, while lighter tones or brief color shifts often precede corrective bounces within a broader downtrend.
⚪ Trend Change Trading
When a large BTS candle crosses the midline, it often marks a decisive shift in market control. A strong candle breaking above the midline reflects dominant buying flow and the early phase of bullish momentum, often signaling the start of a new upward trend.
Conversely, when a large candle drops below the midline, it shows dominant selling pressure and the potential beginning of a downward cycle.
These midline transitions represent key moments where institutional flow changes direction. A rapid color shift or fading saturation in candles around these areas frequently precedes a trend reversal or volatility breakout, making them powerful confirmation points for both breakout and trend-change strategies.
⚪ Retracement/Pullback Trading
When BTS candles remain green or turn light yellow near the midline, it indicates balanced momentum as price consolidates during a temporary retracement. A renewed shift back to bright green candles from this area often signals the end of the pullback and the continuation of the uptrend.
In a downtrend, when BTS candles shift to light yellow or fade toward the midline, it shows a temporary slowdown in selling pressure as the price retraces upward. A return to deep red candles after this brief balance phase confirms renewed selling momentum and continuation of the prevailing downtrend.
⚪ Breakout Trading
Big candles in the BTS indicate a shift in control. If this occurs around a resistance level, there is a high chance that price will break out upward.
Similarly, if a large downward BTS candle appears near a support level, there is a high chance that a bearish breakout will follow through.
█ How It Works
⚪ Integrated Market Framework
The BTS system merges time, trend, and volatility behavior into a single adaptive flow field. It constantly balances fast and slow market components, maintaining a smooth equilibrium between short-term reactions and long-term structure.
Calculation: Uses normalized scaling and adaptive synchronization to align directional momentum across changing market states.
⚪ Core Trend Engine
At its center, the model interprets how price movement evolves within its volatility range. It tracks shifts in directional energy and transforms them into a stable momentum surface that highlights both trend continuation and turning points.
Calculation: Applies equilibrium-based mapping to sustain consistent directional flow even during market acceleration or compression.
⚪ Volatility Envelope System
The indicator forms a dynamic envelope around price movement, expanding and contracting with the current market speed. These zones reflect where energy concentrates or fades, helping visualize breakout potential and exhaustion levels.
Calculation: Adapts envelope boundaries through volatility-responsive scaling and balanced symmetry control.
⚪ Adaptive Time Modes
Two adaptive modes — Time and Trend — control how the model responds to changing conditions. The system automatically adjusts its responsiveness, allowing it to behave as a fast scalping model or a slow trend tracker without losing structural balance.
Calculation: Dynamically modifies its internal scaling to maintain equilibrium between speed and smoothness across selected timeframes.
-----------------
Disclaimer
The content provided in my scripts, indicators, ideas, algorithms, and systems is for educational and informational purposes only. It does not constitute financial advice, investment recommendations, or a solicitation to buy or sell any financial instruments. I will not accept liability for any loss or damage, including without limitation any loss of profit, which may arise directly or indirectly from the use of or reliance on such information.
All investments involve risk, and the past performance of a security, industry, sector, market, financial product, trading strategy, backtest, or individual's trading does not guarantee future results or returns. Investors are fully responsible for any investment decisions they make. Such decisions should be based solely on an evaluation of their financial circumstances, investment objectives, risk tolerance, and liquidity needs.
Ücretli komut dosyası

Trend Stability (Expo)
Trend Stability (Expo) is a multifunctional trend trading tool that identifies all aspects of trend trading. The indicator helps traders to stay on the right side of the market, identify retracements, reversals, and trend strength. In addition to that, we have added momentum - moves for traders that want to do trend scalping. The candle coloring displays the current trend and gives early signs of trend reversals and retracements.
➤ All in one trading tool that filters out noise and leaves us with insights that matter.
Real-Time with Alerts
No Repainting
Works on any market and in any timeframe
HOW TO USE
Use the indicator to gain insights into all aspects of trend trading:
Trend Stability/equilibrium
Trend Strength
Trend Retracements
Trend Reversals
Trend Filter
Momentum Moves
INDICATOR IN ACTION
4-hour chart
The setting used on the chart below displays negative momentum-moves with a noise-free positive trend.
I hope you find this indicator useful , and please comment or contact me if you like the script or have any questions/suggestions for future improvements. Thanks!
I will continually work on this indicator, so please share your experience and feedback as it will enable me to make even better improvements. Thanks to everyone that has already contacted me regarding my scripts. Your feedback is valuable for future developments!
-----------------
Disclaimer
Copyright by Zeiierman.
The information contained in my scripts/indicators/ideas does not constitute financial advice or a solicitation to buy or sell any securities of any type. I will not accept liability for any loss or damage, including without limitation any loss of profit, which may arise directly or indirectly from the use of or reliance on such information.
All investments involve risk, and the past performance of a security, industry, sector, market, financial product, trading strategy, or individual’s trading does not guarantee future results or returns. Investors are fully responsible for any investment decisions they make. Such decisions should be based solely on an evaluation of their financial circumstances, investment objectives, risk tolerance, and liquidity needs.
My scripts/indicators/strategies/ideas are only for educational purposes!
ACCESS THE INDICATOR
• Contact me on TradingView or use the links below

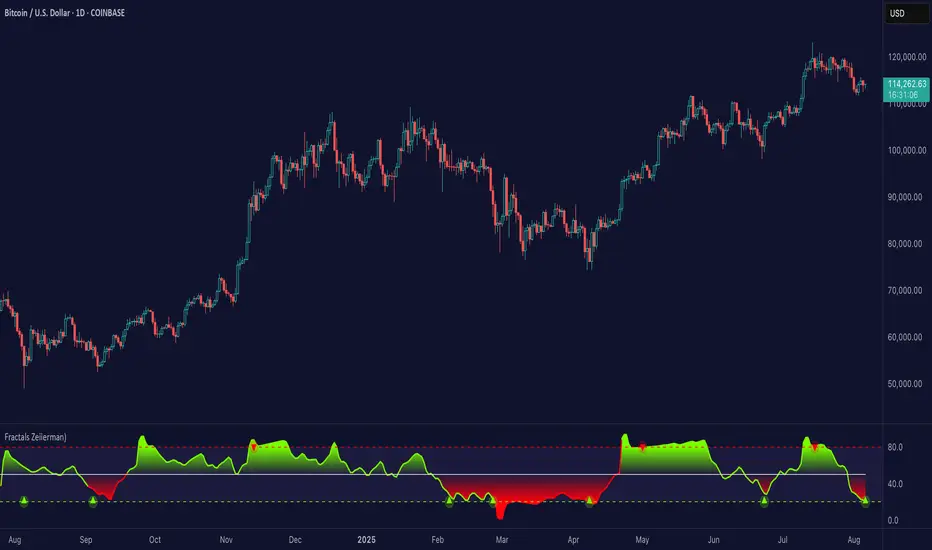
Fractals (Expo)
Fractals (Expo) make use of fractals to identify trends and reversals. The indicator is designed to adapt smoothly and quickly to significant price moves in order to identify trend reversals as well as filtering out noise in an established trend. The indicator is simple to use and understand therefore valuable to all trading styles.
The user has the ability to enable a custom input source which gives the user great flexibility and full control over what the calculations should be based on. The default input source is fractals from the swing points of the market.
Real-Time Trend Alerts
No Repainting
Works on any market and in any timeframe
HOW TO USE
Use the indicator to gain insights into trends and trend reversals.
Identify Trends
Identify Trend reversals
Use it as a Trend filter
INDICATOR IN ACTION
Daily Chart
I hope you find this indicator useful , and please comment or contact me if you like the script or have any questions/suggestions for future improvements. Thanks!
I will continually work on this indicator, so please share your experience and feedback as it will enable me to make even better improvements. Thanks to everyone that has already contacted me regarding my scripts. Your feedback is valuable for future developments!
-----------------
Disclaimer
Copyright by Zeiierman.
The information contained in my scripts/indicators/ideas does not constitute financial advice or a solicitation to buy or sell any securities of any type. I will not accept liability for any loss or damage, including without limitation any loss of profit, which may arise directly or indirectly from the use of or reliance on such information.
All investments involve risk, and the past performance of a security, industry, sector, market, financial product, trading strategy, or individual’s trading does not guarantee future results or returns. Investors are fully responsible for any investment decisions they make. Such decisions should be based solely on an evaluation of their financial circumstances, investment objectives, risk tolerance, and liquidity needs.
My scripts/indicators/strategies/ideas are only for educational purposes!
ACCESS THE INDICATOR
• Contact me on TradingView or use the links below
Buy & Sell Order (Expo)
Buy/Sell Order (Expo) is a unique and important indicator that provides information about Buy & Sell order patterns. The indicator helps to identify real-time large Buy & Sell Orders that have a significant impact on the price. These buy and sell orders can be the start of a trend move or a sign of reversal.
The indicator is divided into a Sell-side (red zone) and a Buy-side (green zone) in order to highlight the different order flows. Greater candlesticks mean significant buy/sell orders! These are the ones we want to keep track of.
The price levels where a large Buy or Sell order occurs at should be considered as key levels. These key- levels are often re-tested in the future. Traders should keep track of them.
Real-Time
No Repainting
Works on any market and in any timeframe
HOW TO USE
Identify Large Buy / Sell Order
Identify potential trend move
Identify potential reversal
INDICATOR IN ACTION
1-hour chart
I hope you find this indicator useful , and please comment or contact me if you like the script or have any questions/suggestions for future improvements. Thanks!
I will continually work on this indicator, so please share your experience and feedback as it will enable me to make even better improvements. Thanks to everyone that has already contacted me regarding my scripts. Your feedback is valuable for future developments!
-----------------
Disclaimer
Copyright by Zeiierman.
The information contained in my scripts/indicators/ideas does not constitute financial advice or a solicitation to buy or sell any securities of any type. I will not accept liability for any loss or damage, including without limitation any loss of profit, which may arise directly or indirectly from the use of or reliance on such information.
All investments involve risk, and the past performance of a security, industry, sector, market, financial product, trading strategy, or individual’s trading does not guarantee future results or returns. Investors are fully responsible for any investment decisions they make. Such decisions should be based solely on an evaluation of their financial circumstances, investment objectives, risk tolerance, and liquidity needs.
My scripts/indicators/strategies/ideas are only for educational purposes!
ACCESS THE INDICATOR
• Contact me on TradingView or use the links below

Trend & Contrarian (Expo)Trend & Contrarian (Expo) is a powerful trend tool with adaptive contrarian- signals. A strong trend is displayed by the background color and the unique Trend dots/line can be used to confirm a strong trend or to identify early trend reversals. The contrarian-signals are adapting dynamically to price moves and should be used as 'preparation' or 'warning' prior to trigger, should be confirmed by a trend reversals signal or by other indicators.
The contrarian signals should only be used if the user fully understands how they work, please test the feature before entering a trade based on it. However, these signals can be very valuable if used correctly.
Green background color ➞ Strong Positive Trend
Red background color ➞ Strong Negative Trend
No background color? ➞ No strong trend. The Trend Dots/line determine the trend
HOW TO USE
Identify strong trends
Identify trend reversals
Identify contrarian signals
INDICATOR IN ACTION
4-hour chart
I hope you find this indicator useful , and please comment or contact me if you like the script or have any questions/suggestions for future improvements. Thanks!
I will continually work on this indicator, so please share your experience and feedback as it will enable me to make even better improvements. Thanks to everyone that has already contacted me regarding my scripts. Your feedback is valuable for future developments!
-----------------
Disclaimer
Copyright by Zeiierman.
The information contained in my scripts/indicators/ideas does not constitute financial advice or a solicitation to buy or sell any securities of any type. I will not accept liability for any loss or damage, including without limitation any loss of profit, which may arise directly or indirectly from the use of or reliance on such information.
All investments involve risk, and the past performance of a security, industry, sector, market, financial product, trading strategy, or individual’s trading does not guarantee future results or returns. Investors are fully responsible for any investment decisions they make. Such decisions should be based solely on an evaluation of their financial circumstances, investment objectives, risk tolerance, and liquidity needs.
My scripts/indicators/strategies/ideas are only for educational purposes!
ACCESS THE INDICATOR
• Contact me on TradingView or use the links below

ATR Trend & ATR Top/Bottom (Zeiierman)█ Overview
ATR Trend & ATR Top/Bottom (Zeiierman) blends momentum, volatility, and adaptive trend analysis into a unified framework. It fuses a dynamic oscillator with ATR-based exhaustion detection to identify trend direction, impulses, and potential reversals within the same structure.
Rather than viewing volatility as noise, this tool interprets it as trend expansion, which represents directional conviction, while contraction signals absorption or exhaustion. By combining multi-phase smoothing, adaptive ATR scaling, and contextual trend filtering, the indicator delivers a complete picture of when a market is accelerating, stabilizing, or reversing.
It performs best once a trend has matured and volatility normalizes around a directional core, giving traders the confidence to participate in established moves while dynamically managing risk.
⚪ Why This One Is Unique
Traditional trend oscillators rely on fixed parameters that degrade across assets or timeframes. ATR Trend & ATR Top/Bottom instead employs adaptive weighting and volatility-normalized filtering that automatically aligns with the current market structure.
Its framework integrates three distinct components:
Adaptive Oscillator Core that reveals the internal rhythm of trend and momentum.
ATR Top/Bottom Layer that marks exhaustion and potential turning zones.
Trend Signal & Dynamic Trailing Stop Engine that highlights directional shifts, confirms alignment with the prevailing trend, and transforms trend data into a self-adjusting risk-management system.
█ Main Features
⚪ ATR Trend (The Main Oscillator)
The ATR Trend serves as the indicator’s primary oscillator, translating price and volatility dynamics into a smooth directional curve. When the oscillator line remains above its equilibrium, bullish momentum dominates; when it stays below, bearish momentum prevails. Color transitions reflect real-time trend bias, helping traders immediately recognize whether the market is strengthening or weakening.
This component forms the structural core of the tool, defining overall trend direction, momentum intensity, and transition zones.
It also visualizes trend expansion through the fast leading signal line. When this line crosses above the upper or below the lower boundary, it signals an expansive move within the active trend, often representing short-term overbought or oversold conditions, and can also indicate trend strength in the prevailing market direction.
⚪ ATR Top/Bottom
The ATR Top/Bottom layer highlights potential exhaustion zones within the trend. Green peaks reveal areas of buy-side saturation, suggesting a possible slowdown or reversal in bullish momentum, while red peaks mark sell-side extremes, often appearing before stabilization or renewed strength. These zones help traders identify when a move is becoming stretched or losing balance, offering valuable context for managing exits, scaling out, or anticipating reversals. However, these areas can extend for a prolonged period when price is in a strong, sustained trend, reflecting persistent directional pressure rather than immediate exhaustion.
⚪ Trend Channel Hits
The Trend Channel Hits feature visualizes moments when the price interacts with the projected internal trend channel boundaries of the prevailing trend.
Green arrows appear when the price touches the upper boundary of the trend channel. This can indicate two possible outcomes:
A potential breakout from a negative trend into a developing bullish trend, as price breaks above the upper boundary of the descending channel.
A take-profit zone within an established bullish trend, as price reaches the upper channel where mean reversion is likely to occur.
Red arrows appear when the price touches the lower boundary of the trend channel. This can indicate:
A potential breakout from a positive trend into a developing bearish trend, as price breaks below the lower boundary of the rising channel.
A take-profit opportunity within an established bearish trend, as price reaches the lower channel where mean reversion or short-term recovery is likely to occur.
These signals provide early visual confirmation of trend exhaustion, continuation, or structural breakout, helping traders refine entries, exits, and profit-taking within the broader market context.
█ How to Use
⚪ Trend Following
When the oscillator line remains above the mid-level, the market is in a bullish phase. When it stays below the mid-level, the trend is bearish. Periods where the oscillator holds close to its upper or lower limits indicate strong, sustained momentum in that direction. Watch for color changes or crossovers near the mid-level, as these often signal an upcoming shift in trend control.
Bullish Trend
Bearish Trend
⚪ Trend Signals
To help traders identify and participate in trend trades, the indicator includes pre-built Trend Signals that highlight optimal entry conditions within confirmed market trends. These signals are designed to activate only once the market shows established directional momentum, ensuring higher reliability and filtering out noise from short-term fluctuations.
In addition, the indicator includes built-in take-profit markers for each signal. These serve as suggested partial exit levels, helping traders systematically secure profits while allowing the remaining position to follow the trend with the dynamic trailing stop.
Before relying on the signals, always confirm that the market has been trending for a sustained period. This ensures that entries align with genuine long-term directional strength rather than temporary volatility.
Bullish Trend Signals
Bullish Trend Signals appear during an established uptrend when the indicator detects confirmed positive momentum and stable directional structure. These signals mark potential continuation points where buyers regain control after short-term pauses or pullbacks.
The objective is to follow the trend signals, manage trades with the dynamic trailing stop, and consider taking partial profits at the inbuilt take-profit levels plotted by the indicator.
This setup works best when the market is trending clearly upward and has demonstrated consistent buying strength over time.
Bearish Trend Signals
Bearish Trend Signals occur during a confirmed downtrend, indicating that selling momentum remains dominant and the trend structure is intact. They typically appear after short-term corrective rallies, signaling that sellers are reasserting control within the broader bearish environment.
As with bullish signals, the goal is to follow the trend signals and trailing stop to capture sustained downside movement, while using the inbuilt take-profit levels to lock in partial gains as the move progresses. This approach performs best when the market is in a clear, mature downtrend with persistent selling pressure and expanding downside momentum.
⚪ Trend Impulses
Impulses represent short bursts of directional acceleration within the active trend.
A surge above the upper band reflects bullish expansion.
A move below the lower band marks bearish acceleration.
These impulses often precede short consolidations before the trend resumes. Traders can use them to scale into strong phases or take partial profits at temporary extremes.
⚪ Reversals
Enable ATR Top/Bottom to monitor momentum peaks:
Red peaks show strong selling momentum. When these peaks start to fade, it can signal that selling pressure is weakening and a potential recovery may be forming.
Green peaks show strong buying momentum. As their size shrinks, it may signal that buying pressure is slowing, and a possible pullback or reversal could follow.
⚪ Extended Trends
For traders who want to visualize intense, extended trend phases, enable the ATR Top/Bottom feature and increase the Length setting to around 30, with Sensitivity set between 40 and 50. Consider reducing the ATR Trend Length to 50 to gain clearer signals of when a trend begins and ends.
This configuration extends the ATR Top/Bottom zones across the entire duration of a major trend, making it easier to identify sustained directional strength and long-lasting momentum phases.
█ How It Works
⚪ Adaptive Oscillator Engine
The oscillator interprets directional flow through a combination of momentum mapping and volatility weighting. It continuously re-centers its equilibrium to reflect evolving market structure, producing a stable yet responsive representation of underlying trend force.
Calculation: Applies multi-domain smoothing and adaptive normalization to align amplitude with volatility while maintaining directional coherence.
⚪ ATR Top/Bottom Detection
The exhaustion layer isolates high-magnitude deviations from the current volatility envelope, identifying potential top and bottom regions where expansion may stall.
Calculation: Uses proportional volatility thresholds and dynamic range modeling to highlight statistically elevated momentum extremes without over-reacting to noise.
-----------------
Disclaimer
The content provided in my scripts, indicators, ideas, algorithms, and systems is for educational and informational purposes only. It does not constitute financial advice, investment recommendations, or a solicitation to buy or sell any financial instruments. I will not accept liability for any loss or damage, including without limitation any loss of profit, which may arise directly or indirectly from the use of or reliance on such information.
All investments involve risk, and the past performance of a security, industry, sector, market, financial product, trading strategy, backtest, or individual's trading does not guarantee future results or returns. Investors are fully responsible for any investment decisions they make. Such decisions should be based solely on an evaluation of their financial circumstances, investment objectives, risk tolerance, and liquidity needs.
Ücretli komut dosyası

Range & Trend (Zeiierman)█ Overview
Range & Trend (Zeiierman) is a trend-first mapping of price that fuses an adaptive Range & Trend Line, a Trend Buffer (noise gate), a volatility-aware Trend Tracker, and optional Range Levels & Candles to reveal where trend is establishing, compressing, or handing off to a ranged regime.
Execution is guided by graded Buy/Sell labels (Regular / Plus / Strong), structural HH/HL & LL/LH markers with optional Peak Profit readouts, and a multi-TF Timeframe Scanner for alignment.
⚪ Why This One Is Unique
Unlike single-source trend lines, this version layers two orthogonal stabilizers:
a Range & Trend core that adapts its band size to volatility and dispersion, and
a dynamic smoothing buffer that dampens insignificant fluctuations, ensuring only meaningful trend movements affect signal output.
Signals are graded (Regular / Plus / Strong) based on contextual conditions, allowing traders to gauge the conviction behind each trend event. Range Candles add regime context by coloring bars only when a statistically consistent range structure forms, highlighting potential consolidation or transitional market phases. A lightweight Timeframe Scanner completes the workflow, broadcasting alignment from intraday to daily without adding chart clutter.
█ Main features
⚪ Range & Trend Line – Signal Generator
Adaptive directional mapping forms the foundation of the system. It highlights the active trend through color transitions and generates graded Buy/Sell labels (Regular / Plus / Strong) to reflect the strength of confirmation. The line responds dynamically to volatility, revealing when momentum is expanding, stabilizing, or reversing.
Unlike typical reactive signal tools, this model isolates only the most strong and meaningful trend transitions — those with the structural weight to establish or extend a new long-term directional phase. Each signal represents a filtered, high-conviction shift rather than a short-term fluctuation.
⚪ Trend Buffer (Noise Gate)
A precision filter that smooths the core trend output and suppresses false flips caused by short-term noise. It enhances visual consistency and provides the confirmation layer used to promote Regular signals to Plus strength when agreement occurs between buffer and core.
⚪ Trend Tracker
A trailing validation line that tracks directional health and trend persistence. It advances only in the direction of the active move, creating an adaptive stop-like reference. Tracker alignment helps identify trend exhaustion and contributes to Strong-grade signal confirmation.
⚪ Range Levels & Candles
Contextual zones that identify periods of compression or balance. When a valid range forms, candles are shaded within it, distinguishing ranging environments from trending conditions. These zones help anticipate breakouts and define natural support and resistance areas.
⚪ Live Structure (HH/HL & LL/LH with Peak Profit)
Displays real-time structural evolution — Higher Highs/Lows during uptrends and Lower Highs/Lows during downtrends. The optional Peak Profit label shows performance since the last regime change, offering an immediate view of current trend efficiency.
⚪ Timeframe Scanner
A compact multi-timeframe alignment panel that visualizes bullish or bearish trend states across user-selected intervals. It provides fast confirmation of directional consensus, helping traders act only when the broader structure supports their chosen bias.
█ How to Use
⚪ Range & Trend Line – Signal Generator
The Range & Trend Line is the core signal engine — its color shifts mark confirmed directional changes. This is where the system produces the graded Buy/Sell signals shown as ▲ / ▼ labels. Each grade reflects how many internal layers agree at the moment of signal creation:
Regular (▲ / ▼) – Triggered by a confirmed flip in the Range & Trend core. It appears when the base trend direction changes and is the earliest signal of potential reversal.
Plus (▲ + / ▼ +) – Requires the Trend Buffer to confirm the same direction. This upgrade indicates stronger trend agreement and higher reliability.
Strong (▲ ++ / ▼ ++) – These are high-conviction continuation signals and typically occur after structural confirmation.
How to trade them: Regular signals provide early awareness; Plus signals suggest confirmation; Strong signals mark trend maturity or high-probability continuations. Always trade in the direction of the prevailing trend. Use the Trend Buffer or Live Structure to confirm the dominant directional bias before acting on a signal.
⚪ Support and Resistance
The Range & Trend Line and the Buffer Line can act as dynamic support and resistance zones. Price often reacts around these levels, confirming whether the current move is continuing or losing strength.
Look for confirmation or rejection signals near these lines. Reactions around them often mark key decision points within the active trend.
⚪ Range Levels & Candles
Highlights when price enters structured consolidation zones. Candle coloring activates only inside validated ranges, helping to identify areas that show the typical characteristics of a ranging market. These zones visually separate balanced conditions from active trends and provide context for potential transitions.
Watch how price reacts around the upper and lower range levels. Look for false or confirmed breakouts, and expect price to move between these boundaries until a clear breakout develops. Range edges can also serve as practical entry or stop zones.
█ How It Works
⚪ Range & Trend Core
The main engine that defines the chart’s directional trend line. It adapts to changing market conditions, showing a smooth and reliable view of trend strength and direction.
Calculation: Builds a range-adaptive structure whose width adjusts with current volatility. The core moves toward new highs or lows but limits pullbacks to avoid false shifts. Several smoothing methods work together to create a steady, low-lag trend path.
⚪ Trend Buffer (Noise Gate)
A stabilizing layer that keeps the main trend line steady when price noise increases. It improves visual clarity and helps confirm true direction before a trend update appears.
Calculation: Uses a feedback-based update that reacts more when movement is strong and less when noise dominates. This lets the buffer ignore minor fluctuations while staying responsive to real trend changes.
⚪ Trend Tracker
A support line that follows the main move and helps confirm when a trend remains intact. It also serves as a guide for managing active positions.
Calculation: Applies a one-way trailing system that only moves in the direction of the trend. The offset adjusts with volatility, keeping a consistent distance that tightens or widens with market energy.
⚪ Buy/Sell Signal Engine (Regular / Plus / Strong)
The signal system that classifies entries by strength and confirmation level. It reacts to real-time trend changes while filtering weak reversals.
Calculation: Detects state flips in the Range & Trend Core, checks for agreement with the buffer, and rates each signal by historical pattern support. Higher-grade signals appear only when several layers confirm continuation strength.
⚪ Range Levels & Candles
Identifies short-term balance zones and highlights candles within those areas. These zones show where price pauses before the next directional move.
Calculation: Finds upper and lower range limits based on recent highs and lows, confirming only when several bars form a stable zone. Candle colors and level lines extend slightly forward to show likely reaction areas.
⚪ Swing Points & Peak Profit
Marks key turning points and measures performance since the last reversal. It helps track the strength and duration of each movement.
Calculation: Keeps a short memory of recent pivots and updates only when a new high or low replaces the last one. The percent distance from the last flip to the current bar defines the live Peak Profit reading.
⚪ Timeframe Scanner & Alert Aggregator
Combines directional data from multiple timeframes into a single view. Alerts trigger only when all selected timeframes agree.
Calculation: Gathers the trend state from each timeframe, converts it to a simple up or down value, and compares the results. When every layer matches your chosen direction, one clear, high-confidence alert is sent.
-----------------
Disclaimer
The content provided in my scripts, indicators, ideas, algorithms, and systems is for educational and informational purposes only. It does not constitute financial advice, investment recommendations, or a solicitation to buy or sell any financial instruments. I will not accept liability for any loss or damage, including without limitation any loss of profit, which may arise directly or indirectly from the use of or reliance on such information.
All investments involve risk, and the past performance of a security, industry, sector, market, financial product, trading strategy, backtest, or individual's trading does not guarantee future results or returns. Investors are fully responsible for any investment decisions they make. Such decisions should be based solely on an evaluation of their financial circumstances, investment objectives, risk tolerance, and liquidity needs.
Ücretli komut dosyası

Trend Average (Expo)
Trend Average (Expo) measures the overall trend strength and how strong the current price move/momentum is. The color of the average helps to identify the strength and momentum of the trend.
The user can enable Bar Color that coloring the candlesticks based on the trend strength.
The user can choose between different average calculations, such as SMA, WMA, HMA, to mention a few.
This indicator is for those that don't want to have the Trend Oscillator (Expo) but still want to keep track of the trend strength and direction. There is a minor difference in how the trend is calculated due to the nature of input variables.
HOW TO USE
Identify the trend strength and direction
Identify current momentum
INDICATOR IN ACTION
Daily chart
I hope you find this indicator useful , and please comment or contact me if you like the script or have any questions/suggestions for future improvements. Thanks!
I will continually work on this indicator, so please share your experience and feedback as it will enable me to make even better improvements. Thanks to everyone that has already contacted me regarding my scripts. Your feedback is valuable for future developments!
-----------------
Disclaimer
Copyright by Zeiierman.
The information contained in my scripts/indicators/ideas does not constitute financial advice or a solicitation to buy or sell any securities of any type. I will not accept liability for any loss or damage, including without limitation any loss of profit, which may arise directly or indirectly from the use of or reliance on such information.
All investments involve risk, and the past performance of a security, industry, sector, market, financial product, trading strategy, or individual’s trading does not guarantee future results or returns. Investors are fully responsible for any investment decisions they make. Such decisions should be based solely on an evaluation of their financial circumstances, investment objectives, risk tolerance, and liquidity needs.
My scripts/indicators/strategies/ideas are only for educational purposes!
ACCESS THE INDICATOR
• Contact me on TradingView or use the links below

Trend Oscillator (Expo)Trend Oscillator (Expo) measures the overall trend strength and how strong the current price move/momentum is. The indicator is leading since it can signal a possible trend change that is yet to start. The color of the histogram and its value helps to gauge the strength and momentum of the trend.
The user can enable Bar Color that coloring the candlesticks based on the trend strength.
The user can choose between different trend calculations, such as smoothed trend, volume-weighted trend, a non-lagging trend, to mentions a few.
DIVERGENCES
All types of oscillators produce divergences and so does Trend Oscillator (Expo). Divergences occur when the oscillator deviates from the trending price action. Bullish divergence is then when the trending price makes a lower low but the oscillator makes a higher low. Bearish divergence is then when the trending price makes a higher high but the oscillator makes a lower high.
HOW TO USE
Identify the trend strength and direction
Identify current momentum
Identify potential trend reversals
Identify Overbought and Oversold areas
INDICATOR IN ACTION
1 min chart
I hope you find this indicator useful , and please comment or contact me if you like the script or have any questions/suggestions for future improvements. Thanks!
I will continually work on this indicator, so please share your experience and feedback as it will enable me to make even better improvements. Thanks to everyone that has already contacted me regarding my scripts. Your feedback is valuable for future developments!
-----------------
Disclaimer
Copyright by Zeiierman.
The information contained in my scripts/indicators/ideas does not constitute financial advice or a solicitation to buy or sell any securities of any type. I will not accept liability for any loss or damage, including without limitation any loss of profit, which may arise directly or indirectly from the use of or reliance on such information.
All investments involve risk, and the past performance of a security, industry, sector, market, financial product, trading strategy, or individual’s trading does not guarantee future results or returns. Investors are fully responsible for any investment decisions they make. Such decisions should be based solely on an evaluation of their financial circumstances, investment objectives, risk tolerance, and liquidity needs.
My scripts/indicators/strategies/ideas are only for educational purposes!
ACCESS THE INDICATOR
• Contact me on TradingView or use the links below

Reversal Algo (Zeiierman)█ Overview
Reversal Algo (Zeiierman) is an adaptive reversal and momentum detection system that helps identify hidden turning points, pressure zones, and changes in market direction. It brings together advanced modeling techniques such as dynamic volatility bands, adaptive trend tracking, and momentum-based confirmation signals into one clear, visual framework.
Unlike traditional reversal indicators that depend on static oscillators or fixed levels, this tool adapts in real time to market movement. It tracks volatility and directional flow to reveal when momentum is building, slowing down, or preparing to reverse.
Whether applied to short-term scalping, swing positioning, or macro structural validation, this tool provides an adaptive analytical environment that translates complex price dynamics into actionable context.
⚪ Why This One Is Unique
This version of Reversal Algo employs multi-domain adaptive modeling, combining envelope projection, trend inertia estimation, and contrarian equilibrium tracking within a single structure.
Its framework merges nonlinear smoothing manifolds with volatility-compensated directional phase mapping, allowing it to evolve with shifting market states rather than react to them.
Optional AI-driven optimizations enhance precision in unstable regimes by dynamically reshaping envelopes and tracking lines around localized flow curvature.
█ Main Features
⚪ Reversal Cloud
The Reversal Cloud highlights areas of potential expansion, compression, and turning points in price. It adapts to volatility by expanding when markets become unstable and tightening during periods of calm, creating a visual map of market rhythm and elasticity.
When the Cloud widens, it often signals exhaustion or increased turbulence; when it narrows, it suggests balance or an upcoming breakout.
With AI mode enabled, the Cloud automatically fine-tunes its shape to align with live price behavior, keeping its structure responsive and accurate.
⚪ Reversal Signals
Reversal Signals are designed to identify potential market turning points with precision. They combine multiple layers of price behavior—momentum shifts, directional changes, and balance-point deviations—to highlight areas where reversals are statistically more likely. To reduce false clusters, the system intelligently filters out repeated signals within a short time window.
⚪ Reversal/Exit Points
Reversal/Exit Points appear as small, color-coded dots above or below candles. They signal moments where price momentum slows or where the system detects a potential shift in directional strength. These markers are often found near short-term highs or lows, making them ideal for identifying profit-taking zones, re-entry setups, or early warnings of a possible reversal.
⚪ Trend Framework
The Trend Framework provides a clean visualization of the market’s prevailing direction. It smooths out short-term noise to reveal the core trend structure, showing when the market is expanding, contracting, or transitioning between phases.
This framework helps traders quickly see whether price action supports continuation or if the trend is weakening.
⚪ Trend Tracker Line
The Trend Tracker Line is a highly responsive trend detector that reacts quickly to shifts in momentum. It adapts dynamically to volatility, providing an accurate real-time view of directional acceleration and deceleration. This helps traders spot early changes in market tone and evaluate whether a move has the strength to continue.
When AI mode is enabled, the line automatically adjusts its sensitivity to remain stable and consistent across different market conditions.
⚪ Contrarian Bar Coloring
Contrarian Candle Coloring enhances chart readability by visually distinguishing strength from weakness. Green bars highlight areas of building upward momentum, while red bars point to potential pressure or exhaustion. The system continuously adapts its color transitions to reflect subtle momentum shifts, making it easier to recognize when the market is gaining or losing conviction.
An optional AI mode fine-tunes these transitions to match the current market rhythm, ensuring that candle coloration always reflects the underlying flow of strength and weakness.
█ How to Use
⚪ Reversal Trading
The primary purpose of the indicator is to identify reversal opportunities in the market. Reversal or contrarian trading means entering positions against the current directional move in anticipation of a fade or trend rotation. This approach often occurs in high-volatility environments, so it is important to widen your stops, reduce your initial position size, and, if appropriate, scale or average into positions carefully rather than committing all capital at once.
The Reversal Algo provides predefined Buy and Sell signals designed to highlight potential market peaks and troughs. While these signals are highly accurate, they are not meant to call every top or bottom perfectly. In a strong trending market, several reversal signals may appear consecutively before the market fully turns.
⚪ Reversal Signal + Candle Coloring
Combine Reversal Signals with Contrarian Candle Coloring for added confirmation. A practical approach is to wait for a Reversal Signal and then look for a color shift in the candles (for example, from contrarian-colored to standard candles). This color transition acts as confirmation that the active move may be losing strength and that a reversal could be underway.
⚪ Reversal Signals + Reversal Cloud
Consider taking reversal entries only when price interacts with the Reversal Cloud boundaries. The Cloud’s upper and lower layers act as dynamic resistance and support zones. When a Reversal Signal appears near or immediately after price rejection from one of these layers, it adds structural confirmation to the setup and strengthens the case for entry.
⚪ Reversal Signals + Key Levels
One of the most effective ways to trade Reversal Signals is by combining them with key price levels, such as the previous day’s high, low, or close. If price rejects one of these levels while a Reversal Signal prints simultaneously, the confluence of the two events serves as strong validation for a potential turning point.
⚪ Take Profit
The Reversal/Exit Points can function both as entry confirmations and as take-profit zones. If a Reversal Signal was missed but a new Reversal/Exit Point appears near a peak or trough, it can indicate a late-entry opportunity aligned with exhaustion behavior.
These dots are most powerful as profit-taking signals. Since they form near local highs and lows, they often mark regions of temporary imbalance where reversals are likely. When a Reversal/Exit Point forms in the opposite direction of your current position, consider taking partial profits or tightening stops to lock in gains while maintaining participation in the broader move.
█ How It Works
⚪ Reversal Cloud Engine
The Reversal Cloud defines the dynamic upper and lower boundaries of market elasticity by transforming recent price displacements into a smooth volatility field. Through multi-layered envelope modeling, it constructs a continuous topology of expansion and compression zones, revealing where directional energy accumulates or dissipates.
Calculation: Uses layered volatility envelopes that adapt to changing market speed and expansion. A built-in alignment mechanism keeps the upper and lower bands synchronized, while optional AI optimization adjusts the symmetry of the cloud based on short-term directional bias.
⚪ Trend Tracker System
The Trend Tracker isolates directional persistence by modeling angular displacement of price flow over adaptive temporal curvature. It interprets slope evolution as a continuously evolving directional vector field, capturing both acceleration and deceleration within the active regime.
Calculation: Applies adaptive slope modeling to estimate the dominant direction of price flow. The system smooths fluctuations dynamically while maintaining responsiveness to significant shifts in trend velocity. When AI mode is active, an intelligent weighting adjustment refines the tracker’s equilibrium bias for better phase synchronization.
⚪ Trend
The Trend module projects a dual-polarity directional lattice, distinguishing constructive (positive) and distributive (negative) flow environments. It defines equilibrium corridors that expand and contract with evolving trend geometry, offering visual feedback on regime strength and transition probability.
Calculation: Uses weighted directional regression to estimate upper, middle, and lower trend layers. Each structure is color-coded based on price slope and relative position, creating a continuous and easy-to-read trend map.
⚪ Contrarian Bar Coloring Engine
Contrarian bar coloring converts raw bar data into a slope-weighted momentum matrix, visually encoding thrust versus decay phases in real time. It acts as a microstructural interpreter of price inertia, identifying acceleration clusters and momentum fatigue through color transitions.
Calculation: Combines slope analysis and volatility normalization to evaluate how strong or weak each price bar is relative to its trend. The results are reflected in real-time color changes that emphasize momentum strength and fatigue.
⚪ Reversal/Exit System
Reversal and Exit Points are derived from an evolving volatility-based trail that tracks directional exhaustion and reversion potential. These markers visualize transitions in directional energy—helping traders anticipate trend slowdowns or reversal probabilities.
Calculation: Constructs an adaptive volatility trail that contracts as directional momentum weakens. A state-aware detection model identifies inflection points where pressure changes polarity, producing the plotted up/down dots that mark possible reversals or exits. This ensures that each signal dynamically reflects real-time shifts in market energy rather than static thresholds.
⚪ Reversal Signals Core
The Reversal System’s entry framework is designed for precision. It combines several layers of short-term momentum analysis into clear, directionally aligned signals. By balancing different market speeds and measuring how far the price moves from its equilibrium, it identifies high-probability areas where trends may continue or reverse.
Calculation: Implements a composite synchronization framework that aligns short-term momentum phases with equilibrium drift and directional bias. Redundant triggers are filtered out through temporal separation logic, ensuring only the most distinct and reliable signals are displayed. Adaptive thresholds adjust automatically based on volatility and trading mode, maintaining signal consistency across scalp, intraday, and swing environments.
⚪ AI-Adaptive Optimization Layer
The AI layer refines selected modules — Reversal Cloud, Trend Tracker, and Contrarian Candles — by continuously recalibrating their internal weighting curves according to volatility structure and price curvature. It acts as an intelligent stabilizer that adjusts smoothing depth, boundary stiffness, and gradient bias dynamically.
Calculation: Utilizes a Context-Aware Kernel Adjustment Engine, estimating curvature variance and phase imbalance to auto-tune envelope response. The model performs iterative self-alignment to preserve directional fidelity under rapidly changing flow dynamics.
-----------------
Disclaimer
The content provided in my scripts, indicators, ideas, algorithms, and systems is for educational and informational purposes only. It does not constitute financial advice, investment recommendations, or a solicitation to buy or sell any financial instruments. I will not accept liability for any loss or damage, including without limitation any loss of profit, which may arise directly or indirectly from the use of or reliance on such information.
All investments involve risk, and the past performance of a security, industry, sector, market, financial product, trading strategy, backtest, or individual's trading does not guarantee future results or returns. Investors are fully responsible for any investment decisions they make. Such decisions should be based solely on an evaluation of their financial circumstances, investment objectives, risk tolerance, and liquidity needs.
Ücretli komut dosyası

Trend Algo (Zeiierman)█ Overview
Trend Algo (Zeiierman) converts raw price movement into a cohesive, volatility-aware trend map. Rather than static moving averages, it builds an adaptive trend core that responds to market state changes, then layers regime-sensitive clouds (Infinite Sky) and horizon-bounded channels (HorizonX), plus precise trend-change and continuation signals. The result is a clean framework for reading direction, timing pullbacks, and validating momentum.
The indicator visualizes the active trend line, adaptive clouds, and stateful signals to reveal transition zones, trend acceleration, and exhaustion. It suits intraday execution, swing confirmations, and structural regime assessment.
⚪ Why This One Is Unique
Unlike conventional trend tools, this version combines volatility-normalized trend estimation, AI-style regime clustering, and horizon-bounded support/resistance channels. Its framework uses multi-phase smoothing, adaptive width scaling, and state detection that aligns entries and continuations with current market inertia—reducing whipsaw while preserving responsiveness.
█ Main features
⚪ Dynamic Clouds
The Dynamic Trend Line provides a stabilized, noise-aware trajectory of price, color-coded by directional bias. Two cloud systems overlay the core trend:
Infinite Sky (AI) — a regime-aware cloud that distinguishes fast vs. slow trend states.
HorizonX — adaptive channels that operate as dynamic support/resistance and define trend boundaries.
⚪ Candle Coloring
The candle coloring is designed to highlight trend momentum peaks, allowing you to instantly recognize when the trend is accelerating or slowing down. This visual feedback makes it easier to interpret the strength and speed of directional moves directly on the chart, seamlessly complementing the Dynamic Trend Line and Cloud systems.
⚪ Trend Change Signals & Trend Continuation Signals
The main signals are the Trend Change Signals , designed to trigger when the current trend structure begins to shift its state. These signals give you an instant sense of when a potential trend reversal or directional change might occur.
To complement them, we’ve added Trend Continuation Signals , which only activate within an established trend. These signals confirm the current direction and indicate that the trend is gaining strength and preparing for another move in the same direction.
⚪ Trend Line
Two types of trend lines are integrated: Stability and Dynamic.
The Stability Line follows the current price action in a smooth, drift-like manner — staying closer to price to act as a faster support and resistance zone.
The Dynamic Line adapts to volatility, ensuring that continuous movements within the trend are taken into account. This helps traders stay aligned with the trend and capture extended moves during periods of higher market activity.
█ How to Use
⚪ Trend Changes
Trend Change Signals appear when the current trend structure begins to shift, signaling a potential reversal or directional transition. These signals help traders anticipate moments when momentum weakens or changes direction, offering early insight into possible turning points in the market. Combine Trend Change Signals with Candle Coloring or Cloud behavior to confirm entries and strengthen trend reversal validation.
⚪ Trend Continuations
Trend Continuation Signals trigger within an established trend, confirming that the current direction remains strong. They often appear after pullbacks or pauses, suggesting that the market is ready for another move in the same direction. These signals work best when paired with the Dynamic Trend Line, allowing traders to stay confidently aligned with powerful ongoing trends.
⚪ Support and Resistance
The Stability Trend Line acts as a reactive support and resistance guide, staying close to price and highlighting areas where market reactions are most likely to occur. It offers traders a clear view of short-term structure and helps identify potential bounce or rejection zones with precision.
The Dynamic Trend Line adapts to volatility, forming flexible support and resistance zones that expand during strong momentum and contract during quieter phases, keeping the visual structure balanced and responsive to changing market conditions.
HorizonX defines the outer adaptive boundaries of the trend. These dynamic channels operate as broader support and resistance frameworks, helping traders anticipate trend exhaustion or continuation zones beyond the immediate price action.
The Infinite Sky (AI) cloud adds a regime-aware layer that distinguishes fast and slow trend states, visually framing the strength of support or resistance regions as they evolve and allowing traders to read both momentum and structure in a single glance.
█ How It Works
⚪ Dynamic Trend Core
A volatility-normalized estimator generates the primary trajectory and color state, balancing stability vs. agility by adapting to dispersion and displacement.
Calculation: Multi-phase weighted smoothing with volatility-scaled adjustments and adaptive phase control to minimize lag while preserving curvature.
⚪ Infinite Sky (AI Regime Cloud)
Differentiates fast vs. slow trend states and paints a regime-aware cloud that guides timing and risk.
Calculation: Windowed return modeling (with optional consolidation), two-pole response filtering, and distribution-center clustering to classify regimes and modulate the envelope.
⚪ HorizonX Trend Channels
Defines dynamic support/resistance “horizons” that expand/contract with conditions and filter counter-trend noise when strong-trend mode is enabled.
Calculation: A volatility-aware core that evolves with changing price dynamics, maintaining precision across all market conditions.
⚪ Trend Line & Continuations
A fast reaction line confirms pullbacks and validates continuation only when aligned with prevailing bias and structure.
Calculation: Short-horizon smoothing with phase-managed weighting, slope/position gating, and context checks against regime and horizon levels.
⚪ Impulse Detection
Identifies statistically meaningful bursts that precede expansion or warn of exhaustion after extended runs.
Calculation: Nonlinear impulse-response mapping emphasizing second-order changes in directional energy while suppressing micro-noise.
⚪ Trend Bands
Upper/lower bands visualize the active envelope for timing adds, trims, or exits within trend.
Calculation: Percentile-guided banding blended with adaptive anchors to retain structural relevance through regime shifts.
⚪ Bar Color Integration
Bars can inherit trend/gradient context to make state shifts obvious at a glance.
Calculation: Algorithmic gradient model integrating directional momentum intensity to render bar coloration in sync with market flow.
-----------------
Disclaimer
The content provided in my scripts, indicators, ideas, algorithms, and systems is for educational and informational purposes only. It does not constitute financial advice, investment recommendations, or a solicitation to buy or sell any financial instruments. I will not accept liability for any loss or damage, including without limitation any loss of profit, which may arise directly or indirectly from the use of or reliance on such information.
All investments involve risk, and the past performance of a security, industry, sector, market, financial product, trading strategy, backtest, or individual's trading does not guarantee future results or returns. Investors are fully responsible for any investment decisions they make. Such decisions should be based solely on an evaluation of their financial circumstances, investment objectives, risk tolerance, and liquidity needs.
Ücretli komut dosyası

Reversal Bands & Zones (Expo) "It has never been easier to find high probability trades"
Reversal Bands & Zones (Expo) is an algorithm that analyzes the market in real-time and identifies reversal points, key market zones, and trends. The advanced and unique reversal bands act as support & resistance zones, and together with the trend tracking feature, it serves as a trend confirmation. The real-time market zones are displayed where there is a high probability of finding support/resistance. The algorithm does also map out key pivot levels based on the current market structure.
> Reversal points and key market zones have alerts.
Real-time
No repainting
Works on any market and in any timeframe
The indicator can be used standalone or as a part of your current trading strategy.
☖ Reversals
The algorithm identifies areas of potential turning points, these are displayed as Upper and Lower Reversal Cloud. When the price hits the cloud and bounces off there is a high probability that the price will reverse. If the price stays in the reversal cloud, there is a high probability that a trend is forming.
☖ Trends
Positive Trend: If the price is in or close to the upper green reversal band and above the trend- tracking line, we can be sure that the market is in a positive trend until the price crosses down from the reversal cloud and the trend tracking line.
NegativeTrend: If the price is in or close to the lower red reversal band and below the trend- tracking line, we can be sure that the market is in a negative trend until the price crosses up from the reversal cloud and the trend tracking line.
☖ Zones
"It hasn't been easier to display, in real-time, one of the most important and useful technical analysis, namely key support and resistance zones"
The algorithm analyzes the market structure in real-time and maps out key supply/resistance and demand/support zones. The user gets an instant understanding of the market structure. Support and resistance can be used to determine the range of a market, to trade reversals, bounces, or breakouts.
☖ Pivots
The indicator does also displays key pivot levels. Pivots can be used to determine the range of a market, to trade reversals, bounces, or breakouts.
HOW TO USE
- Use the indicator to identify reversals.
- Use the indicator to identify the range of the market.
- Use the indicator to identify key support/resistance zones.
- Use the indicator to identify trends.
INDICATOR IN ACTION
1-hour chart
I hope you find this indicator useful , and please comment or contact me if you like the script or have any questions/suggestions for future improvements. Thanks!
I will continually work on this indicator, so please share your experience and feedback as it will enable me to make even better improvements. Thanks to everyone that has already contacted me regarding my scripts. Your feedback is valuable for future developments!
-----------------
Disclaimer
Copyright by Zeiierman.
The information contained in my scripts/indicators/ideas does not constitute financial advice or a solicitation to buy or sell any securities of any type. I will not accept liability for any loss or damage, including without limitation any loss of profit, which may arise directly or indirectly from the use of or reliance on such information.
All investments involve risk, and the past performance of a security, industry, sector, market, financial product, trading strategy, or individual’s trading does not guarantee future results or returns. Investors are fully responsible for any investment decisions they make. Such decisions should be based solely on an evaluation of their financial circumstances, investment objectives, risk tolerance, and liquidity needs.
My scripts/indicators/ideas are only for educational purposes!
ACCESS THE INDICATOR
• Contact me on TradingView or use the links below
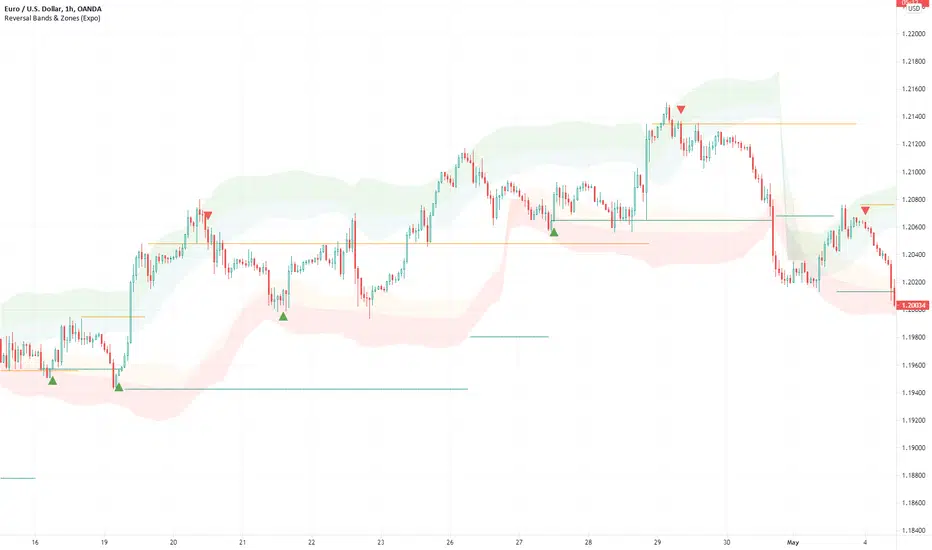
RSI with Self-Adjusting Linear Regression Bands (Expo)RSI with Self-Adjusting Linear Regression Bands (Expo) makes use of RSI and Linear Regression to create an RSI that follows the current trend. The indicator has an upper and lower self-adjusting Linear Regression Band that act as RSI boundaries.
HOW TO USE
The indicator can be used in multiple ways, for instance, to find overbought and oversold areas. Or to identify trends as well as pullbacks in trends.
INDICATOR IN ACTION
This indicator is a modification of RafaelZioni's work "Linear Regression Trend bands"
Credit to: RafaelZioni
I hope you find this indicator useful , and please comment or contact me if you like the script or have any questions/suggestions for future improvements. Thanks!
I will continually work on this indicator, so please share your experience and feedback as it will enable me to make even better improvements. Thanks to everyone that has already contacted me regarding my scripts. Your feedback is valuable for future developments!
-----------------
Disclaimer
Copyright by Zeiierman.
The information contained in my scripts/indicators/ideas does not constitute financial advice or a solicitation to buy or sell any securities of any type. I will not accept liability for any loss or damage, including without limitation any loss of profit, which may arise directly or indirectly from the use of or reliance on such information.
All investments involve risk, and the past performance of a security, industry, sector, market, financial product, trading strategy, or individual’s trading does not guarantee future results or returns. Investors are fully responsible for any investment decisions they make. Such decisions should be based solely on an evaluation of their financial circumstances, investment objectives, risk tolerance, and liquidity needs.
My scripts/indicators/ideas are only for educational purposes!

ATR + PSAR Trailing Stop (Expo)This ATR + PSAR Trailing Stop indicator is unique. It comes with new ways of calculating ATR and PSAR to enhance performance and accuracy as well as give clarity in trends. The indicator can be used standalone or as a part of your current trading strategy.
ATR + PSAR Trailing Stop (Expo) is a trailing stop indicator that combines ATR and PSAR to enhance the calculation of the trailing stop. This indicator works well in all types of markets, for example, in a trading range or in a trending market, etc.
The user can choose between the following ATR Settings:
Quick ATR
Adaptive ATR
Follow the price closely - ATR
Standard ATR
Trend ATR
The user can enable Trend ATR which displays the overall market structure. If the Trend ATR line is above the price we have a negative market structure, and if the Trend ATR line is below the price we have a positive market structure.
Real-time
No repainting
Works on any market and in any timeframe
HOW TO USE
- Use the ATR + PSAR Trailing Stop as a stop-loss.
- Use the indicator for taking a position when price crosses the ATR trailing line or taking a position when price crosses the PSAR circles.
- Use the indicator to identify the current market structure and trend.
The indicator can be used standalone or as a part of your current trading strategy.
INDICATOR IN ACTION
1-hour chart
I hope you find this indicator useful , and please comment or contact me if you like the script or have any questions/suggestions for future improvements. Thanks!
I will continually work on this indicator, so please share your experience and feedback as it will enable me to make even better improvements. Thanks to everyone that has already contacted me regarding my scripts. Your feedback is valuable for future developments!
-----------------
Disclaimer
Copyright by Zeiierman.
The information contained in my scripts/indicators/ideas does not constitute financial advice or a solicitation to buy or sell any securities of any type. I will not accept liability for any loss or damage, including without limitation any loss of profit, which may arise directly or indirectly from the use of or reliance on such information.
All investments involve risk, and the past performance of a security, industry, sector, market, financial product, trading strategy, or individual’s trading does not guarantee future results or returns. Investors are fully responsible for any investment decisions they make. Such decisions should be based solely on an evaluation of their financial circumstances, investment objectives, risk tolerance, and liquidity needs.
My scripts/indicators/ideas are only for educational purposes!
ACCESS THE INDICATOR
• Contact me on TradingView or use the links below
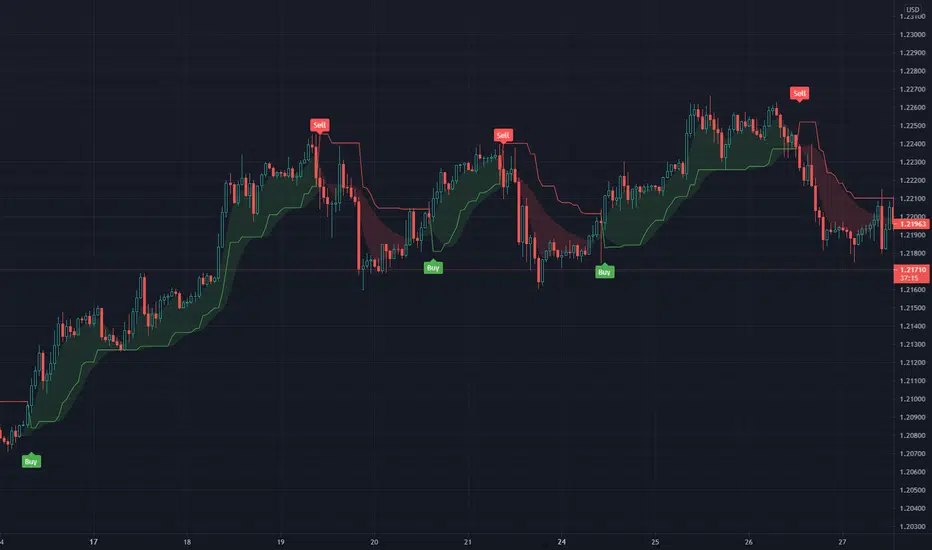
Rolling ATR Channel (Expo)Rolling ATR Channel (Expo) is a sophisticated indicator that identifies the underlying trend as well as identifies ATR based trading ranges. In a trending market, the price will be within the Upper or Lower band. If the market is in a trading range , the price will bounce between the upper and lower ATR zones, until the price breaks through and creates a new trend. The user will no longer have to guess in which state the market is in, the indicator displays it clearly.
So, the indicator displays real-time Range (ATR based) support and resistance zones as well as if the market is in a trend.
If you know the current market state, you have the ability to choose the most applicable market strategy.
Real-time
No repainting
Works on any market and in any timeframe
HOW TO USE
- Use the indicator to identify trading range support and resistance zones.
- Use the indicator to identify when the price breaks through the trading range.
- Use the indicator to identify if the market is in a trend.
INDICATOR IN ACTION
4 Hour chart
I hope you find this indicator useful , and please comment or contact me if you like the script or have any questions/suggestions for future improvements. Thanks!
I will continually work on this indicator, so please share your experience and feedback as it will enable me to make even better improvements. Thanks to everyone that has already contacted me regarding my scripts. Your feedback is valuable for future developments!
-----------------
Disclaimer
Copyright by Zeiierman.
The information contained in my scripts/indicators/ideas does not constitute financial advice or a solicitation to buy or sell any securities of any type. I will not accept liability for any loss or damage, including without limitation any loss of profit, which may arise directly or indirectly from the use of or reliance on such information.
All investments involve risk, and the past performance of a security, industry, sector, market, financial product, trading strategy, or individual’s trading does not guarantee future results or returns. Investors are fully responsible for any investment decisions they make. Such decisions should be based solely on an evaluation of their financial circumstances, investment objectives, risk tolerance, and liquidity needs.
My scripts/indicators/ideas are only for educational purposes!
-----------------
ACCESS THE INDICATOR
• Contact me on TradingView or use the links below

Tweezer Top & Tweezer Bottom Pattern (Expo)Tweezer Top/Bottom Pattern (Expo) indicator identifies real-time Tweezer Top and Tweezer Bottom in any market and in any timeframe. This is an enhanced version of the pattern which enables higher accuracy, and noise filtering. In addition to that, Tweezer Levels can be displayed which can be used in many different ways, for instance, as a stop loss level, or to confirm the signal.
The ideal Tweezer pattern includes that the wicks should be 100% the same length. However, that rarely happens. So in this enhanced version, the user can set the maximum change that is allowed between the wicks.
To enhance the signal accuracy a Bullish engulfing and Bearish engulfing filter can be toggled on. So a signal will only be displayed if an engulfing candle is in play.
HOW TO USE
Tweezer Top/Bottom should be used together with KEY market levels or with KEY supply/demand zones.
Enter Long: if a Tweezer Bottom signal occurs at a KEY Level or on a KEY supply/demand zone.
Target: The first target should be the nearest resistance level or supply zone. The second target should be the next resistance level or supply zone, and so on.
Enter Short: if a Tweezer Top signal occurs at a KEY Level or on a KEY supply/demand zone.
Target: The first target should be the nearest support level or demand zone. The second target should be the next support level or demand zone, and so on.
Stop Loss: The Tweezer levels can be used as a stop loss.
Remember: Use the indicator together with KEY levels or KEY Supply/Demand Zones.
INDICATOR IN ACTION
4 Hour chart
I hope you find this indicator useful , and please comment or contact me if you like the script or have any questions/suggestions for future improvements. Thanks!
I will continually work on this indicator, so please share your experience and feedback as it will enable me to make even better improvements. Thanks to everyone that has already contacted me regarding my scripts. Your feedback is valuable for future developments!
-----------------
Disclaimer
Copyright by Zeiierman.
The information contained in my scripts/indicators/ideas does not constitute financial advice or a solicitation to buy or sell any securities of any type. I will not accept liability for any loss or damage, including without limitation any loss of profit, which may arise directly or indirectly from the use of or reliance on such information.
All investments involve risk, and the past performance of a security, industry, sector, market, financial product, trading strategy, or individual’s trading does not guarantee future results or returns. Investors are fully responsible for any investment decisions they make. Such decisions should be based solely on an evaluation of their financial circumstances, investment objectives, risk tolerance, and liquidity needs.
My scripts/indicators/ideas are only for educational purposes!
-----------------
ACCESS THE INDICATOR
• Contact me on TradingView or use the links below
