Vortex Trend TrackerThough it may sound complex, the Vortex Indicator is essentially an uptrend line and a downtrend line. The vortex indicator can be used for a variety of purposes, including tracking the strength of trends, identifying/anticipating reversals, and generating entry/exit signals. It’s calculation is shown in the open-source code below.
To reduce the number of whipsaws produced by the indicator, we used an Exponential Moving Average of vmPlus and vmNegative values with a default length of 10. Decreasing this length will result in a more responsive vortex at the cost of more whipsaws and false signals.
The chart shows the absolute value of the difference between the uptrend and downtrend line displayed as the main histogram.
If the uptrend line is greater than the downtrend (thus indicating positive movement), then the histogram bars will be either light green or dark green. If the uptrend line has just now crossed the downtrend line, then the bar will be dark green. Bars will also be dark green when the uptrend line is greater than the downtrend line and the uptrend line is increasing. This means the trend is increasing in strength still. If the uptrend line is greater than the downtrend line, but is decreasing, then the bars will be light green. This means that the upwards trend is losing strength.
If the downtrend line is greater than the uptrend line, then there is a negative trend occurring and the bars will be either red or light red. If the downtrend line has just crossed over the uptrend line or is increasing in value, then the bar will be red. If the downtrend line is greater than the uptrend line, but is decreasing in value, then the bars will be light red (meaning the downtrend is weakening).
One way to trade using this vortex is to enter a long position when the bar color changes from red to light red. This would mean that the downtrend is decreasing in strength and an upwards reversal is likely to occur soon. Then, traders can exit their long position when the bars change from dark green to light green. When that color change occurs it means that the uptrend is running out of steam and price is unlikely to continue its upwards climb.
Traders can also choose to have the uptrend and downtrend lines plotted as well in the input menu. This may make it easier to visualize the Vortex and its usefulness in identifying reversals.
XBTUSD

Trend Scores + Volume-Weighted Trend ScoresHere is a simple indicator based on Tushar Chande's TrendScore .
The main purpose of the TrendScore is to determine the strength and direction of a trend, which it does by comparing the current price to the prices within a user-defined window of historical prices.
In the input menu, the user defines the starting and ending period. The current price is then compared to each historical price. If the current price is greater than the given historical price, then the TrendScore is incremented, while it is decremented if it is below the given historical price. TrendScore values fluctuate between a maximum of 100 and a minimum of -100, with 100 meaning that the current price is greater than each historical price in the window and a value of -100 meaning the inverse is true.
We then use the same process to calculate the volume trend score by passing in volume to the 'getTrendScore' function. Lastly, the indicator also also calculates a 'volume-weighted trend score'. This is simply the average of the price trend score and the volume trend score. It is not plotted by default, but users can set the input option to true in the input menu and it will be plotted as a yellow line (as seen in the bottom chart).
The Chart:
The trend scores for price are plotted as a histogram. We've summarized the meaning behind its color changes below:
-If ( trendScore == 100)
then color = dark green
-if ( trendScore < 100 and trendScore is increasing)
then color = light green
-if ( trendScore > 0 and trendScore is DECREASING)
then color = pink
-if ( trendScore < 0)
then color = red
The volume trend score is plotted as a blue line. We felt that using a similar coloring system for the volume trend scores would over-crowd the chart and take away from the simplicity that makes this indicator useful. The volume-weighted trend score is plotted as a yellow line.
The main price bars change color based on the price trend score to make the values easier to visualize as well.
Interpretation:
This is a pretty versatile indicator. We summarized the ways in which traders can use it:
-Enter Long Positions when the trend score crosses zero from negative to positive territory.
-Exit Long Positions when the trend score was previously 100 and begins decreasing (ie bar color changes from dark green to pink).
-Spot bearish divergences when price trend score is 100 or relatively high and the volume trend score decreases significantly.
-Identify bullish divergences when price trend score is relatively low and volume trend score is increasing.
~Happy Trading~

CME & XBT - BTC Futures Settlement DatesHi everyone
This in an indicator inspired by Scarrff
I added the XBT quarterly and yearly settlement dates
Enjoy
David

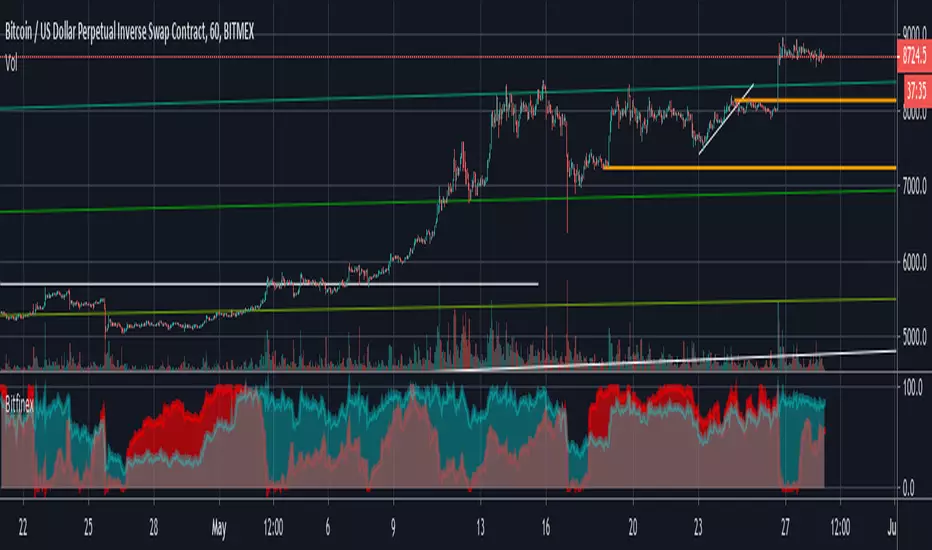
stress Birfinex and BitmexThis script identifies stress points in the major exchanges, recommended use in 1h.
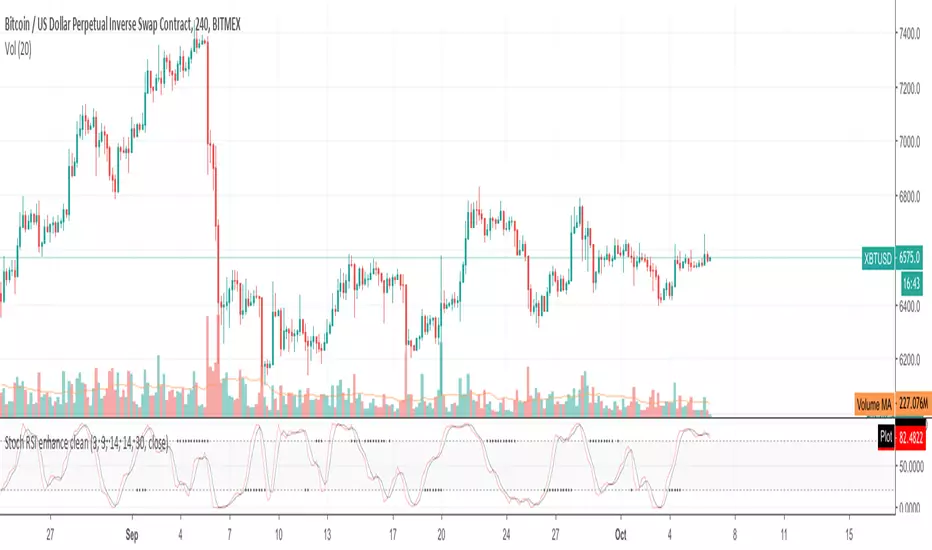
Turtles Modified AlertsAlerts for famous Turtle Trading Rules. Based on work from tmr0 and ossettia . It can be used with Autoview.
If you have any advice on how to further improve the script, please let me know by PM or comment below. Thanks!
Please hit on "Like" if you find this script useful so that others can find it easier. Thanks!
*** The information and script provided here are no recommendation to buy or sell. They are just an idea for educational and discussion purposes. ***


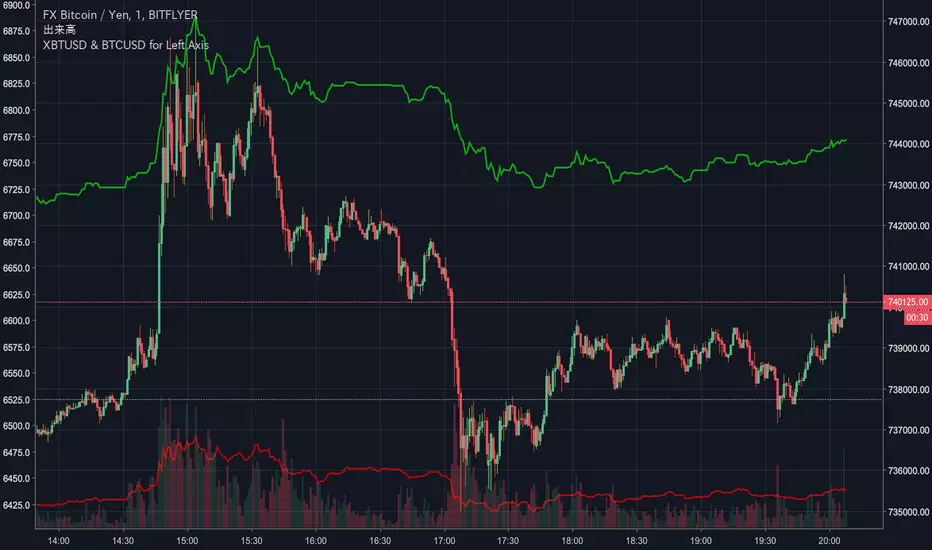
XBTUSD & BTCUSD for Left AxisThis script displays the price of XBTUSD and BTCUSD on the chart.
If you are displaying FXBTCJPY, I recommend you use on the left axis.
CM_Ultimate_MA_MTF_V2 with Alert Long and Short Hello All,
Here is a scirpt of ChrisMoody modified with the alerts of purchases and sales.
I just have a problem with automation. At the bottom of my script my alerts "Buy1" and "Sell2" give alerts constantly and I wish to have a single alert before the order is completed. Before "Sell1" or Buy2 ".
I found the function "barstate.isfirst" that could possibly work?
Does anyone have an idea ? :)

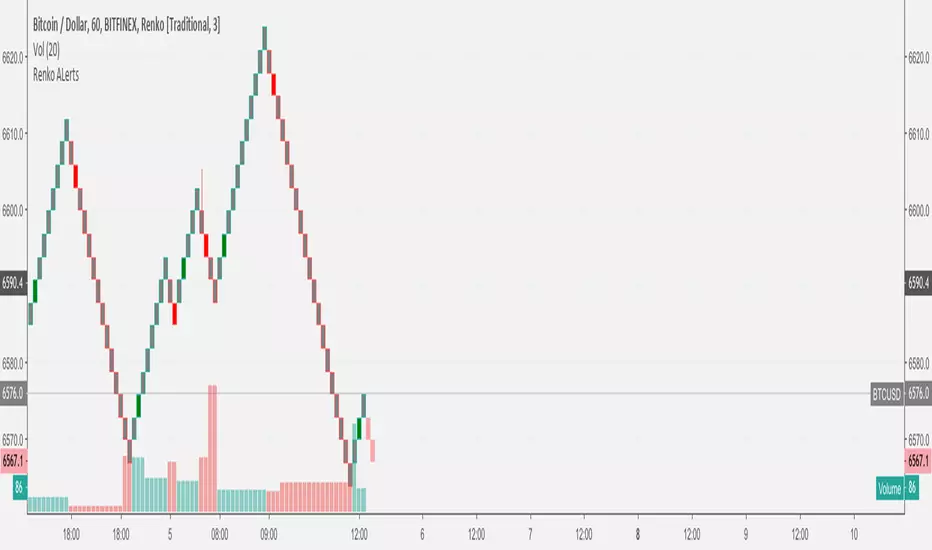
Bitmex Funding BarsFor XBTUSD bitmex perpetual contract. Times adjusted for 1hour chart. Shows the hour before funding in a subtle grey highlight.
-Xeno
