Daily-Weekly Range + KZsWeekly OHL + Daily OHL + Intraday Kill zones
For markets that open daily candle at 10pm UTC
Haftalık Grafikler
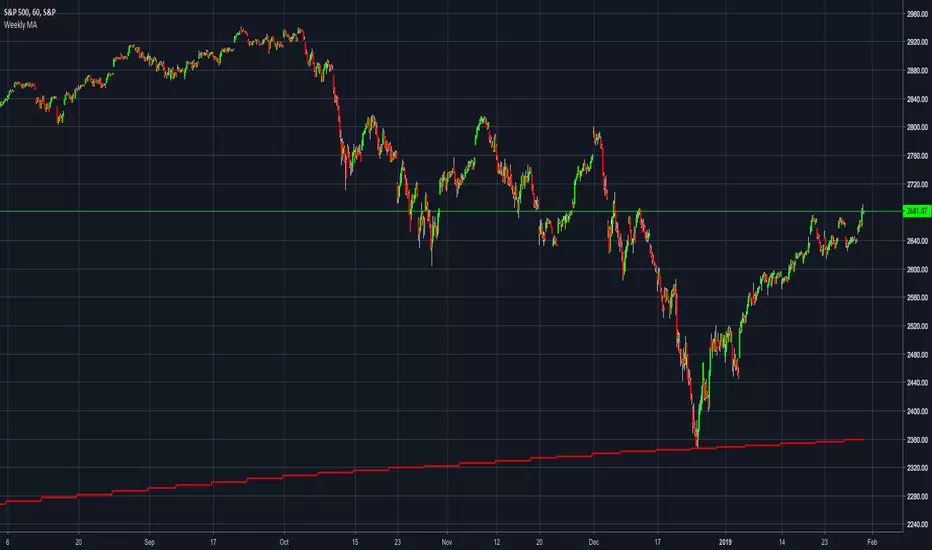
SPY Weekly Trading Strategy - ARK IndicatorDisclaimer: This is not financial advise, please consult with your licensed Financial Advisor for investment advise
Hello everyone,
This Script is designed to spot trends and provide you with an entry and exit points.
Rules of Trading with this Indicator:
1- The best risk/reward ratio of this indicator is that you buy at the very first buy Signal "B" and Sell at the very first Sell Signal "S"
2- and Repeat ....as simple as that
Few notes:
1- The repeats of the buy/sell signal are just confirmation of the the trend so to maximize the chances of being profitable, always start when the trend flips (From Sell to buy and vice versa).
2- No signal indicates that you maybe on an up/down trend depending on what the last signal was but the trend is starting to get weak
3- Once a trend is spotted by the algorithm, it will plot a line to establish, entry and exit depending on the direction of the trend (green for buying and red for selling)
4- you will notice that during up trend since the indicator recommends buying only entry points will be suggested with the help of a green line to give you an exact entry point, it is important that the price reaches that entry point for you to pull the trigger, however once the trend gets exhausted it will start to plot a red line so you are mentally prepared that a counter trend might be just around the corner (this is a pretty useful feature)
5- Recommended Settings: The most important setting that you need to be mindful of is "Signal Frequency", based on my observation so far, 2 works best with Weekly & monthly Charts, 8 with Daily Charts , and 10 with hourly charts or lower. As you know the price of a security depends on countless variables, including but not limited to general market condition, success/failure of the underlying security, and the psychology of the market participants of the security, so you can play around with the signal frequency to see what gives you the optimal/profitable signal in the historical candles.
6- the indicator comes with 3 moving averages since some traders/investors like to use moving averages, if you don't need them feel free to turn them off in the settings. they aren't part of any thing used behind the scene.
any questions feel free to contact me by commenting below.
Note: if you have any useful ideas on how to enhance the indicator, please don't be shy!
Warm regards & best of luck!
Ahmad

X0_Trading_levelsScript which marks out the trading ranges I often like to have mapped out on the charts:
Mondays Trading range - open, high, low
Daily open, high, low
Weekly open
Monthly open.
Can change all colours

Weekly VWAP - Starts Monday 12AMThere are a number of VWAP indicators out there, but it's difficult to find VWAP calculations that take the entire week into account. This helps with analyzing longer-term trends on daily and intraday charts. As with all VWAP indicators, this one is also more sensitive to price starting at the open of trading at the beginning of the week.

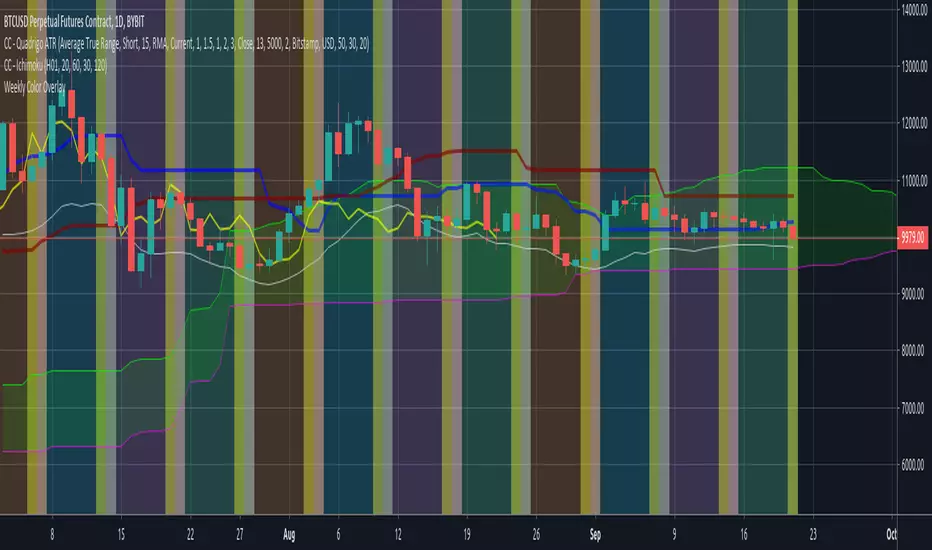
Weekly Color OverlayThis script facilitates visualization of week-of-the-month breaks with Sunday highlighting the beginning of a new week. Code breaks at the monthly time-period and since I don't ever look at that time period i'm not inclined to fix it unless someone sends me a 'push' via message.
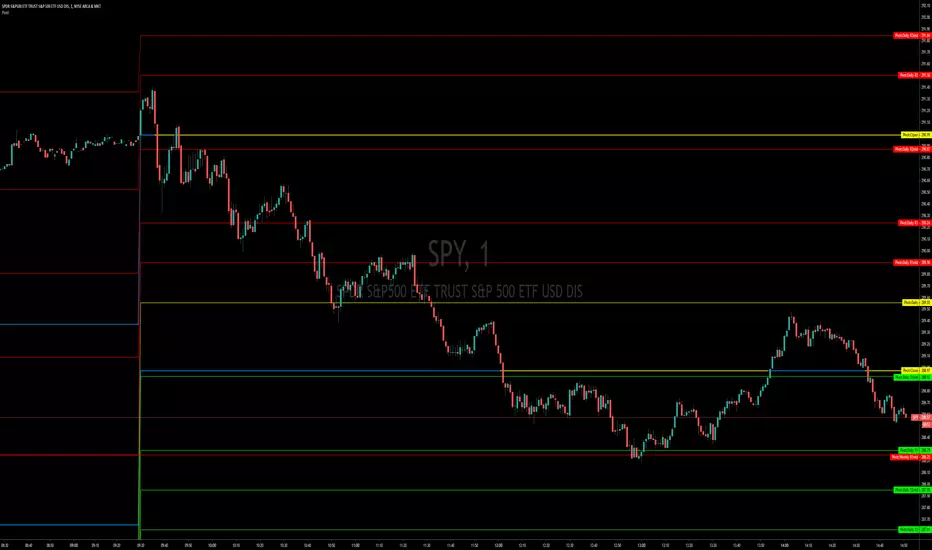
Pivot Points, Daily, Weekly, Open and Close lines What is a Pivot Point?
A pivot point is a technical analysis indicator, or calculations, used to determine the overall trend of the market over different time frames. The pivot point itself is simply the average of the high, low and closing prices from the previous trading day. On the subsequent day, trading above the pivot point is thought to indicate ongoing bullish sentiment, while trading below the pivot point indicates bearish sentiment.
The pivot point is the basis for the indicator, but it also includes other support and resistance levels that are projected based on the pivot point calculation. All these levels help traders see where the price could experience support or resistance. Similarly, if the price moves through these levels it lets the trader know the price is trending in that direction.
When the price of an asset is trading above the pivot point, it indicates the day is bullish or positive.
When the price of an asset is trading below the pivot point, it indicates the day is bearish or negative.
The indicator typically includes four additional levels: S1, S2, R1, and R2. These stand for support one and two, and resistance one and two.
Support and resistance one and two may cause reversals, but they may also be used to confirm the trend. For example, if the price is falling and moves below S1, it helps confirm the downtrend and indicate a possible continuation to S2.
This Script includes the Mid Pivot Points, Open and Close levels
weekend rally bloody mondayTracks the gain-loss of the price on Mondays and the range gain-loss from Monday (configurable) to Sunday. Then, it identifies Sunday's pumps that end with a Monday dump.

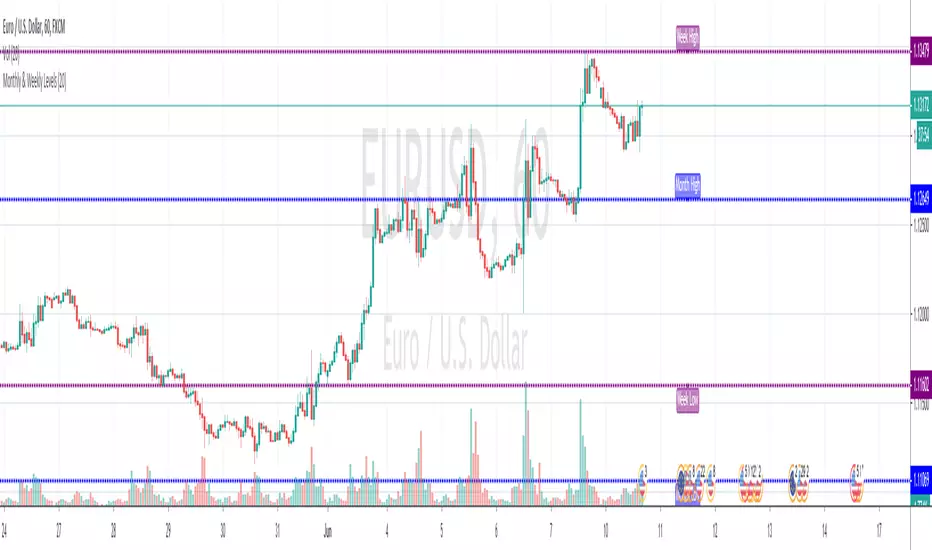
Monthly & Weekly LevelsShows and labels the previous monthly and weekly highs and lows, which are generally great areas to trade off. Loads quick and there's an option to hide the labels if they don't float your boat

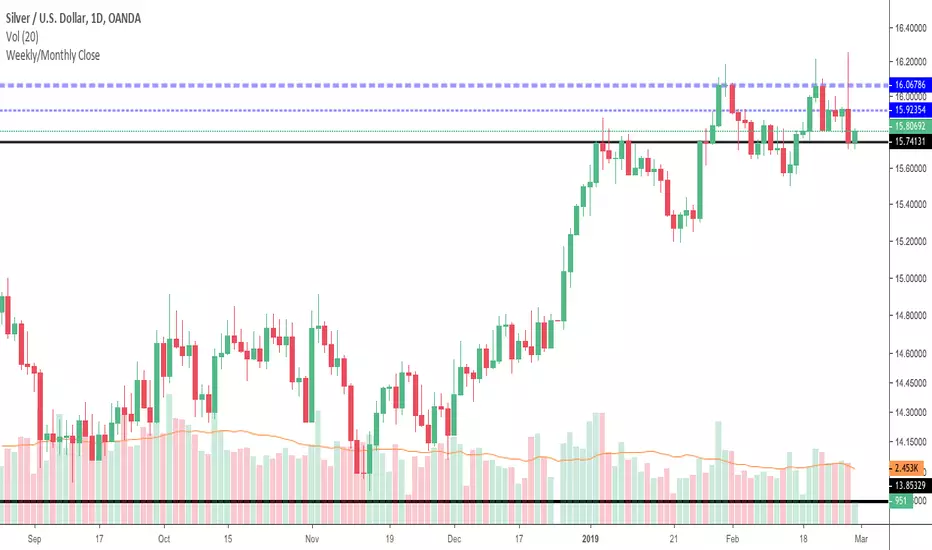
Weekly/Monthly CloseJust a simple support/resistance indicator that display weekly/monthly close price and it is configurable to work in two modes:
tracking mode - to display last week/month's close
history mode - to display weekly/monthly close prices
See how last month's close (ticker blue line) provides nice resistance and the price forms a double top then it consolidates under last week's close line (thiner blue line).
It also works on intraday charts and displays history close prices, see below how last month's close (ticker blue line) provides support over and over and also how price bounces off weekly close history prices (thiner blue line).
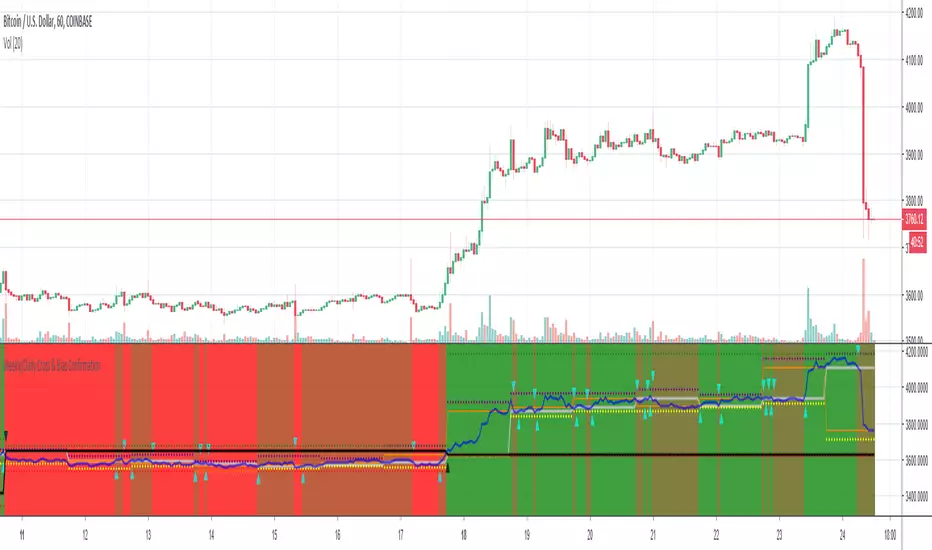
Weekly/Daily Cross & Bias ConfirmationThis indicator plots the weekly and daily open in addition to a current close price line.
It also signals when price closes above or below the daily and weekly opens.
Also, the bull/bear bias is painted on this indicator as well.
Black is the weekly open
Silver is the daily open
Weekly is default black arrows. Up is going above open, down is going below
Daily is default aqua arrows. Up is going above, down is going below
Weekly OHLC Plus 3 Weekly TF EMAsPlots weekly OHLC (with option to turn on monthly Open and Close) and 3 Weekly resolution EMAs (customizable).
This indicator is a combination of a few I've created/updated here on TV.
First part plots Weekly OHLC with an option to plot monthly open and close.
This indicator also plots on your chart 3 EMAs (customizable) from the Weekly timeframe (resolution).
The default settings (all EMAs)
200 - Orange
50 - Purple
20 - Black
There is no smoothing so the EMA line will appear jagged.

Weekly EMAs (Slow, Mid, Fast)This indicator plots on your chart 3 EMAs (customizable) from the Weekly timeframe (resolution).
The default settings (all EMAs)
200 - Orange
50 - Purple
20 - Black
There is no smoothing so the EMA line will appear jagged.
I start my week with understanding the bias on a weekly timeframe and weekly chart setups but I find it useful to have these weekly EMAs on different resolutions (especially the Daily).

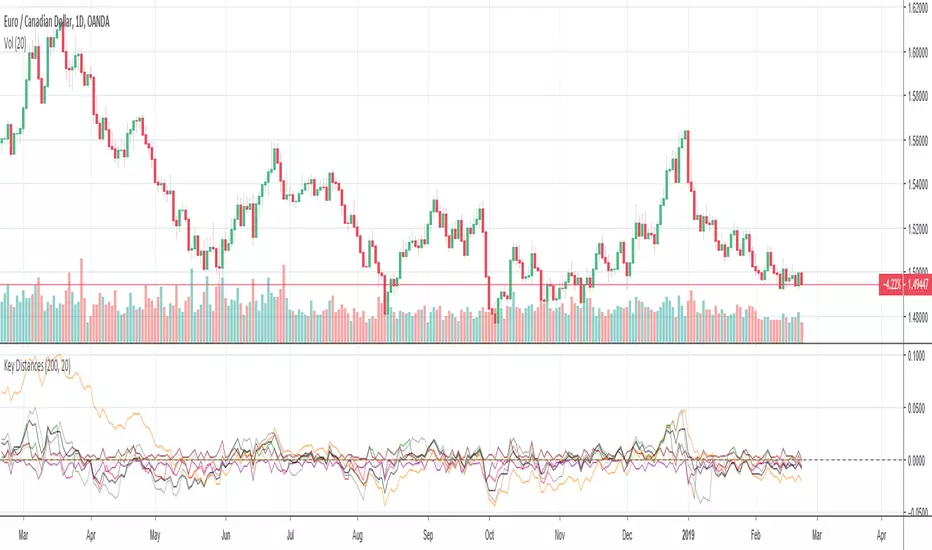
Key Distances (Weekly, Daily Open, & EMA)This indicator provides the pip value from various key levels I've found important in my trading system.
The results are graphed. I suggest that you choose the 2 most important ones you want to graph otherwise the indicator gets difficult to read.
The important data is the actual numbers but I've found it helpful to understand how a ticker moves in regards to weekly open and distance from 200EMA to be most helpful.
Here is the order of the data listed:
Distance from weekly open (green if above open, red if below open, also paints color on line)
Distance from last week opening price
Distance from daily open
Distance to 200EMA
Future Possible Updates:
- customized EMA
- Distance from weekly low/high
Custom Timeframe Indicators(MA,EMA,BB) [CryptoProSignal]This is a combination of 3 types of indicators :
1) Simple Moving Average
2) Exponential Moving Average
3) Bollinger Band
Idea is to plot any of the above indicator with a particular period length from a different timeframe to the timeframe on which you are currently working.
eg : As shown in the chart we have indicator plots from daily timeframe plotted/shown on the current 4hr time frame .
Similarly, you can have indicator plots from 4hr timeframe to be shown on any other timeframe and so on.
Basically you can select plots from any timeframe to work with on any other timeframe of your liking .
Not a rocket science, just play around with it and you will understand :)


Weekly FibonacciThis indicator displays the Fibonacci ratio using high and low prices of previous week
Bold dotted lines is high and low prices
The other dotted lines is the level values you can set.
You can use Fibonacci strategies with this indicator.
This indicator can be set to any of 19 values.
My youtube Chaneel

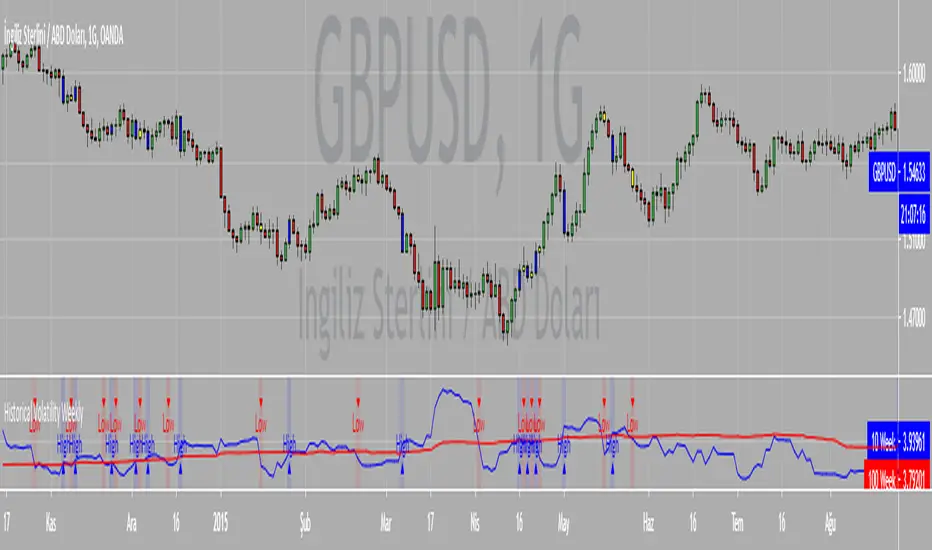
Silver Fundamental (Weekly)This script helps to determine the fundamentals of silver. The value of fundamental strength ranges between 0 to 1. This is developed by considering the COT data and then normalizing it in a particular way so that it helps in determining the trend of silver.
Note: Use this only in Weekly Chart because COT's are announced Weekly.
I hope this script helps people in the tradingview community. And please, do share your reviews after using it.
Godspeed :)

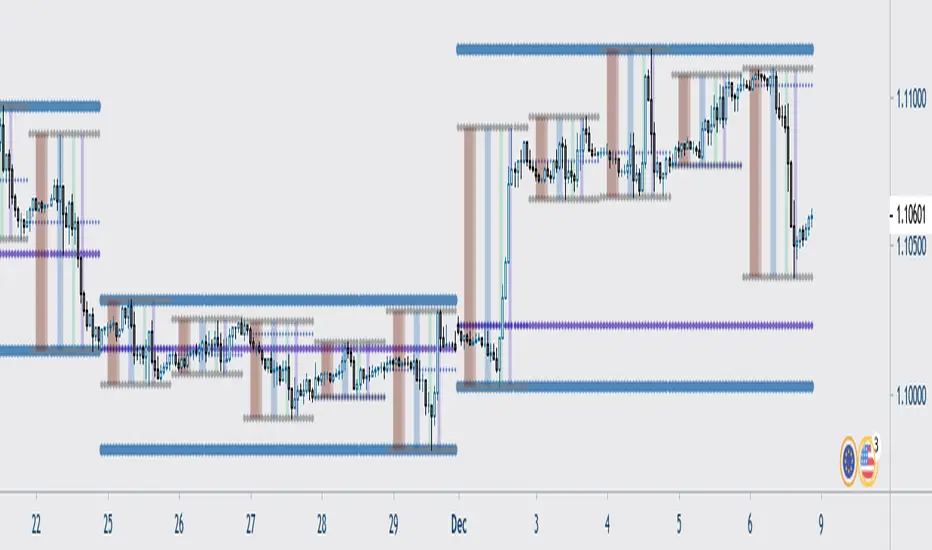
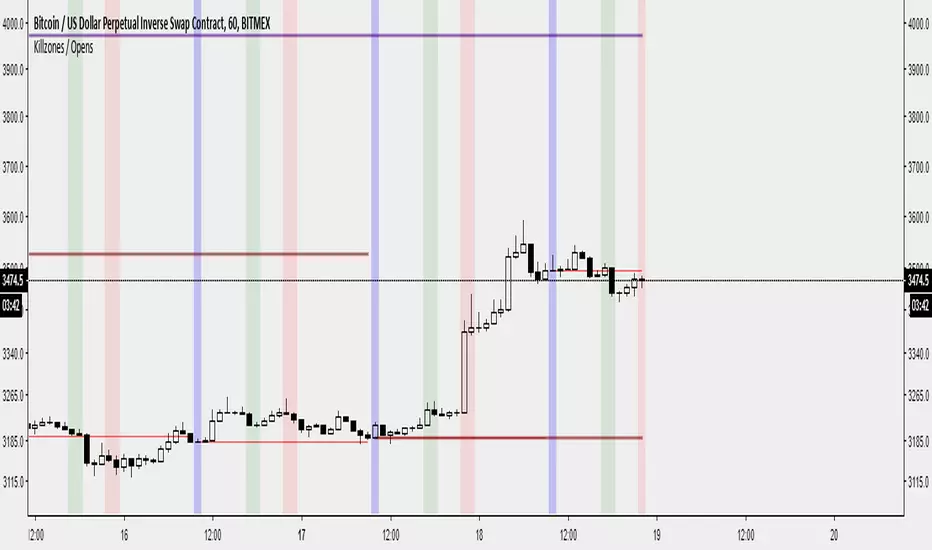
Killzones / Daily Open / Weekly Open / Monthly Open by @bartbtcI've created an indicator that :
- Displays the previous day's, week's, month's open on the current period's price action.
- Displays a vertical bar at the daily open. (The first 30-60 minutes from the daily open is commonly where the high/low of the day is made)
- Displays London/NY opens as vertical bars (london close is an option, but I have disabled it by default. I have removed Asia as I believe it is not useful - deal with it!)
Features:
- Displays daily data/killzones only on timeframes lower than 60minutes (you can modify this in the settings as you wish)
- Displays weekly open only on timeframes lower than weekly
- Displays monthly open only on timeframes lower than monthly
Let me know on Twitter on @bartbtc if there's any issues or if you have any other features you think might be useful.
MWD_XO_OPENSCreated by TraderX0 & Stingray
Helps you plot the Monthly, Weekly, and Daily Opens quickly on your chart; Open the options menu to adjust colors and toggle time-frames(M/W/D) on/off.

Weekly OHLC UpdatedWeekly OHLC first edit is to include a standard style.
From here we'll be adding a few moving averages and a few other things I find helpful in both in crypto and FOREX trading.
