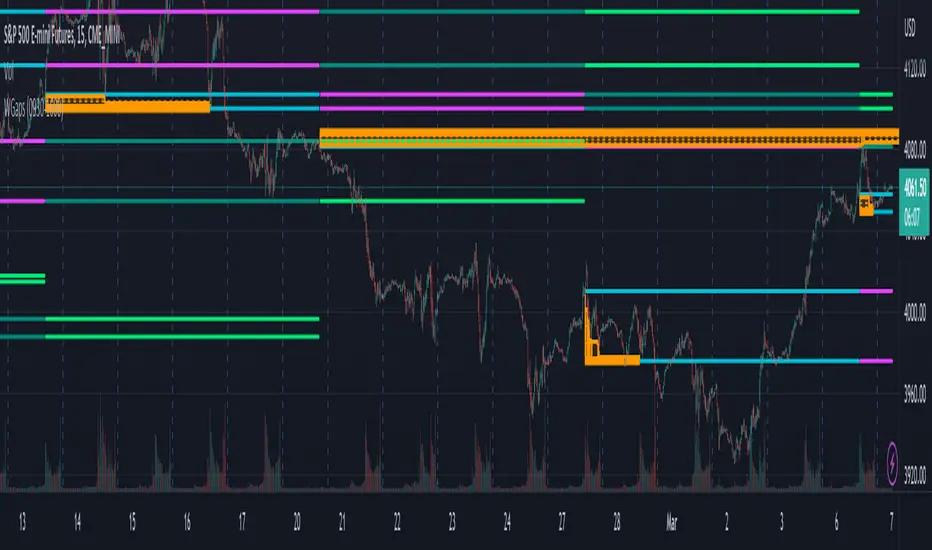
Weekly Opening GAPThis indicator will plot the weekly opening gap on the chart. The gap will be carried forward until it is closed or the max line count is reached. Additionally the 1/4 levels inside the gap are plotted on the chart as weekly gaps can be large.
The weekly opening gap levels can act as targets and rejection points.
Optionally the script can also carry forward the top and bottom lines of the weekly opening gap for up to the 10 prior gaps. These lines are not removed when the gap is closed.
Haftalık Grafikler
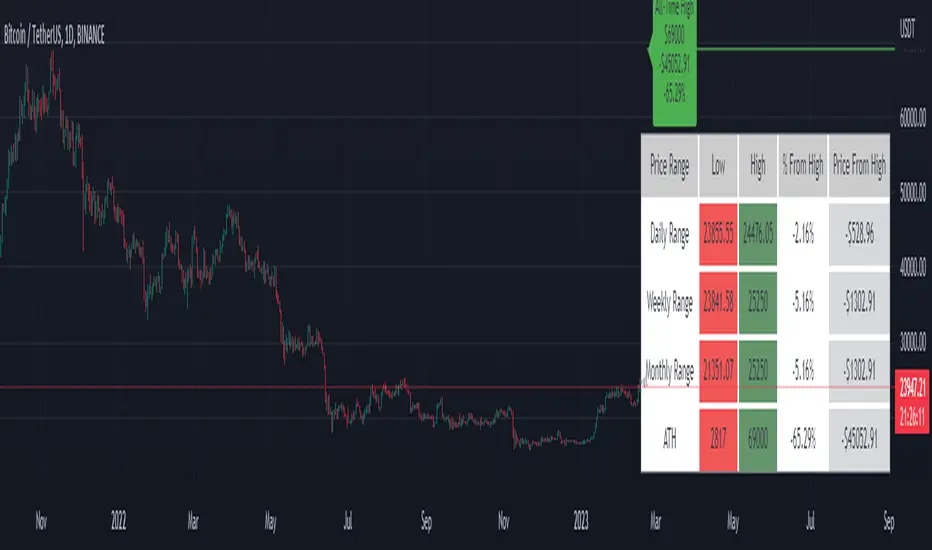
Price Range Tracker D/W/M + ATHIntroducing the Price Range Tracker - it's a tool for monitoring the price of any coin or stock. This indicator provides up-to-date information on the daily, weekly, monthly, and all-time high (ATH) prices of your selected asset.
With the Price Range Tracker, you can easily gauge how far your asset's current price is from its highest point in the daily, weekly, or monthly range. Additionally, it keeps track of the ATH of any coin, providing you with a clear understanding of your asset's historical performance.
This tracker also plots the ATH on the main chart as a label, ensuring that you are always aware of the highest point your asset has reached.
While this tool is a valuable asset for analyzing price trends, it is important to note that past performance may not always indicate future results. Market conditions can change rapidly, and strategies that have been successful in the past may not perform as well in the future. As such, it is essential to use the Price Range Tracker in conjunction with your own research and knowledge.
Please let me know if you find any bugs or would like things adding to the tracker
Finally, please note that this post and the accompanying script do not provide any financial advice. The information provided is for educational purposes only, and you should always consult a financial advisor before making any investment decisions.
WON WeekliesWilliam O'Neil was a big proponent of using weekly charts, often highlighting the significance of 3 or more tight weekly closes, or a sequence of five or more consecutive up weeks. This indicator recognizes both of these conditions providing clear visual cues to signify this institutional buying activity. When three tight weekly closes or more occur a circle will be drawn around the middle close or the background will change color, depending on user preference. If five or more consecutive up weeks are detected a box is drawn around all the price action of those weeks.
User Options:
- Choose to display both or only one condition
- Customizable colors
- Define what a tight close is (default is less than 1.5%)
- Change background color or display smaller circles for 3 weeks tight
- Alerts for both
Note: 5 weekly closes wont print until the 5th weeks candle is closed.

Key Levels by myooThis indicator plots key levels on the chart and can put a label on the price scale.
These levels can act as important support and resistance and cause big reactions.
• Open, High, Low, and EQ for the current day, previous day, current week, previous week, current month, previous month and current year.
•To show the levels on the price scale, you need to right click on the price scale, select "Labels" and turn on "Indicator and financial name labels" and "Indicator and financial value labels".
•In the settings under "Style", disable the "Labels" for a clean look.
In the settings window you can change the way the lines are drawn:
•Minimal: Lines are being drawn to the right for a clean chart.
•Standard: Lines are being drawn from the open bar of said period.
•Additionally, if you do not like to have the labels on the price scale, you can turn them of in the settings under the "Style Tab" by deactivating "Labels on price scale".
In this case, you can use the labels from the indicator itself, that are being drawn above the price line on the chart. Use the "Offset" setting to dial in the position to your preference.
Enjoy trading!

VWAP & Previous VWAP - MTF█ Volume Weighted Average Price & Previous Volume Weighted Average Price - Multi Timeframe
This script can display the daily, weekly, monthly, quarterly, yearly and rolling VWAP but also the previous ones.
█ Volume Weighted Average Price (VWAP)
The VWAP is a technical analysis tool used to measure the average price weighted by volume.
VWAP is typically used with intraday charts as a way to determine the general direction of intraday prices.
VWAP is similar to a moving average in that when price is above VWAP, prices are rising and when price is below VWAP, prices are falling.
VWAP is primarily used by technical analysts to identify market trends.
█ Rolling VWAP
The typical VWAP is designed to be used on intraday charts, as it resets at the beginning of the day.
Such VWAPs cannot be used on daily, weekly or monthly charts. Instead, this rolling VWAP uses a time period that automatically adjusts to the chart's timeframe.
You can thus use the rolling VWAP on any chart that includes volume information in its data feed.
Because the rolling VWAP uses a moving window, it does not exhibit the jumpiness of VWAP plots that reset.
For the version with standard deviation bands.
MTF VWAP & StDev Bands

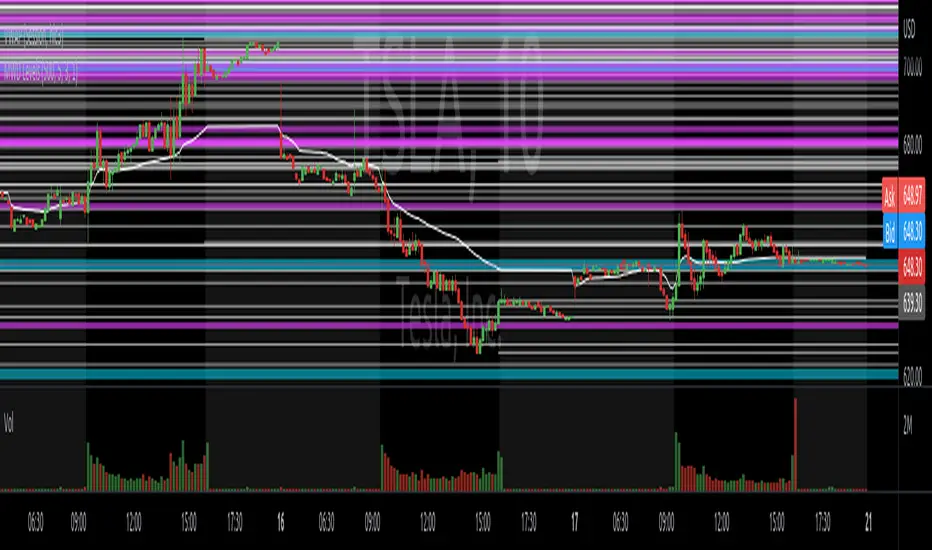
4C Expected Move (Weekly Options)This indicator plots the Expected Move (EM) calculated from weekly options pricing, for a quick visual reference.
The EM is the amount that a stock is predicted to increase or decrease from its current price, based on the current level of implied volatility.
This range can be viewed as support and resistance, or once price gets outside of the range, institutional hedging actions can accelerate the move in that direction.
The EM range is based on the Weekly close of the prior week.
It can be useful to know what the weekly EM range is for a stock to understand the probabilities of the overall distance, direction and volatility for the week.
To use this indicator you must have access to a broker with options data (not available on Tradingview).
Look at the stock's option chain and find the weekly expected move. You will have to do your own research to find where this information is displayed depending on your broker.
See screenshot example on the chart. This is the Thinkorswim platform's option chain, and the Implied Volatility % and the calculated EM is circled in red. Use the +- number in parentheses, NOT the % value.
Input that number into the indicator on a weekly basis, ideally on the weekend sometime after the cash market close on Friday, and before the Market open at the beginning of the trading week.
The indicator must be manually updated each week.
It will automatically start over at the beginning of the week.

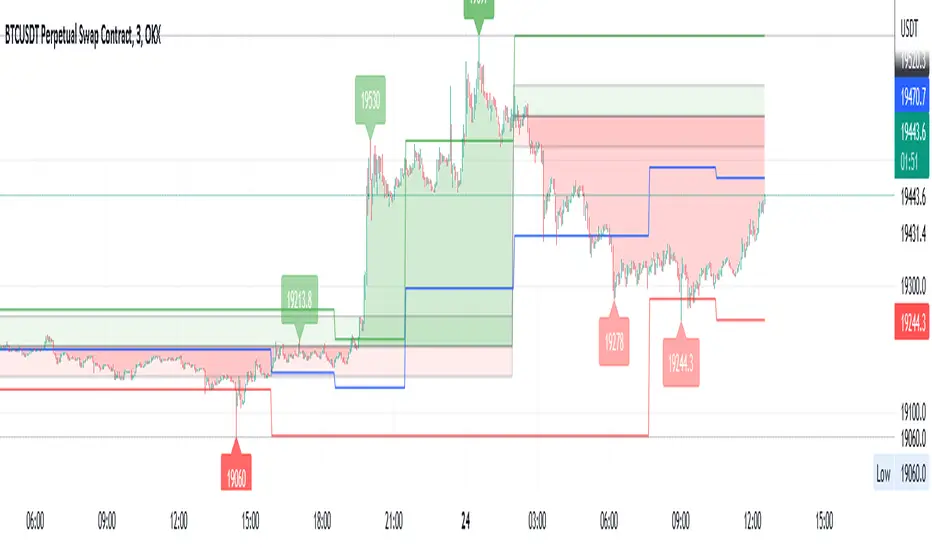
EVA - Daily Candle BoxThis is a very simple indicator who display few information about the LAST daily candle. ( it is possible to change the timeframe to have information about last week or last hour )
The green background zone is the channel between last daily candle close and last daily high.
The red background zone is the channel between last daily candle close and last daily low.
The middle line display the last daily candle close.
You can desactivate some display , and let just what you need.
If you have any idea to improve it , let me a message !
Yearly Monthly Vertical Lines [MsF]This indicator that draws vertical lines for each year and month starting from the specified date and time.
For example, starting from August 26th, 2022,
The annual vertical lines are Aug 26th, 2022, Aug 26th, 2021, Aug 26th, 2020, Aug 26th, 2019, Aug 26th, 2018, Aug 26th, 2017...
It is useful to check the action of the chart at the event of each year and month.
Caution:
Since there is a limit to the Bar-Count that can be specified in the script language, depending on the chart period setting It may not be displayed.
-------------------------
指定した日時を起点として、年、月ごとに垂直線(縦線)を描画するインジケータです。
例えば、2022/9/1を起点とした場合、
年次のラインは、2021/9/1、2020/9/1、2019/9/1、2018/9/1、2017/9/1、2016/9/1...
に描画します。
年、月ごとのイベント時のチャートの動きを確認するのに便利です。
※過去イベント時の価格変動確認の際、手作業で垂直線を引くのが面倒なため、作成しました。
<注意>
スクリプト言語で指定できるBarCntに制限がある為、チャートの期間設定によっては
表示されない場合があります。※今後改善の余地あり

All-In-One Sessions, Weekly, Monday, Previous Highs/LowsWe are forever drawing key levels on our charts with saved drawing templates, but finding the levels, adding the labels, is all tedious stuff. We have indicators, but we have multiple different ones at a time.
What if you could just tick a box on/off?
Well now you can.
This all in one 'levels' indicator is designed to show all the key highs and lows from previous weeks, Monday, the current week, as well as an option to highlight the market sessions and their highs and lows.
There are lots of options available for extending lines and choosing their colors, so once you have set it up how you want, don't forget to save YOUR defaults.
Oorah.

Mondays Range by B1rdPlots mondays range (high, low and optionally average)
Features:
Added the option to extend the range for the entire week or just monday
Added the option to display if the high or low of the range has been taken and removes the level aftwards
Added the option to only display the current week
Added the option to visualize new weekly sessions
Added the option to mark mondays with a seperate background
Will update the script based on suggestions

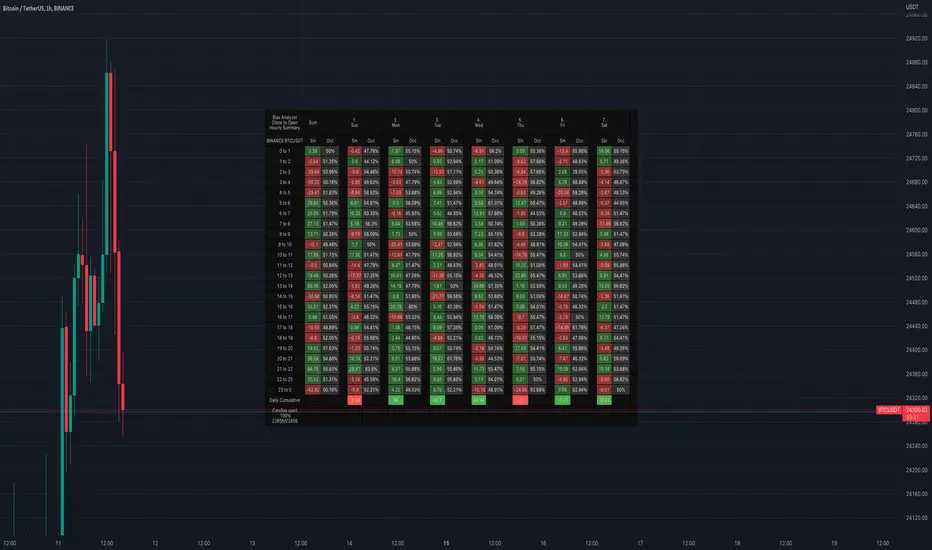
Bias AnalyzerName: Bias Analyzer
Category: Market Analyzer
Timeframe: 1H and 1D, depending on the Analysis type.
Technical Analysis: Usually when we think about a Trading System we start from an idea. This idea comes normally from observation and the study of the market.
Have we ever observed a market - for example Bitcoin - and thought that it increases at the start of a USA session? Great, this is a well-known category of Trading System and the purpose of the Bias Analyzer is to study these phenomena.
There are different types of Trading System that we can classify considering the market in-efficiency that we use to our advantage. In this case we make the Bias. Literally "inclination" or "presupposition" or precisely "tendency" of the price to go up or down in a temporal way.
The characteristics of the Bias depend on how much the Bias is persistent on the market since the analysed period. therefore we can consider:
Hourly Bias : analysing the hourly behaviours during the week. Trades normally last from a few hours to a few days.
Seasonal Bias : analysing the behaviour of the weeks in the monthly or annual context, evaluating the seasons.
Suggested usage: The possibilities of the tool are infinite, these are some scenarios of use:
Development of Intraday Trading Systems based on Hourly Bias with possible filters for specific days of the week.
Development of a Multi-day Trading System based on daily Bias with monthly analysis.
To identify the best day to execute our investment through Dollar Cost Average with a bit of healthy buy the dip
Main features:
Hourly Summary organized in Week
The cells contain the sum of the various price deltas for the single hour. The transparency indicates the frequency in which the candles close positive or negative. This information is available both in a synthetic way, as in the first column "Sum", and for each day of the week.
Hourly Details organized in different entry/exit
Shows the cumulative data of the various deltas, considering the purchase and the sale at certain times. In the rows are represented the buying hours and in the columns the selling hours.
Daily Summary organized in Months
The cells contain the summation of the various price deltas for the single day.
Hourly Details organized in different entry/exit
Allows to visualise the detailed analysis table, choosing to do it for all the months or for a specific month and shows the cumulative data of the various deltas, considering the purchase and the sale in certain days.
Configuration: You can configure the tool easily and completely.
Analysis
Calculate from Close to Open : this is the core of the whole analysis where the "Price Delta" to be calculated is defined. At this moment there is the possibility to calculate the distance between opening and closing.
Calculate in Percent or Cash : this allows to calculate the Price Delta in Percent or in Cash.
Analysis on 1H Timeframe
Show Hourly Summary on : allows to visualise the summary analysis table of the week. The cells contain the sum of the various price deltas for the single hour. The transparency indicates the frequency in which the candles close positive or negative. This information is available both in a synthetic way, as in the first column "Sum", and for each day of the week. At the bottom left there is also data which allows us to understand how many candles are being analysed. At the bottom of each day it is possible to visualise the cumulative data of the day. The position of the table is customizable.
Show Hourly Details of on : allows to visualise the detailed analysis table, choosing to do it for all days or for a specific day, and shows the cumulative data of the various deltas, considering the purchase and the sale at certain times. In the rows are represented the buying hours and in the columns the selling hours. For example, going to the table "All Days" we can see in the cell of row 13 and in column 22 the cumulative data of a possible buy on 13 and a sell at the end of 22. To facilitate the research of the values there is a configurable transparency system.
Analysis on 1D Timeframe
Show Daily Summary on : allows to visualise the summary analysis table of the month. The cells contain the summation of the various price deltas for the single day: The first row is the summation of all days of the month for all months in the analysis period, while the other rows represent the analysis for the various days of the individual months.
Show Daily Details of on : allows to visualise the detailed analysis table, choosing to do it for all the months or for a specific month and shows the cumulative data of the various deltas, considering the purchase and the sale in certain days. In the rows are represented the buying days and in the columns the selling days. For example, going to the table "All Months" we can see in the cell at row 1 and at column 3 the cumulative of a possible purchase on the 1st and the sale on the 3rd. To facilitate the research of the values, there is a configurable transparency system.
Table Layout
Size : allows to define the size of the text in the table.
Precision : it is possible to define the decimal precision of the calculations presented in the tables.
Transparency Factor : allows the application of a multiplication factor when the table calculates the transparency of detail tables.
Colours : allows to specify the colours of Profit, Loss and Neutral, besides to adapt a style coherent with the Dark Mode or Light Mode of Trading View
Volatility Filter
It is possible to directly apply a filter to the time series on which the delta is calculated. The volatility filter uses the ATR - an indicator that allows you to calculate the volatility in a given period. Briefly: the higher the ATR value, the higher the volatility. Therefore the filter works by comparing the volatility on two periods and indicates compression or expansion.
Backtest Dates
In order to facilitate the identification of in-sample and out-of-sample data, as well as the degradation of a given behaviour, it is possible to specify a period in which to do the analysis.
MTF VWAP & StDev BandsMulti Timeframe Volume Weighted Average Price with Standard Deviation Bands
I used the script "Koalafied VWAP D/W/M/Q/Y" by Koalafied_3 and made some changes, such as adding more standard deviation bands.
The script can display the daily, weekly, monthly, quarterly and yearly VWAP.
Standard deviation bands values can be changed (default values are 0.618, 1, 1.618, 2, 2.618, 3).
Also the previous standard deviation bands can be displayed.

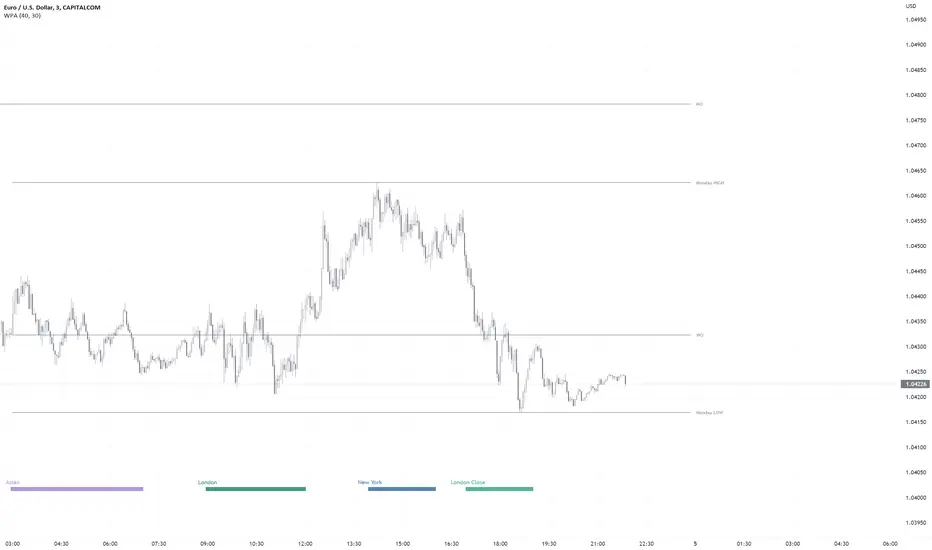
WPA OpeningsFeatures
- Displays the now and previous days, weeks, months, years (opens&highs&lows&eq)levels, Monday Range (high&low&eq), ATH Level.
PA Levels on every timeframe(It's like PYO in 1minutes chart)
Settings:
Hide and show separately.
Change color.
Line extension.
- Displays London/NY/Asian Killzones very simplified way ***w/Unique Concept.
Killzones only on timeframes lower than 30minutes (you can modify this in the settings as you wish).
It's not depended on your tradingview accounts time settings, so the killzones always stay at the right place in the chart.
The times of each killzone come from the education material of ICT.
Closed during weekends.
Settings:
Hide and show separately.
Change color separately.
- Only (All-In-One)Price Action indicator you need.
Know your Monthly, Weekly, Daily LevelsThis script will show monthly, weekly and daily (with or without pre market) levels on your intraday chart. You can chose what values of the corresponding candles (high, low, close) should be included.
Please consider following limitations:
1. Maximum of 500 drawing objects per chart
To make sure the most relevant levels are shown, values are sorted based on the latest close value before levels > 500 are cut off.
2. Lookback history
The max lookback history is limited by the currently selected timeframe. E.g. on a 5min timeframe, 20000 bars (Premium Plan) result in approx. 5 months of lookback period, meaning you may want to have a 30 min or higher chart open to get a complete picture of levels, while trading on a lower timeframe.
High/Low/Open/Close Daily, Weekly, Monthly Line
I wrote this for the purpose of saving time while marking up charts by automating the process of drawing and labeling lines at areas of interest on larger
timeframes while still having the option to change the style and size of the lines and labels to adjust for any timeframe and avoid a messy chart.
I also used this as an exercise in menu organization giving users every imaginable option and producing clean readable code.
- This indicator draws a line on the Daily, Weekly, and Monthly bar at the High, Low, Open and Close of each bar as price
tends to react when revisiting these areas.
- Each set of bars has an optional identifying label with its own color set that can be shown with or without the lines
price value, and has drop down menus for size and style of each set of labels.
- Each set of lines has inputs for line/text color, line width and style, and can be hidden if the user doesn't have the need for any particular timeframe.
- Lines and Labels with delete when a new line is created.
- I recommend going into Chart Settings/Status Line and turning off indicator arguments OR moving the script to the top
of the indicator list to avoid an obstructed chart view with this indicators arguments. When Pine allows, I will update it to hide them.
Contains some public domain code from T.V. manuals and tutorial for creating drop down input menus for options.
/ ~For My Pal Jittery~
~ Who likes his clean chart and custom colors~


Wurucututu's Daily/Weekly/Monthly HLOCThis script draws the High/Low range for a daily, weekly, or monthly periods. By default is set to weekly.
Also it draws the open and close for each period, painting it in red if open greater than close, and green otherwise.
You can forward shift ranges to see how current price action interacts with ranges from past periods. By default this is set to zero.
For instance, here is the interaction of current week with previous week range (i.e. a 1 week shift forward).
And here is a 7 month shift forward.

Key Levels// How it Works \\
Calculating Previous Days, Weeks and Monthly open, high, low, close and vwaps
Plots these levels on your chart
// Settings \\
You can enable/disable any of the levels you want to see
You can also change the amount of bars back the levels are plotted back to
// Use Case \\
These levels are often used in different methods of Technical analysis for support and resistance.
// Suggestions \\
Happy for anyone to make any suggestions on changes which could improve the script,
// Terms \\
Feel free to use the script, If you do use the script could you please just tag me as I am interested to see how people are using it. Good Luck!

Day/Week/Month/3M/6M/12M MTF breaks by makuchakuThis indicator plots breaks for multiple timeframes. Works on Daily to Yearly timeframes.
Currently supported timeframes :
Daily
Weekly
Monthly
Quarterly
Half Yearly
Yearly
It currently plots all breaks together. From Indicator settings hide what you don't need and save as default settings.

Weekly Volume HeatmapThis tool is designed to visualize how the trading volume of each asset changes during the week.
How to use
This tool can help us better understand the market and answer many questions, such as:
◽ How to avoid getting stop hunted?
Typically, trading volume decreases at certain times of the week, which is the best time for large holders to manipulate the market. Low volume means there is less liquidity in the market. Large transactions in an illiquid market can cause large price changes.
Large holders (whales) have enough capital to push the price in the desired direction to trigger a cascade of stop-loss orders which can move the price further.
After a stop hunt, the market typically reverses, leaving stop hunted traders behind.
It is best to avoid using stop-loss orders and leveraged trading during these hours of the week.
◽ When’s the best time to make decisions
During some hours of the week the trading volume usually decreases; at these times, most traders are inactive and do not participate in transactions.
Therefore, the price changes that occur during these times lack conviction.
It is better to make decisions when there are more active traders in the market. At these periods, a relatively high trading volume is usually observed.
How it works
First, it calculates the average traded volume of each period (for example Monday 9:00 AM) from the first bar to the last bar. It then calculates the ratio of the average traded volume in each period to the average traded volume per week. Finally, the result is displayed as a percentage in each cell.
Different values are distinguished by different background colors. Light colors are used for low values and dark colors are used for high values.
Limits
It only works in the 1 hour time frame.
Samples
Stock => AAPL
Futures => ES1!
Forex => EURUSD

[BFR] Naked LevelsDetects significant naked levels(Levels that have not been touched since the candle closed) and draws them on chart. These provide excellent profit targets and often reversal levels.
Roadmap:
✅ Candle open
☑ Point of control
☑ Multiple timeframes
☑ Something else? Leave a comment.
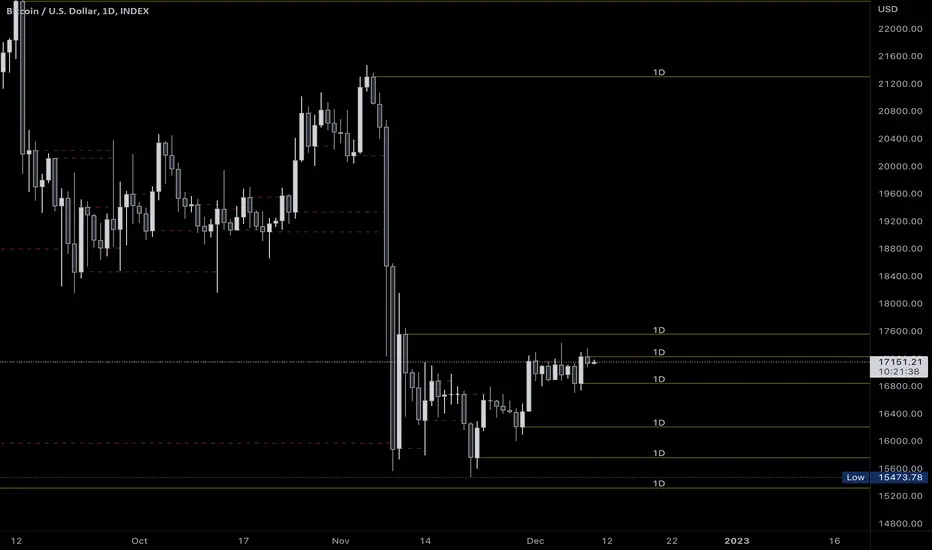
Key Levels (Time Frames - Weekly,Monthly,Quarterly,Yearly)This indicator plots the 4h, Daily, Weekly, Monthly, Quarterly, Yearly Open High, Low and Mids.
You can watch how these institutional trading levels work as support and resistance.
Most Important you can add alerts to these levels with a few clicks.
Just add/remove unnecessary levels for scaling problems.
For any error/suggestion/improvement just let me know.

Média 8, 21, 56, 200 SEMANAL - Augusto BackesFique tranquilo, aqui tem todas as médias que o Backes utiliza dentro de um indicador só, aproveite :)
