OPEN-SOURCE SCRIPT
Güncellendi Naked - Daily Weekly Monthly
User request for Naked Daily Weekly Monthly Opens.
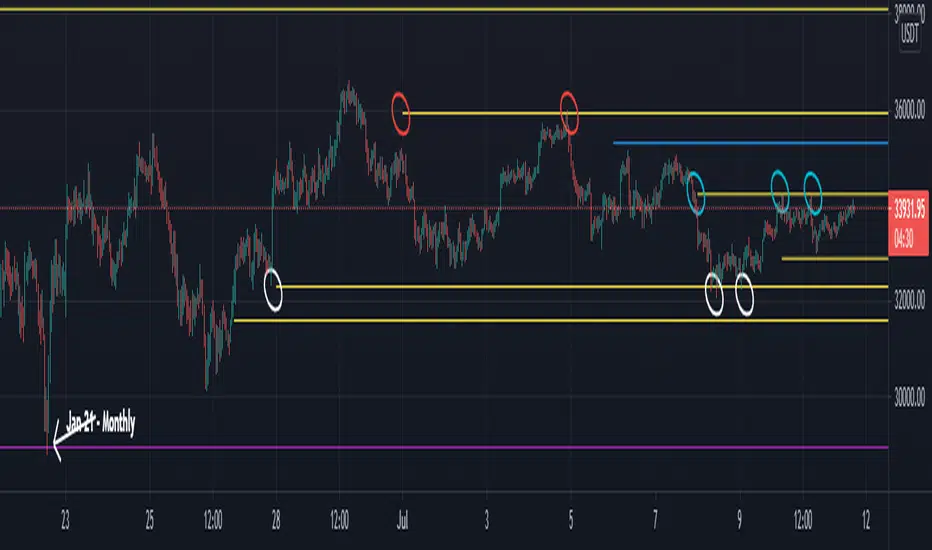
This indicator plots the Daily Weekly Opens (the day after day after creation), they then will stay on the chart until a candle close is completed on the other side of the plot.
In the above chart picture you can see how previous monthly and daily opens have acted as support and resistance.
Thanks go to:
StackOverFlow Bjorn Mistiaen
Sürüm Notları
Disclaimer This indicator works on the daily timeframe and below.
To pick up all naked lines move the chart back in time and then back to current price action.
Sürüm Notları
Update:User request for different line style options.
User can now change the line style from solid to dashed or dotted.
Sürüm Notları
Error highlighted by user in comments. Code updated to resolve issue.
Sürüm Notları
Script update:The script will now show totally Naked and Partially Naked Daily / Weekly / Monthly opens.
When looking back a previous price action keeping the partially Naked Opens as an option looks like a promising level for Technical Analysis.
Totally Naked = No price action breaks the level.
Partially Naked = Either the close or the open candles (Timeframe dependent) has not occurred below or above the level (dependent on Price Action to the level above or below).
Açık kaynak kodlu komut dosyası
Gerçek TradingView ruhuna uygun olarak, bu komut dosyasının oluşturucusu bunu açık kaynaklı hale getirmiştir, böylece yatırımcılar betiğin işlevselliğini inceleyip doğrulayabilir. Yazara saygı! Ücretsiz olarak kullanabilirsiniz, ancak kodu yeniden yayınlamanın Site Kurallarımıza tabi olduğunu unutmayın.
Feragatname
Bilgiler ve yayınlar, TradingView tarafından sağlanan veya onaylanan finansal, yatırım, işlem veya diğer türden tavsiye veya tavsiyeler anlamına gelmez ve teşkil etmez. Kullanım Şartları'nda daha fazlasını okuyun.