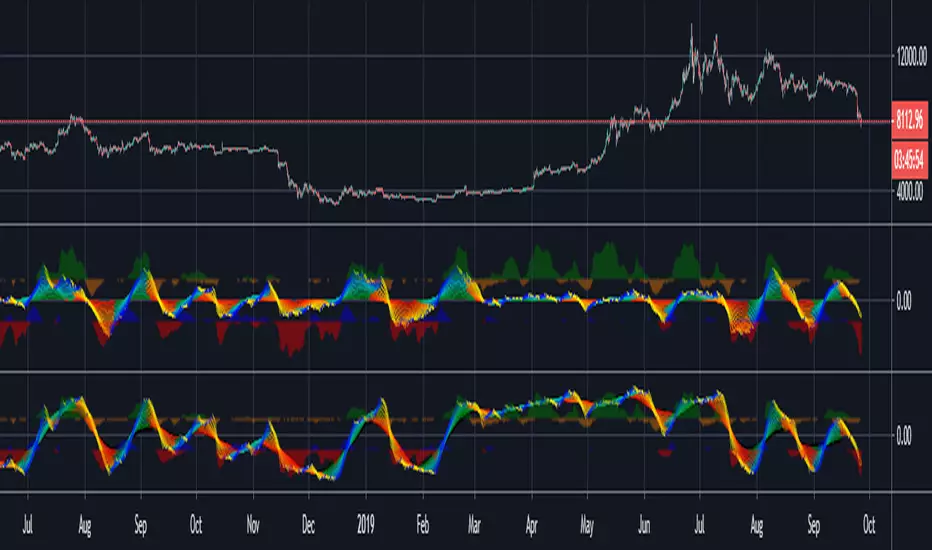
ZigZag WavesHello All,
I am here with a new idea and script, " Zigzag Waves ". This indicator creates 3 Zigzags with different lengths, keeps the lengths of each zigzag wave and calculates/draws average waves for each zigzag. optionally it can reset the wave when zigzag direction changes and new highest/lowest found. And optionally it draws Exponential Moving Average(EMA) of the sum of waves. This idea is very new and at the moment there is no optimization for the Zigzag Periods. Maybe we altogether can improve the idea and find the best zigzag periods for different symbols and time frames.
Using the options You can play with the periods, add/remove EMA, set its color and reset the waves on new Highest/Lowest. As far as I see resetting the waves on new Highest/Lowest may bring better results.
if we enable "Reset the waves on new Highest/Lowest":
Using different periods and EMA length:
P.S. if you have ideas to improve this script, drop a comment under the script please.
Enjoy!
Waves

Waves + ZOOnesTrend visualization tool in Wave theory. Unlike Elliot waves, it has a constant pattern length. The formation consists of impulse and 3 corrections.
The script analyzes candle relationships in the currect trend, trend will be continueted until candle are not breaking trend rules.
Currently it supports 2 rulesets/wave variants:
Low - More sensitive (trend will change more ofter).
Meddium - Less sensitive ( trend will change less ofter).
Simultaneous observation of both types allows to detect consolidation before the overlapping movement and increase the probability of indicating the moment of the movement occurrence.
Script with limited access, contact author to get authorization
Features:
- Show Low and Middle type/order waves
- Show support/resistance areas for the Low and Middle type/order waves.
- Types for waves and support areas are picked independently. Script can show Middle Waves with Low Waves support areas.
- Shadow mode that show second wave moved to the wave max/min bars.
- Show historical support/resistance areas that are not valid any more.
Script settings:
Trend type - You can switch what kind of waves should be drawn.
ImpulsMode - Picking graphical reprezentation of first bullish arrow.
Line width - With of drawn line. Separate setting for Low and Medium trend type.
Impuls - Color of the first bullish arrow.
Correction - Color for other arrows.
Trend shadow - Showing second reprezentation of the trend with drawing with the use of minimal and maximal values. It's usefull to determine the delay between the peak and a wave change signal.
ZOOnes type - Determines what type of trend is used to designate areas of support.
Only nearest zones - Drawing only one nearest zone above and below current price.
Only nearest potencial zones - Drawing only one nearest potencial zone above and below current price.
Show history - Showing zones in historical data
Zone precision - Determines how many bars are included in area calculation.
Alerts:
Low trend DOWN - When Low trend type is changing from UP to DOWN
Low trend UP - When Low trend type is changing from DOWN to UP
middle trend DOWN - When Middle trend type is changing from UP to DOWN
middle trend UP - When Middle trend type is changing from DOWN to UP
middle trend from ZOOnes DOWN - When Middle trend type is changing from UP to DOWN after hiting resistance area .
middle trend from ZOOnes UP = When Middle trend type is changing from DOWN to UP after hiting support area .
Troubleshooting:
In case of any problems, send error details to the author of the script.

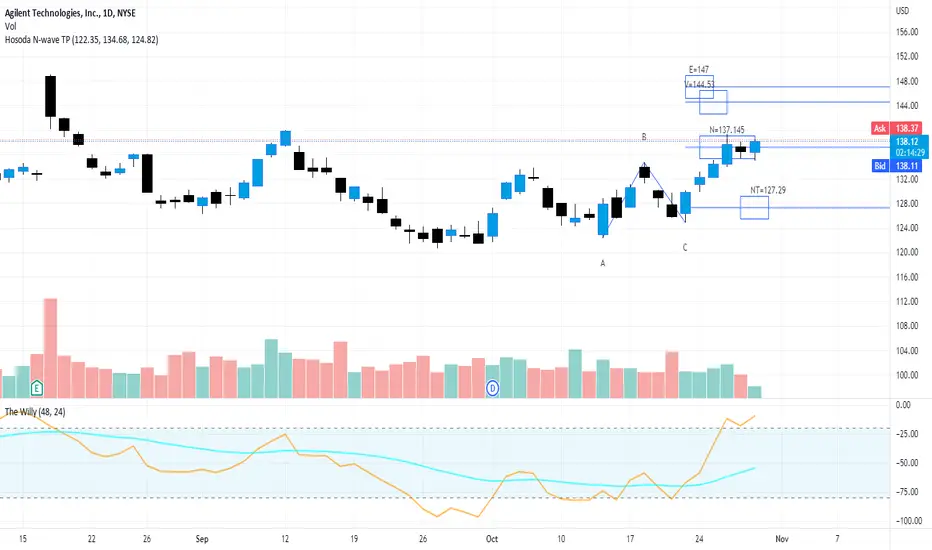
Hosoda N Wave and TPs {fmz}This script allows you to establish in a graphic and interactive way which are the N, NT, V and E targets for a Hosoda N wave.
Apply the indicator to the chart.
The interactive tool of Pine script version 5 will ask you to identify three points of "minimum-maximum-higher minimum" that form a bullish N wave of Hosoda (refer to the specific documentation for Hosoda N wave), or on the contrary three points "maximum-minimum-lower maximum" for a bearish N wave.
Once drawn, the price points can be moved.
When changing the market instrument, the indicator must be removed because it remains linked to the prices where it was first drawn.
Spread DifferentialThe Spread Differential tries to measure the speed of the market in any given direction. The histogram plots levels above or below zero in a sequence of Humps and Waves. Humps are repetitions of the previous trend before dropping to or near 0 whilst Waves are similar to Humps but the histogram must drop to or near 0 prior to forming another wave. You might notice that in no trend does the indicator ever form more than 2 waves. The indicator should be used in conjunction with the MA's selected in the panel to identify possible points of failure.

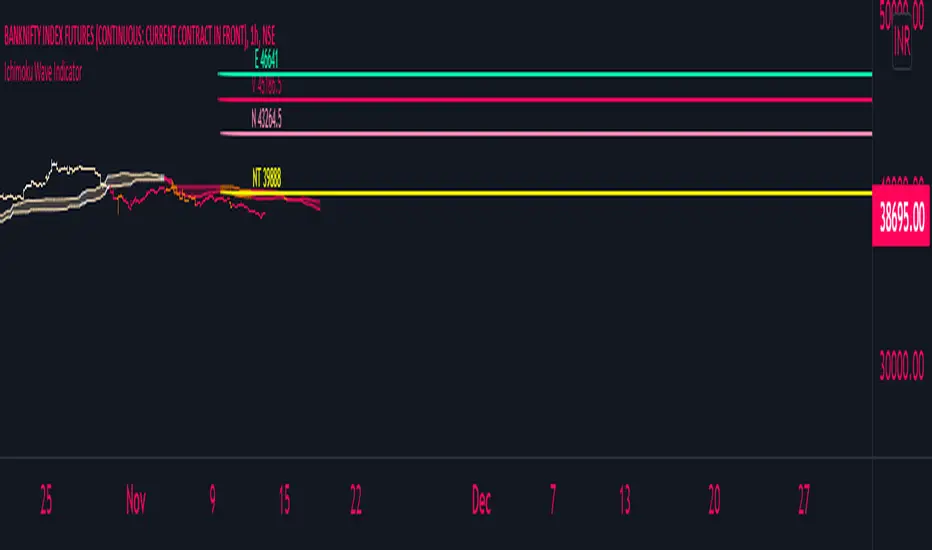
Ichimoku with Waves Created in 1940's by Goichi Hosoda withe the help of University students in Japan.
Ichimoku is one of the best trend following indicators that works nearly perfect in all markets and time frames.
Fill price in setup of indicator and you will find potential target zone of the wave
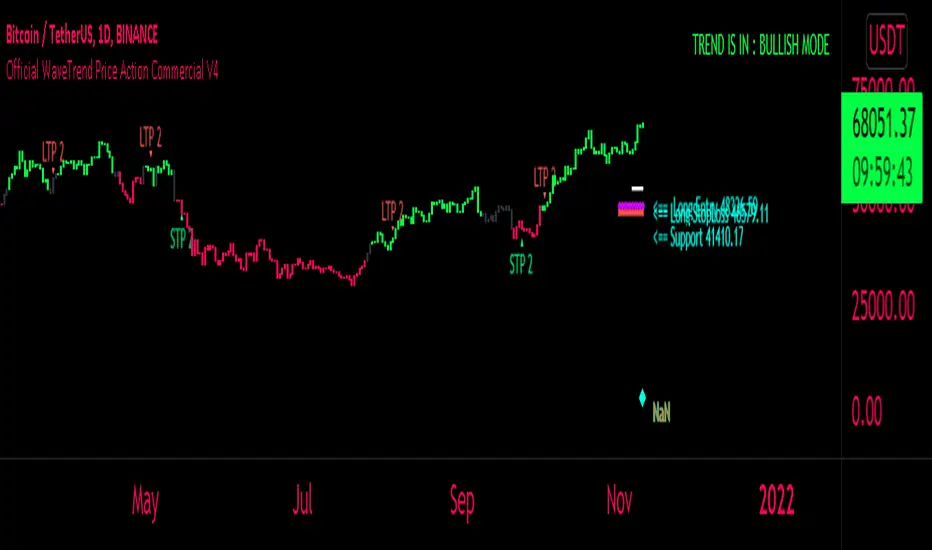
FaizanN Official WaveTrend Price Action Commercial PINEV4Hello Traders,
Here i bring you my first Price Action WaveTrend based Indictor combined with fib entry and exit trailing levels with minimum risk and maximum profit , as we must have seen at times as we enter the trend reverse and hits our stoploss . Keeping that in mind as i too struggled and made losses so i decided and focused more on minimizing the loss and only on confirmation Long or Short trade is been initiated along with Stoploss as explaned in the images below , why should we give market our money ;) as we are here to make money :D .. There is no holy grail as Stop loss wont be hit but yes it will be way less and all alerts are based on candle close ... One can use this on any chart and any timeframe and its very good for scalping too . Better results are on 15m and above . Hope you guys will like it and comment if you have any doubts..
-----------------
Disclaimer
Copyright by FaizanNawazz.
The information contained in my scripts/indicators/strategies/ideas does not constitute financial advice or a solicitation to buy or sell any securities of any type. I will not accept liability for any loss or damage, including without limitation any loss of profit, which may arise directly or indirectly from the use of or reliance on such information.
All investments involve risk, and the past performance of a security, industry, sector, market, financial product, trading strategy, or individual’s trading does not guarantee future results or returns. Investors are fully responsible for any investment decisions they make. Such decisions should be based solely on an evaluation of their financial circumstances, investment objectives, risk tolerance, and liquidity needs.
My scripts/indicators are only for educational purposes!
Happy Trading!
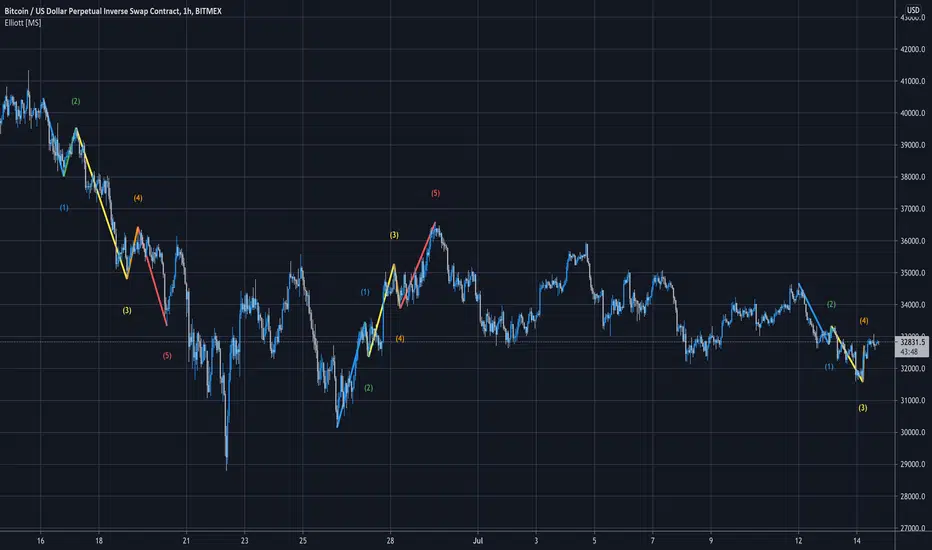
Elliott Wave [MS]Elliott Wave counter for TradingView! Automatically count Elliott waves on any asset and any timeframe. The script will count in-progress patterns as well as show past patterns that have completed (adjustable in Settings).
Simple to use, just add to your chart and choose how big of waves you're looking for with the Size setting.
Smaller numbers will auto count smaller sized Elliott Waves.
Larger numbers will auto count bigger sized Elliott Waves.
Scan for multiple size waves by adding the indicator to your chart multiple times.
Settings
Size - Set how big or small of waves you want to scan for
Hide Failed Patterns - Show or hide past waves that didn't get to 5
Color Mode - Set your own colors for each wave
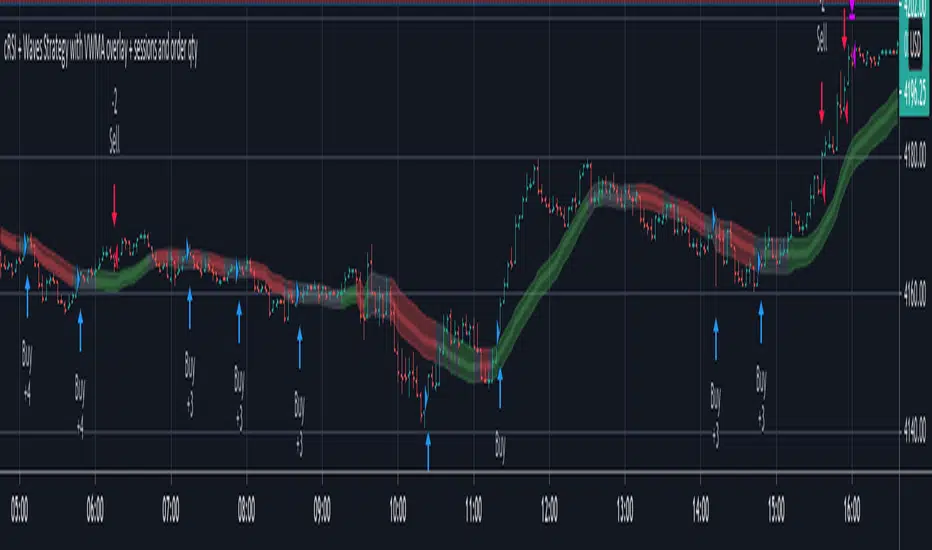
cRSI + Waves Strategy with VWMA overlay + sessions and order qtyThis is a fork of the cRSI + Waves Strategy with VWMA overlay strategy by Dr_Roboto , which adds two additional features, namely:
the ability to limit trade signals to certain defined periods of time ("Sessions") during the trading day and, optionally, to close any open position at the end of either or both "Sessions"
the ability to control the maximum order size suggested by the strategy on the "Inputs" tab of the strategy's "Settings" window
If you are trading on a daily chart (or longer) you must disable the Limit Signals to Trading Sessions? option in order for the strategy to produce signals.
All other features are identical to the original strategy (revision 2.0).
FEJ - DogeMarginFEJ - DogeMargin ist ein All-in-One Indikator.
Mit dem ihr euch praktisch das Upgrade auf eine bezahlte Tradingview Version sparen könnt.
- Wave-Detector: Bestehend aus einem innovativen Wave-Trenddetector mit dessen hilfe es sehr leicht ist einen Trendwechsel und die vorraussichtliche Stärke des kommenden Moves zu erkennen.
- NMA: Eine dynamische Trendlinie um die stärke der Signale zu überprüfen.
- Channel: Um potenzielle Trendwenden bzw. Überkaufte oder Überverkaufte Situationen zu erkennen.
- Golden- & Deathcross: SMA basierende Crosses um potenzielle Trendwendepunkte zu erkennen und bestehende Signale zu überprüfen. Die SMA Crosses sind in einem festgelegten Timeframe, welcher sich in den Einstellungen anpassen lässt. Die SMA´s sind optional einblendbar. In einem Update folgen noch MACD Crosses.
- Volume Candles: Dieser passt die Farbe der Candles entsprechend dem aktuellen Volumen und dessen Richtung an.
Dunkel Violett - Der Preis sinkt und das Volumen ist größer als 200% des Durchschnitts der letzten 20 Tage - Stark Bearish
Violett - Der Preis sinkt und das Volumen ist zwischen 50% und 200% des Durchschnitts der letzten 20 Tage - Volumen ist weder stark noch schwach
Helles Violett - Der Preis sinkt und das Volumen ist geringer 50% des Durchschnitts der letzten 20 Tage - Wenig Support für die aktuellen Preisbewegungen.
Aqua - Der Preis steigt und das Volumen ist größer als 200% des Durchschnitts der letzten 20 Tage - Stark Bullish
Blau - Der Preis steigt und das Volumen ist zwischen 50% und 200% des Durchschnitts der letzten 20 Tage - Volumen ist weder stark noch schwach
Helles Blau - Der Preis steigt und das Volumen ist geringer 50% des Durchschnitts der letzten 20 Tage - Wenig Support für die aktuellen Preisbewegungen.
- S & R Lines: Dieser Indikator zeigt die für diesen Timeframe aktuellen Support und Resistance Linien an.
- EMA Ribbons: Dieser Indikator zeigt ein Ribbon für den aktuellen Timeframe an.
Wave
Mit Hilfe der Welle in der Mitte lassen sich Trendwenden erkennen.Die Trendwende ist besonders stark, wenn das Signal bei einem Bull-Signal unterhalb der gelben NMA-Line liegt ; bei einem Bear-Signaloberhalb der gelben NMA-Linie liegt.
Wenn Kurs in folge eines Signals nach der NMA schließt, deutet das auf einen Trendwechsel hin. Bis dahin
Mit hilfe des Dogeprotocol lassen sich diese Signale noch weiter verbessern undgegenprüfen
Channel
NMA
Golden- & Deathcross
Zeigt an wo sich entweder ein SMA Golden- oder Death-Cross befindet
WICHTIG: Der TimeFrame für die Crosses ist festgelegt - Standardmäßig auf 4h (240m)
Es macht am meisten Sinn, den TF auf 1/10 deines Beobachtungszeitramens zu stellen.
2x SMA´s
Volume Candles
S & R Lines
EMA Ribbos
____________________________________________________________________________________________________________________________
English:
FEJ - DogeMargin is an all-in-one indicator.
With which you practically do that Upgrading to a paid Tradingview version can save you money.
- Wave detector: Consists of an innovative wave trend detector with its help it is very easy to change the trend and the anticipated Recognize the strength of the upcoming move.
- NMA: A dynamic trend line to check the strength of the signals.
- Channel: Around potential trend reversals or overbought or oversold situations to recognize.
- Golden & Death cross: SMA based crosses around potential trend turning points to recognize and to check existing signals. The SMA Crosses are in a fixed timeframe, which can be found in the settings can be adjusted. The SMAs can optionally be faded in. MACD Crosses will follow in an update.
- Volume Candles: This adjusts the color of the candles according to the current volume and its direction.
Dark Purple - The price is falling and the volume is greater than 200% of the Last 20 Day Average - Strongly Bearish
Purple - The price is going down and the volume is between 50% and 200% of the Last 20 days average - volume is neither strong nor weak
Light purple - the price goes down and the volume is less than 50% of the Average of the last 20 days - Little support for the current ones Price movements.
Aqua - The price goes up and the volume is greater than 200% of the Last 20 days average - Strong Bullish
Blue - The price is increasing and the volume is between 50% and 200% of the Last 20 days average - volume is neither strong nor weak
Light blue - the price goes up and the volume is less 50% of the Average of the last 20 days - Little support for the current ones Price movements.
- S & R Lines: This indicator shows the current support and for this timeframe
Resistance lines on.
- EMA Ribbons: This indicator shows a ribbon for the current timeframe.
Wave
Trend reversals can be seen with the help of the wave in the middle.
The turnaround is particularly strong when the signal is at one
Bull signal is below the yellow NMA line; on a bear signal is above the yellow NMA line.
If course closes on a signal after the NMA , it indicates one
Change of trend. Until then
With the help of the Dogeprotocol, these signals can be improved even further
double check
Channel
NMA
Golden & Death Cross
Shows where either a SMA golden or death cross is located
IMPORTANT: The timeframe für crosses is fixed - by default to 4h (240m)
It makes the most sense to set the TF to 1/10 of your observation timeframe.
2x SMAs
Volume candles
S&R Lines
EMA Ribbos

Function Square WaveThis is a script to draw a square wave on the chart, with an indicator for current price.
Markets undergoing Dow Jones or Wyckoff Accumulation/Distribution cycles tend to move in such waves, and if the period of the cycles are detected, a signal for accumulation/distribution phases can be created as an early warning.
Useful inputs:
- Average True Range as the wave height.
- Assumed Wave period as the wave duration.
I divided the current price wave by 2 to make the indicator more visually friendly.
GLHF
- DPT

Function Sawtooth WaveThis is an indicator to draw a sawtooth wave on the chart.
It can be a useful perspective, as decaying markets tend to oscillate in reverse sawtooth waves, and bullish markets can oscillate in conventional sawtooth waves. With the right inputs, it can be an early warning signal for potential movements.
Something I've noted is that large waves cause a ripple effect and sets the frequency for the market until a change occurs. Sawtooth waves may help in capturing ripple waves.
Useful inputs are:
- Average True Range as wave height (amplitude)
- Periodicity of market as wave duration (frequency)
(Inputs will change the wave from conventional to reverse)
I hope that it is helpful.
GLHF
- DPT

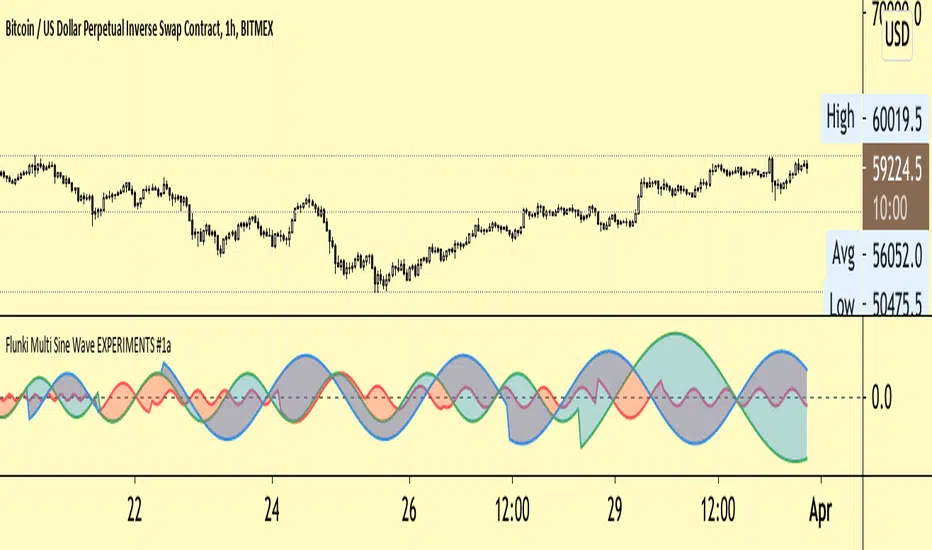
Flunki Multi Sine Wave EXPERIMENTS #1a** EXPERIMENTAL **
Herewith further sine wave experiments..
So you have 3 sine waves modulated by pivot points with look back / forward ranges
You can globally modulate the amplitude by the period, more fun than it sounds
You can flip phase individually
You can adjust offset individually
There is a global offset and a global period multiplier
See what you want to see !
Enjoy
ps. published this at xmas but it got kicked back by the mods for reasons
New Map For TradersUsing previous principles, This setup plots 60 moving averages on the chart. The averages are colored using a normalized oscillation technique (FFT).
To achieve the same display as above, put the same indicator twice and set the 'osx' parameter of one to 0 and the other to 2.
Feel free to play with the 'mul' parameter in ranges between 1-90. Most useful ranges will be 4-16 in my opinion.
Leave me a message if you'd like to explore the behaviors of the fractal dimension further ;)

cRSI + Waves Strategy with VWMA overlayStrategy based on my cRSI with motive/corrective wave indicator. Please note that it is far from perfect. I use it mostly to help me identify good entry and exit points when combined with my other technical analysis. It misses some obvious points, but on average it does pretty well. The challenge often is indicating when you have sufficient change in the cRSI to know that the trend has changed, that means sometimes it can be a little early or late. It definitely helps take a lot of the guess work out of things. It works better on some equities than others and better on some time frames than others. You just have to play with it. At the minimum, it is a good template to learn how to write your own.

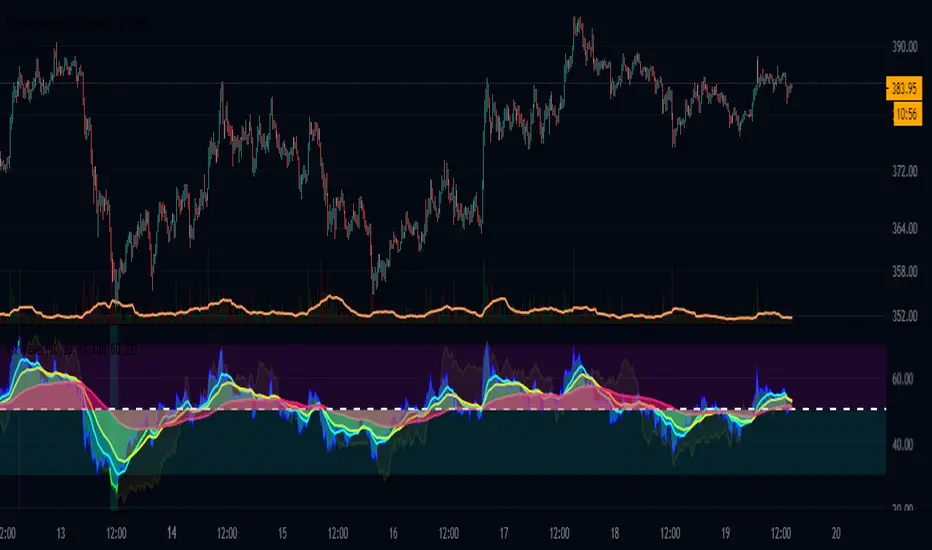
Finnie's RSI Waves + Volume Colored CandlesUsing RSI and 4 exponential moving averages, I created this indicator so that you can spot inconsistencies between price action and RSI. There's a lot of misunderstanding surrounding RSI, most people think if something's 'oversold' buying is a guarantee win. This definitely isn't the case as there's many more variable to consider. In addition, with this indicator, candles are colored based off of volume.
INDICATOR USE:
1. Determine trend
2. Find relative support/resistance
3. Once at support/resistance look for entries:
-RSI crossing over the Short EMA (CYAN) is your fist buy/sell signal
-Short EMA (CYAN) crossing Medium EMA (YELLOW) is your second
-RSI crossing Long EMA (PINK) is your final and most accurate signal
4. Once you've made an entry, you can follow step 3. in reverse for an exit
COLORED CANDLES:
Dark Green candles = Strong Bullish volume
Light Green = Average Bullish volume
Dark Red candles = Strong Bearish volume
Light Red = Average Bearish Volume
Orange/blue means volume is conflicting with price action
I plan to add a Colored DOT over each crossover as a visual buy/sell signal if anyone has any suggestions that'd be great :)
VWAP OscillatorToday I'm proposing a simple VWAP oscillator script to trade buy and sell waves more easily.
You trade this similar to how you trade Awesome Oscillator, so if you want an explanation just look up YT videos.
In addition to that, this will also show volume squeezes, please note that this is a makeshift way and not real volume squeeze phenomena of volume profile and tape. None the less, it is quite good at allowing you to ride out good trending waves and locate weak price action due to volume squeeze. You can turn off bar coloring from settings if you don't want this.
For ease of reading, I've also applied Allenstars Dynamic zones on this indicator so you can easily locate where the reading is entering in long and where it is in sell, this is compared to selected sample size. I've already selected the most common setting for that, so you don't really need to fiddle with it unless you find something better.
This indicator can be used to trade divergences as well, in fact, I feel it is better for that compared to RSI/MACD, the usual suspects.
Past performance is not assurance of future performance and this idea is published for only educational purposes, author taken no responsibility for your profit or loss.
predict lagUse the angle of multiple moving time windows to calculate the angular momentum vector across time. represent in a spectrum of frequencies\colors\transparency together with the accumulative "truth" (black)

GODMODE WAVESGODMODE WAVES
Basically used for Trend Direction purpose
Indicator shows Trend direction depending upon price action
Simple to use
Blue/Cyan color shows Trend is Bullish
Red color shows trend is Bearish
Bands acts as support and resistance
lable shows when the crossover happened
Bar colors
Red/Orange = Extremely over bought zone
Green = Extremely over sold zone
(Note = when bar colors appears take profits or wait for the retrace )
DM me for access

Stochastic Heat MapA series of 28 stochastic oscillators plotted horizontally and stacked vertically from bottom to top as the oscillator background.
Each oscillator has been interpreted and the value has been used to colour the lines in.
Lower lines are shorter term stochastics and higher lines are longer term stochastics.
The average of the 28 stochastics has been taken and then used to plot the fast oscillator line, which also has a slow oscillator line to follow.
The oscillator line can be used to colour in the candles.
Inputs:
MA: multiple smoothing methods
Theme: multiple colours
Increment: stochastic length start and increments
Smooth Fast: smooth fast length
Smooth Slow: smooth slow length
Paint Bars: colour candles
Waves: toggle method to weight/increment stochastics
Heat map shows momentum extremes:

Fianchetto v1Hello, I created this script last year I decided I would release it to the public. This script uses Moving Averages to attack or defend price action given the current conditions of the market. This strategy is ONLY for currencies I would NOT recommend using on any other markets. This strategy is wrong about 55% of the time so use at your own risk. This strategy has 2 main focuses, 1. Catching trends and riding trends 2. Defending Profits from a Trend, as a trend starts to form you want to make sure you can get the most juice out of the trend while also ensuring profit taking throughout the trend. This algorithm uses moving averages in a more creative way than just trading crossover's, we use a small MA to use it's direction of travel as a traffic light while using a bigger MA as a filter for our trade bias (bear or bull). Our Traffic light or small MA is what ensures we are defending profits as when the traffic light switches colors we close our trade even if our filter is still the same bias. This however does not mean we are done trading the current trend wave, We wait for our traffic light to switch back to the same bias as our filter to re-enter the trade. I will be updating this system as time goes on, if you have any questions or problems please pm me, QuantsGambit

Elliott Wave - AutoCounting [NXT2017] draws the Wave 3 and 5HI BIG PLAYERS,
here's another indicator that I use pretty often.
The waves of Elliott Wave theory are automatically detected and displayed.
It makes it possible to count the Elliott waves almost always correctly and plausibly. However, the tool can only detect wave 3 as well as waves 5, A, B and C. The rest you have to draw yourself.
Sometimes the waves 3 and 5/A/B/C overlap - so I only use the view with wave 3 myself.
Kind regards
NXT2017

Waves in Price (Volume Waves)Waves in Price (Volume Waves)
TheDowVolumeBigot>0 (Bullish) =Lime color
Very High=Dark Green color
High=Green color
TheDowVolumeBigot<0 (Bearish) =Orange color
Low=Red color
Very Low=Dark Red color
Barcolor

ToTheSunN_Community-EditionPlease share your thoughts and ideas to improve and simplify the oscillator :) will keep updating this version