Volume-Weighted Supertrend Strategy [wbburgin]This is a script that can be used as a strategy or a standalone indicator.
The Volume-Weighted Supertrend is a supertrend based on a rolling VWAP, instead of a normal price source. The strategy has two components - a supertrend based off of this VWAP (shown on the chart) and a supertrend from volume itself (not plotted on the chart directly). The supertrend from volume is an example of my "Supertrend Any Source" indicator, where a custom ATR is created from non-OHLC data; this is available as both a separate public script and also in my "wbburgin_utils" library for you to use in your own script creation.
The supertrend from volume acts as a confirmation filter for the VWAP-supertrend shown on-chart. If the volume supertrend is trending up and the VWAP-based supertrend is also trending up, a buy signal is generated. Likewise, if the volume supertrend is trending down and the VWAP-supertrend is trending down, a sell signal is generated. The colors are based off of whether both supertrends are trending up or down: green for both up, blue for only price up, orange for only price down, and red for both down.
The settings enable you to change the volume length and the ATR length separately, as well as the multiplier and the source for the price supertrend. If you load the indicator for the first time and see no entries and exits, this is because "Show Strategy Entries and Exits" is disabled in the settings. This is if you plan on using the strategy as an indicator and don't want to be bothered by the entry and exit symbols on the chart. Additionally, for those who like clean charts (like me), you can turn all the labels off in the settings, as well as the highlighting.
My default strategy settings for the strategy results shown below are as follows: 5% equity per trade, 5 degrees of pyramiding, commissions of 0.08% per trade. This strategy doesn't come with stops yet, so please be aware of that before using it to trade - I highly suggest you create your own stops based off of your R/R ratio and personal risk tolerance. Additionally, it works best on trending assets (b/c of the supertrends) with high volume. This might mean it does not work as well on lower timeframes.
Hacim

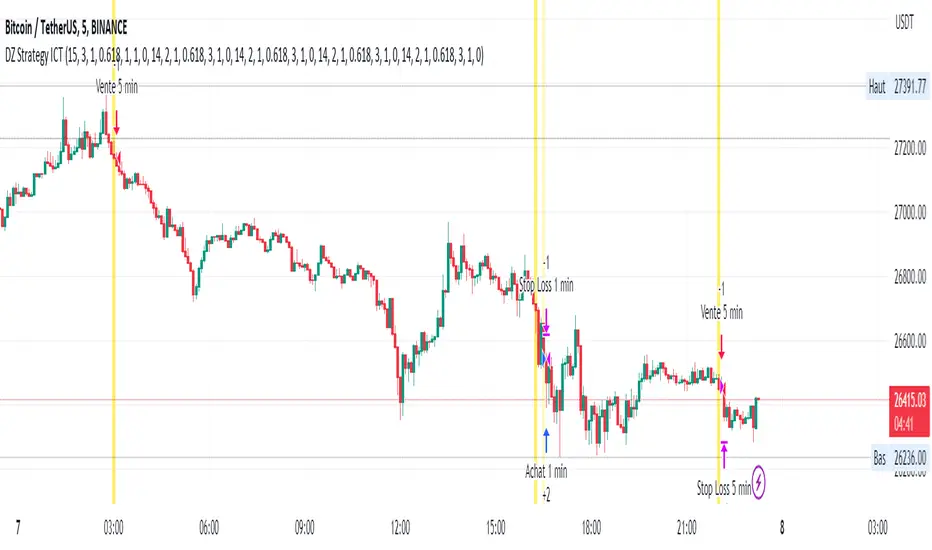
DZ Strategy ICTThe script presented is a trading strategy called "Breaker Block Strategy with Price Channel". This strategy uses multiple time frames (1 minute, 5 minutes, 15 minutes, 1 hour, and 4 hours) to detect support and resistance areas on the chart.
The strategy uses parameters such as length, deviations, multiplier, Fibonacci level, move lag and volume threshold for each time frame. These parameters are adjustable by the user.
The script then calculates support and resistance levels using the simple moving average (SMA) and standard deviation (STDEV) of closing prices for each time frame.
It also detects "Breaker Blocks" based on price movement from support and resistance levels, as well as trade volume. A Breaker Block occurs when there is a significant breakout of a support or resistance level with high volume.
Buy and sell signals are generated based on the presence of a Breaker Block and price movement from support and resistance levels. When a buy signal is generated, a buy order is placed, and when a sell signal is generated, a sell order is placed.
The script also plots price channels for each time frame, representing resistance and support levels.
Profit limit levels are set for each time range, indicating that the price levels assigned to positions should be closed with a profit. Stop-loss levels are also set to limit losses in the event of canceled price movements.
In summary, this trading strategy uses a combination of Breaker Block detection, support and resistance levels, price channels and profit limit levels to generate buy and sell signals and manage positions on different time ranges.
BB and KC StrategyThis script is designed as a TradingView strategy that uses Bollinger Bands (BB) and Keltner Channels (KC) as the primary indicators for generating trade signals. It aims to catch potential market trends by comparing the movements of these two popular volatility measures.
Key aspects of this strategy:
1. **Bollinger Bands and Keltner Channels:** Both are volatility-based indicators. The Bollinger Bands consist of a middle band (simple moving average) and two outer bands calculated based on standard deviation, which adjusts itself to market conditions. Keltner Channels are a set of bands placed above and below an exponential moving average of the price. The distance between the bands is calculated based on the Average True Range (ATR), a measure of price volatility.
2. **Entry Signals:** The strategy enters a long position when the upper KC line crosses above the upper BB line and the volume is above its moving average. Conversely, it enters a short position when the lower KC line crosses below the lower BB line and the volume is above its moving average.
3. **Exit Signals:** The strategy exits a position under two conditions. First, if the trade has been open for a certain number of bars defined by the user (default 20 bars). Second, a stop loss and trailing stop are in place to limit potential losses and lock in profits as the price moves favorably. The stop loss is set at a percentage of the entry price (default 1.5% for long and -1.5% for short), and the trailing stop is also a percentage of the entry price (default 2%).
4. **Trade Quantity:** The script allows specifying the investment amount for each trade, set to a default of 1000 currency units.
Remember, this is a strategy script, which means it is used for backtesting and not for real-time signals or live trading. It is also recommended that it is used as a tool to aid your trading, not as a standalone system. As with any strategy, it should be tested over different market conditions and used in conjunction with other aspects of technical and fundamental analysis to ensure robustness and effectiveness.
VWAP Trendfollow Strategy [wbburgin]This is an experimental strategy that enters long when the instrument crosses over the upper standard deviation band of a VWAP and enters short when the instrument crosses below the bottom standard deviation band of the VWAP. I have added a trend filter as well, which stops entries that are opposite to the current trend of the VWAP. The trend filter will reduce total false breakouts, thus improving the % profitable while maintaining the overall returns of the strategy. Because this is a trend-following breakout strategy, the % profitable will typically be low but the average % return will be higher. As a rule, be sure to look at the average winning trade % compared to the average losing trade %, and compare that to the % profitable to judge the effectiveness of a strategy. Factor in fees and slippage as well.
This strategy appears to work better with the lower timeframes, and I was impressed with its results. It also appears to work on a wide range of asset classes. There isn't a stop loss or take profit built-in (other than the reversal signals, which close the current trade), so I would encourage you to expand on the strategy based on your own trading parameters.
You can toggle off the bar colors and the trend filter if you so desire.
Future updates to this script (or ideas of improving on it) might include a take profit level set at one standard deviation past the current level and a stop loss level set at one standard deviation closer to the vwap from the current level - or applying a multiple to the two based off of your reward/risk ratio.
About the strategy results below: this is with commissions of 0.5 % per trade.

TrendFollow-1HThis is a trading strategy specially used on btcusdtperp in binance 1H chart
The most important part of this strategy is to use Support and Resistance with trading volume
Auxiliary indicators are include Directional Movement Index, trading volume, Commodity Channel Index,volume-weighted average price,Range Filter
Why is it not applicable to other trading varieties or exchanges?
Because the activity of each trading target is different from the trading volume, this strategy is very focused on the change of trading volume, so it may not be applicable to every trading variety
The idea of this strategy is to chase when the trend in the market is clear
Determine whether to break support or resistance to identify trends
But the market is full of false breakouts
Therefore, trading volume is an important indicator for judging the true and false.
Therefore, when the price breaks through support or resistance, accompanied by a huge trading volume, and forms a resonance with auxiliary indicators, the strategy will follow the trend, a time stop loss is also set. After entering the market, if there is no immediate profit to the stop profit, you will leave the market first.
But the market is always random, so the profit and loss ratio must be taken into account
Use a fixed stop loss space in exchange for a larger profit space, and ensure that the expected value is positive to make stable profits in the market
Therefore, this strategy uses 3.2% stop loss, 3.3% Take profit1 and 7.2% take profit2
About 1.5:1 profit and loss ratio to ensure positive expected value
Because the market has a clear trend only about 10% of the time
So the trading frequency of this strategy is very low
According to the backtest of up to 2021-01-01 till now , it takes about 5 days to make a transaction
User can choose their own leverage to obtain higher returns. But be sure to prioritize risk.
In order to prevent you from using this strategy without knowing it, the trading date of this strategy is only executed until the release date, and positions will not be opened and closed for subsequent markets.
You can contact me if you want to know more about this strategy
這是專門用於幣安1H圖表中btcusdtperp的交易策略
本策略最重要的部分是將支撐和阻力與交易量一起使用
輔助指標包括ADX,成交量,CCI,VWAP,Range Filter等
為什麼不適用於其他交易品種或交易所?
由於每個交易標的的活躍度與交易量不同,本策略非常注重交易量的變化,因此不一定適用於每個交易品種
這個策略的方法是在趨勢明朗的時候進行趨勢跟隨
確定是否打破支撐或阻力以識別趨勢
但市場充滿假突破
因此,成交量是判斷真假的重要指標。
當價格突破支撐位或阻力位,伴隨著巨大的成交量,並與輔助指標形成共振時,策略會順勢而為,同時設置時間止損。進場後,如果沒有立即獲利到止盈,就離場。
但市場總是隨機的,所以必須考慮盈虧比
用固定的止損空間換取更大的盈利空間,保證預期值為正,才能在市場中穩定獲利
因此,該策略使用 3.2% 止損、3.3% 止盈1 和 7.2% 止盈2
約1.5:1盈虧比,確保正期望值
因為市場只有大約 10% 的時間有明顯的趨勢
所以這個策略的交易頻率很低
根據2021-01-01至今的回測,交易頻率大約5天一次
用戶也可以選擇適合自己的槓桿以獲得更高的收益。但一定要優先考慮風險。
為防止您在不知情的情況下使用本策略,本策略的運行交易的日期僅至2023-05-30止,後續日期將不開倉和平倉。
如果您想了解更多有關此策略的信息,可以聯繫我。
Slight Swing Momentum Strategy.Introduction:
The Swing Momentum Strategy is a quantitative trading strategy designed to capture mid-term opportunities in the financial markets by combining swing trading principles with momentum indicators. It utilizes a combination of technical indicators, including moving averages, crossover signals, and volume analysis, to generate buy and sell signals. The strategy aims to identify market trends and capitalize on price momentum for profit generation.
Highlights:
The strategy offers several key highlights that make it unique and potentially attractive to traders:
Swing Trading with Momentum: The strategy combines the principles of swing trading, which aim to capture short-to-medium-term price swings, with momentum indicators that help identify strong price trends and potential breakout opportunities.
Technical Indicator Optimization: The strategy utilizes a selection of optimized technical indicators, including moving averages and crossover signals, to filter out the noise and focus on high-probability trading setups. This optimization enhances the strategy's ability to identify favourable entry and exit points.
Risk Management: The strategy incorporates risk management techniques, such as position sizing based on equity and dynamic stop loss levels, to manage risk exposure and protect capital. This helps to minimize drawdowns and preserve profits.
Buy Condition:
The buy condition in the strategy is determined by a combination of factors, including A1, A2, A3, XG, and weeklySlope. Let's break it down:
A1 Condition: The A1 condition checks for specific price relationships. It verifies that the ratio of the highest price to the closing price is less than 1.03, the ratio of the opening price to the lowest price is less than 1.03, and the ratio of the highest price to the previous day's closing price is greater than 1.06. This condition looks for a specific pattern indicating potential bullish momentum.
A2 Condition: The A2 condition checks for price relationships related to the closing price. It verifies that the ratio of the closing price to the opening price is greater than 1.05 or that the ratio of the closing price to the previous day's closing price is greater than 1.05. This condition looks for signs of upward price movement and momentum.
A3 Condition: The A3 condition focuses on volume. It checks if the current volume crosses above the highest volume over the last 60 periods. This condition aims to identify increased buying interest and potentially confirms the strength of the potential upward price movement.
XG Condition: The XG condition combines the A1 and A2 conditions and checks if they are true for both the current and previous bars. It also verifies that the ratio of the closing price to the 5-period EMA crosses above the 9-period SMA of the same ratio. This condition helps identify potential buy signals when multiple factors align, indicating a strong bullish momentum and potential entry point.
Weekly Trend Factor: The weekly slope condition calculates the slope of the 50-period SMA over a weekly timeframe. It checks if the slope is positive, indicating an overall upward trend on a weekly basis. This condition provides additional confirmation that the stock is in an upward trend.
When all of these conditions align, the buy condition is triggered, indicating a favourable time to enter a long position.
Sell Condition:
The sell condition is relatively straightforward in the strategy:
Sell Signal: The sell condition simply checks if the closing price crosses below the 10-period EMA. When this condition is met, it indicates a potential reversal or weakening of the upward price momentum, and a sell signal is generated.
Backtest Outcome:
The strategy was backtested over the period from January 22nd, 1999 to May 3rd, 2023, using daily candlestick charts for the NASDAQ: NVDA. The strategy used an initial capital of 1,000,000 USD, The order quantity is defined as 10% of the equity. The strategy allows for pyramiding with 1 order, and the transaction fee is set at 0.03% per trade. Here are the key outcomes of the backtest:
Net Profit: 539,595.84 USD, representing a return of 53.96%.
Percent Profitable: 48.82%
Total Closed Trades: 127
Profit Factor: 2.331
Max Drawdown: 68,422.70 USD
Average Trade: 4,248.79 USD
Average Number of Bars in Trades: 11, indicating the average duration of the trades.
Conclusion:
In conclusion, the Swing Momentum Strategy is a quantitative trading approach that combines swing trading principles with momentum indicators to identify and capture mid term trading opportunities. The strategy has demonstrated promising results during backtesting, including a significant net profit and a favourable profit factor.

Price Action Trading StrategyIn this strategy, we define the high and low of the previous candle, and then check whether the current candle's high or low is higher or lower than the previous candle's high or low, respectively. If there's a new high, we enter a long position, and if there's a new low, we enter a short position. We also set exit conditions to close the position if the price drops below the previous low or rises above the previous high.
Please note that this is a simple example and should not be used as a standalone trading strategy. It is important to conduct thorough backtesting and consider other factors such as risk management before implementing any trading strategy.
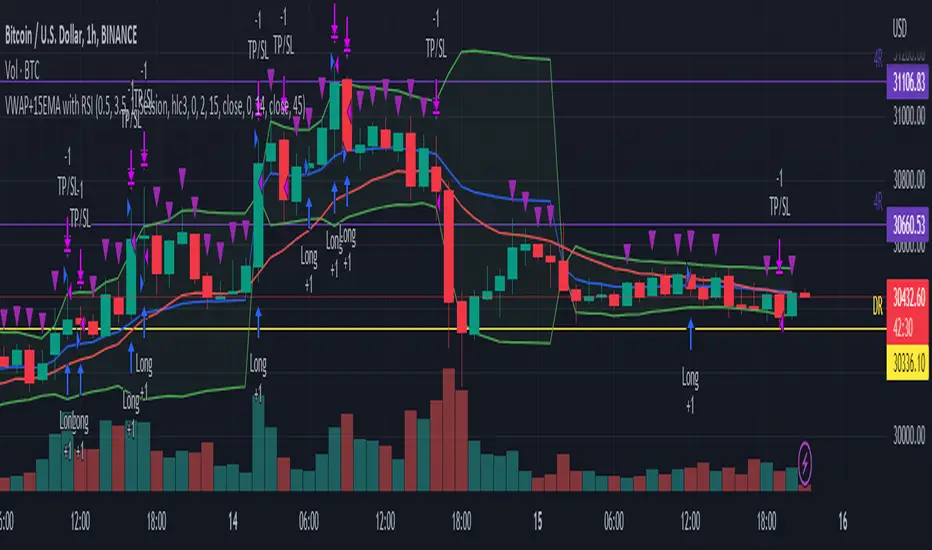
VWAP+15EMA with RSIVWAP+EMA+RSI Strategy for the group MelléCasH
This strategy will enter a long position when the closing price is above both the VWAP and the 15 EMA, and the RSI is above the specified overbought level. It will exit the position when the price falls by the specified stop loss percentage, rises by the specified take profit percentage, or when the trailing stop loss (which trails the highest price achieved after the position was entered by the specified percentage) is hit. The VWAP, EMA, and RSI indicators are also plotted on the chart for reference.
VWAP Breakout Strategy (Momentum, Vol, VWAP, RSI, TrSL)General Description and Unique Features of this Script
Introducing the VWAP Breakout Trading Algorithm for TradingView – the timeless strategy designed to identify the highest probability entries and trades for all financial securities and timeframes.
Unlike other strategies, the VWAP Breakout Strategy considers the buying/selling pressure in the market and supply/demand balance to generate real-time trading signals. The Relative Strength Index (RSI) is used as a technical measure to capture typical breakouts from consolidation periods and pullback entries.
With flexible backtesting options, traders can improve parameter settings depending on their time horizon and the type of financial securities being used. Plus, this pro-version of the VWAP Breakout Strategy offers stop-loss, take-profit, and trailing stop-loss exit strategies for better risk management.
The VWAP Breakout Strategy combines a number of technical indicators, the Moving Average (MA), the Volume Weighted Average Price (VWAP) and the RSI-qualifier to identify potential trend reversals and entry/exit points in the market. The VWAP Breakout Strategy can be used in conjunction with other technical indicators and fundamental analysis to make more informed trading decisions.
To further optimize trading results, this strategy generates trading signals based on real-time price action, rather than relying on the close / open of candles.
The VWAP Breakout Strategy
One important qualifier for generating buy signals is that the stock or other financial security is not in a short-term overbought status (for long-positions), or in a short-term oversold status (for short-positions), respectively.
Additionally, the stock or other financial security needs to go through a consolidation period before buy signals are being generated.
The RSI-indicator is being used as a technical measure in this strategy for that.
• Using moderate parameters for the RSI-qualifier (oversold-level 40 or higher, overbought level 60 or lower) will capture more typical breakouts from consolidation periods.
• Using more extreme parameters for the RSI-qualifier (oversold-level 35 or lower, overbought level 65 or higher) will capture the so-called pullback entries.
Long Entries
When the selling pressure is over and the continuation of the uptrend can be confirmed by the MA / VWAP crossover after reaching a price low, a buy signal is issued by this strategy.
Short Entries
When the byuing pressure is over and the continuation of the downtrend can be confirmed by the MA / VWAP crossover after reaching a price high, a sell signal is issued by this strategy.
Timeless Strategy
The underlying principles of this strategy are based on the buying- / selling pressure in the market as well as the supply and demand balance. The buying / selling volumes are being considered for the generation of trading signals. These sophisticated market principles make this strategy timeless which means it can be applied to 1min-charts, weekly charts as well as anything between those.
Generation of Trading Signals
Real-time process are considered for this pro-version of the VWAP Breakout Strategy. This is another benefit versus many other strategies which only consider the close or open of the canldes for trading signals:
Exit Strategies
This pro-version offers the following exit strategies:
• Stop-Loss
• Take-Profit
• Trailing Stop-Loss
The trailing SL functionality provides another benefit versus most other trading strategies resulting in significantly backtesting- and real-time trading results.
Trades will also be closed when an opposite trading signal is being generated (only applicable for combined long/short strategies).
Flexible Backtesting Option
The strategy offers fully flexible backtesting options to improve the parameter setting strategy, depending on time horizon and type of financial securities being used.
Relative Strength Index (RSI)
The Relative Strength Index (RSI) is a technical indicator developed by Welles Wilder in 1978. The RSI is used to perform a market value analysis and identify the strength of a trend as well as overbought and oversold conditions. The indicator is calculated on a scale from 0 to 100 and shows how much an asset has risen or fallen relative to its own price in recent periods.
The RSI is calculated as the ratio of average profits to average losses over a certain period of time. A high value of the RSI indicates an overbought situation, while a low value indicates an oversold situation. Typically, a value > 70 is considered an overbought threshold and a value < 30 is considered an oversold threshold. A value above 70 signals that a single value may be overvalued and a decrease in price is likely , while a value below 30 signals that a single value may be undervalued and an increase in price is likely.
For example, let's say you're watching a stock XYZ. After a prolonged falling movement, the RSI value of this stock has fallen to 26. This means that the stock is oversold and that it is time for a potential recovery. Therefore, a trader might decide to buy this stock in the hope that it will rise again soon.
The MA / VWAP Crossover Trading Strategy
This strategy combines two popular technical indicators: the Moving Average (MA) and the Volume Weighted Average Price (VWAP). The MA VWAP crossover strategy is used to identify potential trend reversals and entry/exit points in the market.
The VWAP is calculated by taking the average price of an asset for a given period, weighted by the volume traded at each price level. The MA, on the other hand, is calculated by taking the average price of an asset over a specified number of periods. When the MA crosses above the VWAP, it suggests that buying pressure is increasing, and it may be a good time to enter a long position. When the MA crosses below the VWAP, it suggests that selling pressure is increasing, and it may be a good time to exit a long position or enter a short position.
Traders typically use the MA VWAP crossover strategy in conjunction with other technical indicators and fundamental analysis to make more informed trading decisions. As with any trading strategy, it is important to carefully consider the risks and potential rewards before making any trades.
This strategy is applicable to all timeframes and the relevant parameters for the underlying indicators (RSI and MA/VWAP) can be adjusted and optimized as needed.
Backtesting Results
Backtesting gives outstanding results on all timeframes and drawdowns can be reduced to a minimum level. In this example, the hourly chart for MCFT has been used.
Settings for backtesting are:
- Period from April 2020 until April 2021 (1 yr)
- Starting capital 100k USD
- Position size = 25% of equity
- 0.01% commission = USD 2.50.- per Trade
- Slippage = 2 ticks
Other comments
• This strategy has been designed to identify the most promising, highest probability entries and trades for each stock or other financial security.
• The RSI qualifier is highly selective and filters out the most promising swing-trading entries. As a result, you will normally only find a low number of trades for each stock or other financial security per year in case you apply this strategy for the daily charts. Shorter timeframes will result in a higher number of trades / year.
• As a result, traders need to apply this strategy for a full watchlist rather than just one financial security.

Cloud X MesoHello there fellow Traders!
Thanks for stopping by, so today I will be covering everything you need to to know about this TradingView strategy.
Below I will discuss everything you need to know about this strategy so you can get a full grasp of what the strategy is, the features, what it does, how it works, the benefits of how this strategy can help you, and the results.
What is Cloud X Meso?
-Cloud X Meso is a strategy that consists of 7 indicators to all line up for total confluence to take a buy or sell once all 6 indicators conditions are met. This strategy does not repaint and doesn't require any technical analysis to be used. The strategy can be used on any timeframe, and any instrument.
-I have optimized many different variations for different types of trading instruments of this strategy ready to be used. The difference of this strategy is that these variations do not need any reoptimization to keep up with recent market conditions since there are hardly any inputs used, which prevents common overfitting problems. The main goal was for this strategy to be automated, as well as plug and play or you can officially consider this as set and forever forget.
What does this strategy do?
-The main goal for this strategy is to catch long or short term trends by waiting for all 7 indicators to line up as well as using customized trading times to trade certain sessions where there is high amounts of volume in the market. This strategy doesn't always need to have a clear trending market, since it can also catch short term trends in choppy markets as well. Overall, the strategy tell you when it buys, sells, and exits after all conditions are met.
How does the strategy work?
-The way that this strategy works is when all of the indicators confluences are met. Next, a buy or sell label will print and the candles colors will color blue or red to show that the trade is in the buy or sell position followed along with a magenta colored line which is the trailing stop to follow the trade until the trade exits from the trailing stop being hit or if the strategies exit condition is met.
-The strategy does have a set Take Profit target since it relies on the trailing stop to end the trade. This is beneficial so you can catch any size of a trend move when the strategy is in high volume market sessions. You catch these trends by customizing the settings to toggle on or off certain indicators, functions, configuring a customized trading time, and toggling on or off certain trading days to make a specific approach for fine tuning a pair to trade in a certain time window with high amounts of volume to catch trending moves whether it be a long or short term trend.
Below I will explain each functionality of the strategy for you to better understand the different ways you can adjust the settings of this strategy.
Backtest Settings:
-You can use these settings to determine a start / end date of what results you would like to see in the strategy tester.
-You can determine the $ amount you would like to see on strategy testers results to be in terms of net profit and max drawdown.
-You can choose whether you want the strategy to take buys only, sells only, or buys and sells.
Automation:
-Compatible with Pine Connectors to fully automate this strategy for MT4/5
-It uses a % based risk when placing trades so you won't have to calculate a proper lot size or dollar amount.
-You can also put the symbol of what that strategy will be trading on so you know what pair its trading.
Custom Trading Times:
-When you customize a trading time for the strategy to trade in, the background will turn blue for that specific time window, and you can use the "Session Exit" function to have trades close once the time window ends when toggled on, or you can have the existing trades close on their own when "Session Exit" is toggled off.
Dynamic Trailing:
-The algorithm uses a volatility based indicator to determine proper stop loss placement depending on how volatile the market is. This will prevent you from guesstimating if your stop loss is too big or too small.
-When Dynamic trailing is off, then the strategy will use a Risk Reward based stop loss to trail everytime the trades hits a new Risk Reward target.
-You can also toggle on or off for the stop loss to go to break even once the trade hits a 1:1 Risk Reward.
Directional Bias Settings:
-This indicator is the main directional bias that uses a multi timeframe function to determine the directional bias, you can also use the Exponential Moving Average as a form of directional bias instead, or you can use both of them to work together to find the directional bias. You can also toggle each one on or off
Entry / Exit Settings:
-This indicator also uses a multi timeframe function but it determines the entry and exit for a trade when all confluences are met. You can also toggle the entry and exit functions on or off.
1 Candle Rule:
-This feature is inspired by No Nonsense Forex (NNFX) the main function of this is if your entry doesn't meet all the entry conditions, then the strategy will wait 1 more candle to meet all the entry conditions to take a trade.
No Trade Zone:
-This feature will uses a Volume based indicator to filter out low volume markets. The candles will turn grey to indicate the algorithm not to take trades, and you can also customize the sensitivity of how strong this indicator will filter out the low volume in the markets.
Indicator functions
Each indicator plays a certain role and also meets certain conditions when a buy or sell trade is placed. I will reveal 3 out of 7 of the indicators used to preserve the uniqueness of this strategy but overall, the logic of this strategies main goal is to ride long or short terms trends while getting dynamic Risk Reward trades.
-The first indicator that the strategy uses an Exponential Moving Average that is customizable, and is used as a form of a filter for either a long or short term directional bias to filter out false signals to help the algorithm trade with the trend.
-The second indicator that the strategy uses is an Oscillator which is the Wavetrend and this indicators functionality for the algorithm is used for the its buy and sell signals to line up with all the other indicators for confluence. This indicator can also be toggled on or off for you own preference
-The third indicator used is the Volume indicator, and this is used to give the other indicators the green light to enter a trade if there are high amounts of volume in the market.
What are the benefits of using this algorithm?
Stress Free Trading:
-Once automated, you will no longer need to stare at the charts all day, as well as trying to execute the trades on time or worried that you missed a setup. Or you can choose to take trades manually when a buy or sell signal comes up
Stress Free Risk Management:
-All you have to do is provide a risk % and the algorithm will do the rest of the work calculating the stop loss, exiting trades, etc. No more needing to find the right lot size, or dollar amount, all in all the strategy will manage the trades for you.
Psychology:
-when you choose to have a systematic trading approach, it eliminates a lot bad habits from human nature
What are the results like?
-I have multiple different variations of results of this strategy, but I will share one of the results.
Here is a screenshot below of what this strategy can do from just one of the variations.
The backtest below was done with another variation on simulating a 100k account risking 0.50% per trade.
Thank you for taking the time to read through this whole guide, and I hope this helped you better understand the strategy.

JS-TechTrading: VWAP Momentum_Pullback StrategyGeneral Description and Unique Features of this Script
Introducing the VWAP Momentum-Pullback Strategy (long-only) that offers several unique features:
1. Our script/strategy utilizes Mark Minervini's Trend-Template as a qualifier for identifying stocks and other financial securities in confirmed uptrends.
NOTE: In this basic version of the script, the Trend-Template has to be used as a separate indicator on TradingView (Public Trend-Template indicators are available on TradingView – community scripts). It is recommended to only execute buy signals in case the stock or financial security is in a stage 2 uptrend, which means that the criteria of the trend-template are fulfilled.
2. Our strategy is based on the supply/demand balance in the market, making it timeless and effective across all timeframes. Whether you are day trading using 1- or 5-min charts or swing-trading using daily charts, this strategy can be applied and works very well.
3. We have also integrated technical indicators such as the RSI and the MA / VWAP crossover into this strategy to identify low-risk pullback entries in the context of confirmed uptrends. By doing so, the risk profile of this strategy and drawdowns are being reduced to an absolute minimum.
Minervini’s Trend-Template and the ‘Stage-Analysis’ of the Markets
This strategy is a so-called 'long-only' strategy. This means that we only take long positions, short positions are not considered.
The best market environment for such strategies are periods of stable upward trends in the so-called stage 2 - uptrend.
In stable upward trends, we increase our market exposure and risk.
In sideways markets and downward trends or bear markets, we reduce our exposure very quickly or go 100% to cash and wait for the markets to recover and improve. This allows us to avoid major losses and drawdowns.
This simple rule gives us a significant advantage over most undisciplined traders and amateurs!
'The Trend is your Friend'. This is a very old but true quote.
What's behind it???
• 98% of stocks made their biggest gains in a Phase 2 upward trend.
• If a stock is in a stable uptrend, this is evidence that larger institutions are buying the stock sustainably.
• By focusing on stocks that are in a stable uptrend, the chances of profit are significantly increased.
• In a stable uptrend, investors know exactly what to expect from further price developments. This makes it possible to locate low-risk entry points.
The goal is not to buy at the lowest price – the goal is to buy at the right price!
Each stock goes through the same maturity cycle – it starts at stage 1 and ends at stage 4
Stage 1 – Neglect Phase – Consolidation
Stage 2 – Progressive Phase – Accumulation
Stage 3 – Topping Phase – Distribution
Stage 4 – Downtrend – Capitulation
This strategy focuses on identifying stocks in confirmed stage 2 uptrends. This in itself gives us an advantage over long-term investors and less professional traders.
By focusing on stocks in a stage 2 uptrend, we avoid losses in downtrends (stage 4) or less profitable consolidation phases (stages 1 and 3). We are fully invested and put our money to work for us, and we are fully invested when stocks are in their stage 2 uptrends.
But how can we use technical chart analysis to find stocks that are in a stable stage 2 uptrend?
Mark Minervini has developed the so-called 'trend template' for this purpose. This is an essential part of our JS-TechTrading pullback strategy. For our watchlists, only those individual values that meet the tough requirements of Minervini's trend template are eligible.
The Trend Template
• 200d MA increasing over a period of at least 1 month, better 4-5 months or longer
• 150d MA above 200d MA
• 50d MA above 150d MA and 200d MA
• Course above 50d MA, 150d MA and 200d MA
• Ideally, the 50d MA is increasing over at least 1 month
• Price at least 25% above the 52w low
• Price within 25% of 52w high
• High relative strength according to IBD.
NOTE: In this basic version of the script, the Trend-Template has to be used as a separate indicator on TradingView (Public Trend-Template indicators are available in TradingView – community scripts). It is recommended to only execute buy signals in case the stock or financial security is in a stage 2 uptrend, which means that the criteria of the trend-template are fulfilled.
This strategy can be applied to all timeframes from 5 min to daily.
The VWAP Momentum-Pullback Strateg y
For the JS-TechTrading VWAP Momentum-Pullback Strategy, only stocks and other financial instruments that meet the selected criteria of Mark Minervini's trend template are recommended for algorithmic trading with this startegy.
A further prerequisite for generating a buy signals is that the individual value is in a short-term oversold state (RSI).
When the selling pressure is over and the continuation of the uptrend can be confirmed by the MA / VWAP crossover after reaching a price low, a buy signal is issued by this strategy.
Stop-loss limits and profit targets can be set variably.
Relative Strength Index (RSI)
The Relative Strength Index (RSI) is a technical indicator developed by Welles Wilder in 1978. The RSI is used to perform a market value analysis and identify the strength of a trend as well as overbought and oversold conditions. The indicator is calculated on a scale from 0 to 100 and shows how much an asset has risen or fallen relative to its own price in recent periods.
The RSI is calculated as the ratio of average profits to average losses over a certain period of time. A high value of the RSI indicates an overbought situation, while a low value indicates an oversold situation. Typically, a value > 70 is considered an overbought threshold and a value < 30 is considered an oversold threshold. A value above 70 signals that a single value may be overvalued and a decrease in price is likely , while a value below 30 signals that a single value may be undervalued and an increase in price is likely.
For example, let's say you're watching a stock XYZ. After a prolonged falling movement, the RSI value of this stock has fallen to 26. This means that the stock is oversold and that it is time for a potential recovery. Therefore, a trader might decide to buy this stock in the hope that it will rise again soon.
The MA / VWAP Crossover Trading Strategy
This strategy combines two popular technical indicators: the Moving Average (MA) and the Volume Weighted Average Price (VWAP). The MA VWAP crossover strategy is used to identify potential trend reversals and entry/exit points in the market.
The VWAP is calculated by taking the average price of an asset for a given period, weighted by the volume traded at each price level. The MA, on the other hand, is calculated by taking the average price of an asset over a specified number of periods. When the MA crosses above the VWAP, it suggests that buying pressure is increasing, and it may be a good time to enter a long position. When the MA crosses below the VWAP, it suggests that selling pressure is increasing, and it may be a good time to exit a long position or enter a short position.
Traders typically use the MA VWAP crossover strategy in conjunction with other technical indicators and fundamental analysis to make more informed trading decisions. As with any trading strategy, it is important to carefully consider the risks and potential rewards before making any trades.
This strategy is applicable to all timeframes and the relevant parameters for the underlying indicators (RSI and MA/VWAP) can be adjusted and optimized as needed.
Backtesting
Backtesting gives outstanding results on all timeframes and drawdowns can be reduced to a minimum level. In this example, the hourly chart for MCFT has been used.
Settings for backtesting are:
- Period from April 2020 until April 2021 (1 yr)
- Starting capital 100k USD
- Position size = 25% of equity
- 0.01% commission = USD 2.50.- per Trade
- Slippage = 2 ticks
Other comments
• This strategy has been designed to identify the most promising, highest probability entries and trades for each stock or other financial security.
• The RSI qualifier is highly selective and filters out the most promising swing-trading entries. As a result, you will normally only find a low number of trades for each stock or other financial security per year in case you apply this strategy for the daily charts. Shorter timeframes will result in a higher number of trades / year.
• As a result, traders need to apply this strategy for a full watchlist rather than just one financial security.

Extended Price Volume Trend Strategy : EducationalThe Extended Price Volume Trend (EPVT) is a technical indicator that is used to identify potential trend changes and measure the strength of a trend. In this strategy, we combine the EPVT with other indicators to create a trading system that aims to capture trend reversals and momentum shifts.
The EPVT indicator is calculated by taking the cumulative volume and multiplying it by the percentage change in price. We then find the highest and lowest values of this indicator over a certain period of time to determine the baseline. The difference between the EPVT and the baseline is then plotted on a chart to create the EPVT line.
To use this indicator for trading, we look for crossovers of the EPVT line with zero. When the EPVT crosses above zero, it indicates that buying pressure is increasing, and we may consider taking a long position. Conversely, when the EPVT crosses below zero, it indicates that selling pressure is increasing, and we may consider taking a short position.
To further refine our trading signals, we use three take-profit levels, which we set as a percentage of the current EPVT value. We also use a simple moving average to provide additional confirmation of trend changes.
In summary, the EPVT trading strategy is a technical analysis-based approach to trading that aims to identify potential trend reversals and momentum shifts. By combining the EPVT indicator with other technical tools, we can create a comprehensive trading system that provides clear entry and exit signals for both long and short positions. Please note that this strategy is for educational purposes only and should not be taken as financial advice.

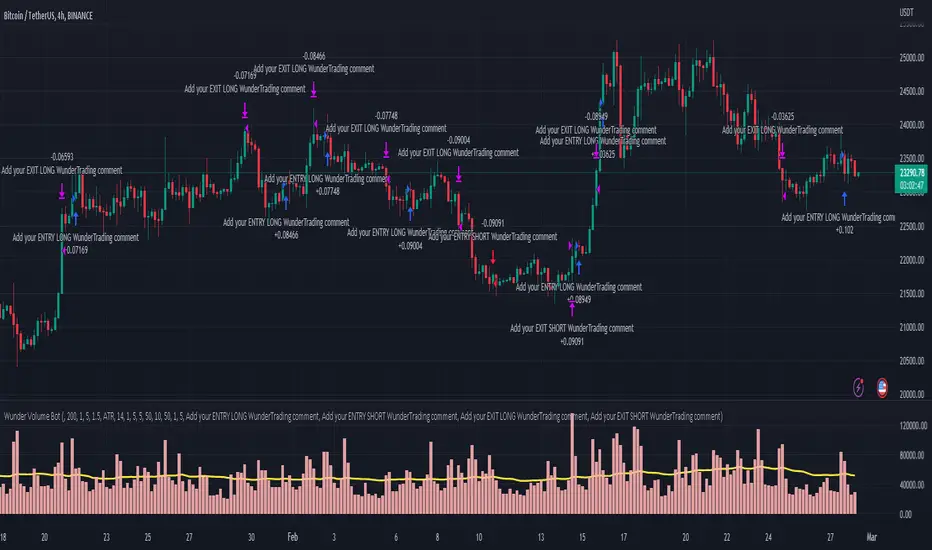
Wunder Volume botWunder Volume Bot
1. Wunder Volume bot is a non-indicator strategy that is based on the Volume analysis.
2. For the entry we will use the volume multiplier to detect the abnormal volume activity. For example, the volume should be 2 times the average. You can set your own preferences for each asset. It is recommended to use a higher multiplier and multiple assets to run multiple different bots in order to diversify your approach.
3. A function for calculating risk on the portfolio (your deposit) has been added to the Wunder Volume bot script. When this option is enabled, you get a calculation of the entry amount in dollars relative to your Stop Loss. In the settings, you can select the risk percentage on your portfolio. The loss will be calculated from the amount that will be displayed on the chart.
For example, if your deposit is $1000 and you set the risk to 1%, with a Stop Loss of 5%, the entry volume will be $200. The loss at SL will be $10.10, which is your 1% risk or 1% of the deposit.
Important! The risk per trade must be less than the Stop Loss value. If the risk is greater than SL, then you should use leverage.
The amount of funds entering the trade is calculated in dollars. This option was created if you want to send the dollar amount from Tradingview to the exchange. However, putting your volume in dollars you get the incorrect net profit and drawdown indication in the backtest results, as TradingView calculates the backtest volume in contracts.
To display the correct net profit and drawdown values in Tradingview Backtest results, use the ”Volume in contract” option.
Broadview Economic StudioThank you for taking the time to read this description. We'll be taking a look at the Broadview Economic Studio. This has been a work-in-progress for years and is a very powerful tool for planning trades with complex volume scaling strategies. We will be talking about many indicators and types of indicators used in the public domain, but it is NOT recommended to reverse engineer our scripts as there is quite a bit of logic in the code that works to make each common approach entirely unique. So although you may understand quite a bit about oscillators, the way they work with the rest of the logic within the script may change the way you know them to work from elsewhere.
In the chart snapshot above you'll see a mild configuration where I only had to tweak a few settings. Commissions are set to 0.1%, starting capital is set to $10,000, and slippage is off. In my tests orders came through less than a penny off. Generally speaking, there are really only two situations in which you should be concerned about slippage. The first is if you trade really low timeframe charts like the 1 second. This tool, while it works for any timeframe, is programmed on the 45 minute timeframe and works best there. The other situation in which you should be prepared for slippage is if you're using extremely high volume trades in the hundreds of thousands or millions depending on the market cap and liquidity of the asset you're studying. Large orders like that have to be split up among several deals and that can cause slippage.
There are 31 primary inputs for users to tweak. Each input is grouped within a module called a Suite. Each suite has a focus like filtering signals or strategically allocating volume according to your strategy. Everything starts with the Origin Suite. The Origin Suite is a group of inputs that generates Tops & Bottoms from price action. It uses math like Rate of Change, where one can specify a required rate of change before an Origin signal can be made, and users can specify how much lower in price a bar must be compared to previous bars. So with the Origin Suite, users can control how often they want to see originating signals and under what conditions they can appear.
We used to use WVF and CVI to produce top and bottom signals, but our Origin Suite works much better for systematically generating profitable configurations.
The triangles you see on the chart represent markers, potential signals, or Prop Signals as they're referred to within the script. The blue arrows represent trades where Prop Signals were allowed to pass as true long signals. There are two ways to ignore Prop Signals. You can filter the markers entirely, or you can reduce their volume scaling to the minimum which is usually $10 for most exchanges. We're first going to be talking about some of the primary DCA inputs before we talk about the technology we use to filter and overload signals.
Here are some important features found within the script:
Base Orders
Safety Orders
Take Profits
Change-Based Volume Scaling
Ignoring Low or Medium Changes
Overloading
Filtering
Alert Messages w/ Volume Scaling
Let's walk through each of these features in more depth.
The Base Order is the initial Long position within a series. It comes in first and is followed by all of its Safety Orders. The Base Order is set to $25 within the script by default. Keeping the base order low allows one to reserve more of their capital for Safety Orders that are lower within a dip, and thus, lower the user's Position Average. The primary feature of this script is to help users plan their volume scaling strategically, and this is where we start. It's this kind of due diligence and effort in protecting trades that makes this script unique.
So we start with a low Base Order. Then, we follow with a lot of Safety Orders. Typically in DCA this is done in consistent time intervals and in consistent amounts. So in regular DCA one may invest the same amount bi-weekly on pay day. They use the financial instrument as a sort of savings and average their position over their consistent investments. This is not where the bleeding edge of DCA is today though. In modern Doller Cost Averaging, I would expect to see signals and volume scaling based on logic.. as opposed to being consistent intervals.
This sets up the explanation of the primary means of volume scaling within the script. Mathematically, we start with the net balance. This is your specified starting balance plus any wins or losses. Users specify what % of their Available Balance they would like to start with when volume scaling. This percent of capital is then multiplied by a Safety Order Multiplier. The safety order multiplier is made up of a number specified by the user, multiplied by the number of the Safety Order you're on. So user's can control this equation/algorithm and scale their investments as the number of Safety Orders increases and drops in price become more opportune.
The Take Profit within the script lets users specify their desired ROI from a series. So if a user sets a 60% take profit, the script will set a price from the position average that when reached will give the user a 60% ROI for the series including its Base Order and all its Safety Orders.
Before moving on, let's talk about the amazing internal reporting found in the script. When you zoom in on the blue arrows, you can see each trade is accompanied by some extremely helpful information. This is just another feature that makes this script unique, it is the feature that gives us accurate reporting and ultimately allows us to connect with TradingView's Strategy Tester in a way that provides instant backtests with good merit. With this reporting not only can users get reports and information on trades made on different assets with different configurations, but user's can perform a deep dive on each configuration and know exactly what was going on for each trade. The first number is the number of the safety order the script is on. Remember, this is used in the primary volume scaling math. The second number is the amount the script spent on the current trade. The third number denotes the cumulative spending for the series. The final number displays the script's available balance at that time. With these numbers, the TradingView Strategy Tester, and the List of Trades feature, users can practice as much due diligence as they need during their studies.
Let's move on to talking about my favorite suite within the script, the Volume Scaling Suite. Here there are two primary means of controlling volume scaling. Although, in the near future there will be more.
In this suite you'll find Change-Based Volume Scaling and Position Average Volume Scaling. Position Average Volume Scaling is quite easy to explain. This feature only allows signals to pass if they are lower in price than your base order. In this way, users can apply most of their capital to trades that lower their position average. Simply having the money in the market can boost profits, but having a lower Position Average is the entire reason we DCA. Change-Based Volume Scaling is quite a bit more complex.
In theory, one could argue that every moment is a great moment to buy. It's just that some moments are more opportune than others. So it's not about perfect signals as much as it's about proper volume scaling.
Change-Based Volume Scaling allows us to set rules that dictate how much volume scaling is used based on the asset's current delta, or Rate of Change.
Using CBVS, one can downscale capital applied to signals with a low ROC, or simply ignore them. So if a signal comes in and the price hasn't changed very much then you can automatically use less volume for the trade. One can do the same thing for medium changes, and the user can specify what quantifies as a low or medium change. Users can give extra volume to signals with a greater rate of change, or overload signals with a high rate of change! So the CBVS feature gives users the ability to allocate volume based on logic rooted in the asset's rate of change. If a signal has dropped a lot in price, then generally, it is deserving of more capital and that's what makes this feature unique and so powerful.
There are two kinds of Overloading found in the script. There's overloading from CBVS, and then overloading from the 4 signal filtering suites. There's an important difference to note before we move on. Overloading performed by CBVS is based on ignored signals. So if you ignore low or medium change signals, and you have CBVS Overloading on, the script will allocate more capital to High Change signals. When signals are ignored, they are downscaled to $10. Whereas with the filtering suites, if a signal is filtered the Prop Signal triangle marker is removed entirely. The overloading in that scenario is simply applied to signals that aren't filtered. The reason it's done this way is because allowing ignored signals to still come in, with the lowest volume scaling possible, keeps the Safety Order count rising which works in the volume scaling math. This math is intrinsic to getting capital deep within dips and crashes.
So in future versions we may allow ignored signals to be filtered out entirely but for the time being, simply scaling them down to the lowest possible amount is what produces the best and most consistent configurations.
Let's talk about filtering signals, and the overloading provided within each filtering suite.
Here you can see our Overbought & Oversold Heatmap V3. This is a unique indicator that takes 15 common oscillators and visualizes them in a way that clearly denotes confluence. Looking at this indicator makes it easer to read cycles and trends. It is quite common for investors to base their entire scripts on one or more of the oscillators found within the OBOS Heatmap V3. So the OBOS Heatmap V3 is an awesome way to ensure your signals follow an oversold trend! The orange represents an oscillator being oversold, while the yellow represents it being overbought. Generally, when an asset is oversold it is a better time to buy. One can filter signals based on this information and use the Heatmap's unique ability to quantify confluences. In this script users can set a sensitivity and that sets the number of oscillators that must be in agreement before a signal is allowed to pass.
Here are the oscillators found within the OBOS Heatmap:
*Please keep in mind that although some of these oscillators may have big names, the code and math in the script may work differently than you're used to. This is because the code and math is changed quite a bit, and the overall intended functionality of the OBOS Heatmap has a larger scope than any one indicator. It's also important to note that the lengths for these oscillators are set low and are meant to classify the individual signal as either overbought or oversold, and not the entire period. So while the OBOS Heatmap is awesome for trends and cycles, it's ultimately meant to classify individual price bars as either overbought or oversold according to a consensus.*
Relative Strength Index
Money Flow Index
Commodity Channel Index
Aroon Oscillator
Relative Volatility Index
Fast Stochastic Detrended Price Oscillator
Fast Stochastic Elders Force Index
Fast Stochastic Relative Strength Index
Fast Stochastic Relative Vigor Index
Fast Stochastic Klinger Oscillator
Fast Stochastic Awesome Oscillator
Fast Stochastic Ultimate Oscillator
Fast Stochastic Chande Momentum Oscillator
Fast Stochastic On Balance Volume Oscillator
Fast Stochastic Moving Average Convergence/Divergence
Each band of the Overbought & Oversold Heatmap represents an oscillator. When it's orange it's said to be oversold. When it's yellow it's said to be overbought. The indicator turns purple during trends and reversals where it is neither overbought nor oversold. It can differentiate between uptrends and downtrends with differing colors of purple, but the OBOS Heatmap is not used for trends or cycles in this script. It is used to quantify oversold confluence.
Let's talk about the Dominance Suite.
First note in the top portion of the screenshot above, you will see various colors in the script. It replaces the price line with something we call Price Flow bars. So when you add the script it's best to make the stock price line invisible in TV settings. The Price Flow Bars use a preset EMA to color price action as being in either a downward momentum or upward momentum. The triangular signals represent dark teal for the initial long marker within a series, dark green for long orders and long signals that convert into safety orders, and light green for safety orders. This is more logic that makes this script really unique. The dark green initial long marker signals are rarely seen. You can find them at the beginning of a new series of signals and they work to establish when a new series of signals should begin. The dark green signals actually denote a long base order opportunity, but if a series has already started then these signals are converted into Safety Orders. The Safety Orders then come in light green, and red for Prop Shorts. Prop Shorts work with Initial Longs to establish the start of a new series. More on that math I cannot tell.
In the bottom half of the screenshot is the Dominance Suite itself. It's another one of the four filtering suites found in the script. It is made up of 7 oscillators that work to classify a price bar as being controlled by either the bears or the bulls. If a price bar is controlled by the bears it is said to be a better investment. The Dominance Suite works by applying a moving average to the balance of power. This is the way TradingView has intended the balance of power to be used, and works quite nicely in classifying individual price bars as either bearish or bullish. It's not an overall trend indicator as much as it states whether a bar is mostly controlled by the bears or the bulls.
Here are the oscillators found within the Dominance Suite:
SMA of BOP
EMA of BOP
HMA of BOP
WMA of BOP
VWMA of BOP
TEMA of BOP
LSMA of BOP
Within the script, there is an input for a negative threshold. When each of these 7 oscillators is in confluence and below this set threshold, the Prop Long will be allowed to pass as a real trade.
Keep in mind that each filtering suite also has the option to overload signals.
So not only can you filter signals based on these suites but you can also apply additional volume scaling to signals that don't get filtered.
Here we have the True Oscillator. The True Oscillator is a brand new oscillator. It's similar to things like the RSI or DPO, but technically speaking it considers many more factors into its average than other oscillators. It considers balance of power, sentiment, volume, momentum, gravity, and places special-strategic weighting on price data based on whether it's opening, closing, high, or low. If you stack the True Oscillator up with the RSI you'll notice right away they look similar, but each movement is quite different. Overall the movements are more balanced, the individual bars are more consistent with price data, and the swings are more clearly pronounced while simultaneously having a better register of strength in momentum. We use this indicator to filter and overload signals, to trade according to momentum, and to provide a 16th independent oscillator that can check the OBOS Heatmap without having to be confluent.
The final filtering suite is based on Net Volume. It classifies signals as oversold when there is a significant negative trend in net volume. If Net Volume is under 0, and trends downward for either 3, 4, or 5 bars in a row then it will mark a signal as oversold and allow it to pass. Then, if overloading for this suite is turned on it will allocate more volume to signals it does not filter out.
There is a lot that can be said about this strategy. The primary takeaway though is that it's not just one strategy. It's a tool for everyone, to help them plan their approach to different assets in different market climates. This tool can help you study current market conditions. It can allow you to plan a strategic approach to market segments, and see how your strategy would fare if new market data performed similarly. It's not just one strategy, but more of a strategy printer.
The Origin Suite allows users to plan the positioning of their signals. The Overbought & Oversold Suite allows users to filter their signals based on whether or not they are oversold. The Dominance Suite allows users to filter signals based on whether the market is being controlled by the bears or the bulls. The True Oscillator gives users the ability to filter signals based on a deep and powerful momentum oscillator. The Net Volume Suite lets users filter signals based on volume trends. When signals are filtered, signals that pass, can be overloaded with additional volume scaling. Features like Change-Based Volume Scaling and Position Average Volume Scaling give users plenty of inputs to create complex volume scaling strategies. Common-sense DCA inputs allow users to scale into markets the way pros do.
The Broadview Economic Studio is a powerful tool for planning trades with complex volume scaling strategies.
Users can plan their approach to different kinds of markets. They can link the script with their bot or broker like 3Commas, and the script will automatically send the correct volume scaling through to the bot.
Thank you for your time, and for reading the description of the Broadview Economic Studio.

Last Price minus Open Price Intraday VolumeLast Price minus Open Price Intraday Volume
Change in price from day Open price to Last Price indicate the stock price movement. Last Price minus Open Price Intraday Volume indicator is framed on volume change during change in price from day Open price to Last Price. It takes into account the average intraday volume based on intraday length of bars and actual volume attributed to change in price from day Open Price to Last Price. The indicator reflects the change in trend .By analyzing the position of price on the basis of average change in volume during intraday with that of volume attributed to change in price from day open Price to Last price one may decide upon the course of trade.
DISCLAIMER: For educational and entertainment purposes only. Nothing in this content should be interpreted as financial advice or a recommendation to buy or sell any sort of security or investment including all types of crypto.
Strategy Myth-Busting #7 - MACDBB+SSL+VSF - [MYN]This is part of a new series we are calling "Strategy Myth-Busting" where we take open public manual trading strategies and automate them. The goal is to not only validate the authenticity of the claims but to provide an automated version for traders who wish to trade autonomously.
Our seventh one we are automating is the "Magic MACD Indicator: Crazy Accurate Scalping Trading Strategy ( 74% Win Rate )" strategy from "TradeIQ" who claims to have backtested this manually and achieved 427% profit with a 74% winrate over 100 trades in just a 4 months. I was unable to emulate these results consistently accommodating for slippage and commission but even so the results and especially the high win-rate and low markdown is pretty impressive and quite respectable.
This strategy uses a combination of 3 open-source public indicators:
AK MACD BB v 1.00 by Algokid
SSL Hybrid by Mihkel00
Volume Strength Finder by Saravanan_Ragavan
This is considered a trend following Strategy. AK MACD BB is being used as the primary short term trend direction indicator with an interesting approach of using Bollinger Bands to define an upper and lower range and upon the MACD going above the upper Bollinger Bands, it's indicative of an up trend, where as if the MACD is below the lower Bollinger Band, it's indicative of a down trend. To eliminate false signals, SSL Hyrbid is used as a trend confirmation filter, confirming and eliminating false signals from the MACD BB. It does this by validating the price action is above the the EMA and the SSL is positive that is a confirmation of an uptrend. When the price action is below the EMA and the SSL is negative, that is an confirmation of a downtrend. To avoid taking trades during ranged markets, VSF Buyer's Strength is used so the buyers/sellers strength and must be above 50% or the trade will not be inititiated.
Trading Rules
5 min candles but other lower time frames even below 5m work quite well too.
Best results can be found by tweaking these 2 input parameters:
Number Of bars to look back to ensure MACD isn't above/below Zero Line
Number Of bars back to look for SSL pullback
Long Entry when these conditions are true
AK MACD BB BB issues a new continuation long signal. A new green circle must appear on the indicator and these circles should not be touching across the zero level while they were previously red
SSL Hybrid price action closes above the EMA and the line is blue color and then creates a pullback . The pullback is confirmed when the color changes from blue to gray or from blue to red.
VSF Buyers strength above 50% at the time the MACD indicator issues a new long signal.
Short Entry when these conditions are true
AK MACD BB issues a new continuation short signal. A new red circle must appear on the indicator and these circles should not be touching across the zero level while they were previously green
SSL Hybrid price action closes below the EMA and the line is red color then it has to create a pullback . The pullback is confirmed when the color changes from red to gray or from red to blue.
VSF Sellers strength above 50% at the time the MACD indicator issues a new short signal.
Stop Loss at EMA Line with TP Target 1.5x the risk
If you know of or have a strategy you want to see myth-busted or just have an idea for one, please feel free to message me.

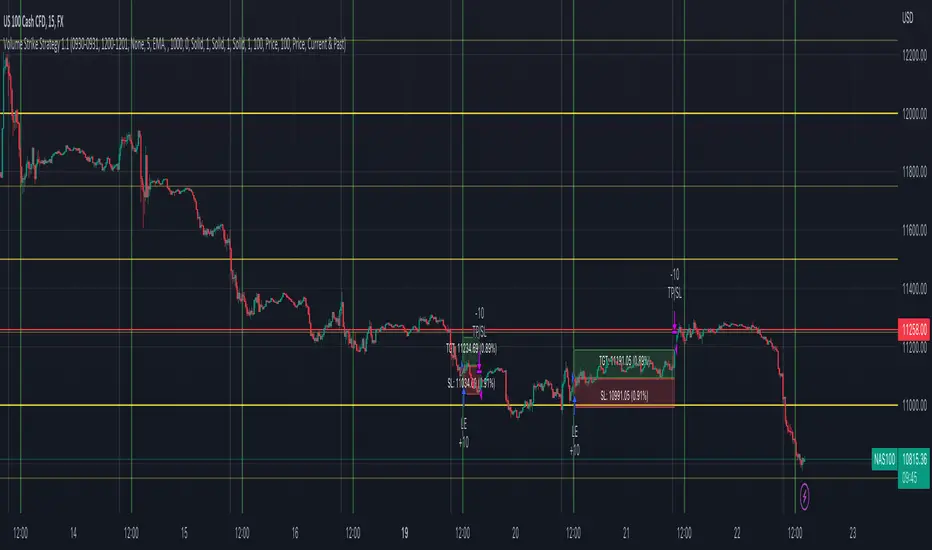
Volume Strike Strategy 1.1Volume Strike
This custom non-repainting indicator is based on an extremely simple strategy we came up with using only the default Volume indicator and key price levels.
We’ll start by explaining the time settings. You will see 4 of them.
The 2 times on the left represent the closed-volume candles at those times.
The 2 times on the right MUST be 1 minute after the times on the left. This is just a technicality based on pine script, so you can ignore the reasoning behind It. Just make sure these times are always 1 minute after the times on the left.
How signals are plotted
-If Volume 1 is higher than Volume 2, we are bullish
-If Volume 1 is lower than Volume 2, we are bearish
It's that simple! We added key price levels to also limit where to display trades. So if you only enable "Quarter Levels", this means trades will only be entered at or around Quarter Levels based on the "Price Offset" you enter.
Rounding Value: This is to help determine where to start marking Whole Levels.
Example: You’re trading USDJPY. The rounding value will be 10. The reasoning for this is that every $10 movement in price is equivalent to 1,000 pips, so a half level is 500 pips, and a quarter level is 250 pips. For a pair such as NAS100, we’ll use a rounding value of 1,000.
Price offset: This is to only show trades X price or less away from the enabled levels.
Example: You're trading NAS100 and enter 100 for the "Price Offset" setting. This means trades will only be displayed within a $100 price of the levels you selected. Keep in mind, if no levels are selected the Price Offset setting is disabled by default, and if Price Offset is 0, the levels are disabled by default, and trades will be displayed regardless if it's around a key price level or not.
Risk Management
We added several options to choose from for determining your SL and TP.
TP: Price, Percent or Next Level
SL: Price or Percent
Next Level: This option is only available for TP. Next level is just how it sounds, the next level in the direction of your trade. Keep in mind, if price is too close to the level, it’ll skip that one and set your TP at the next level.
Inverse Signals: This was added in case you find a losing strategy. You can inverse the trades to potentially have a winning strategy
Position Tool: This will display boxes on the cart with the price of your SL + TP, and the % movement in price of your SL + TP
An example of settings we are using for NAS100 are below:
NAS100. M15
09:30 - 09:31
12:00 - 12:01
MA Filter = 5
Rounding Value = 1,000
Price Offset = 0
Target = 100 price
Stop loss = 100 price
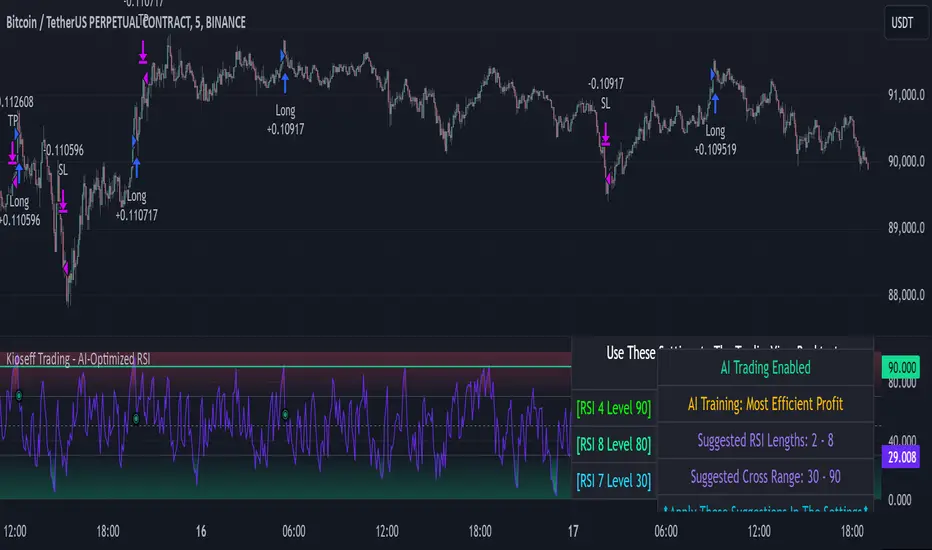
Kioseff Trading - AI-Optimized RSIAI-Optimized RSI
Introducing AI-Optimized RSI: a streamlined solution for traders of any skill level seeking to rapidly test and optimize RSI. Capable of analyzing thousands of strategies, this tool cuts through the complexity to identify the most profitable, reliable, or efficient approaches.
Paired with TradingView's native backtesting capabilities, the AI-Optimized RSI learns from historical performance data. Set up is easy for all skill levels, and it makes fine-tuning trading alerts and RSI straightforward.
Features
Purpose : Uncover optimal RSI settings and entry levels with precision. Say goodbye to random guesses and arbitrary indicator use—this tool provides clear direction based on data.
Target Performance : You set the goal, and AI-RSI seeks it out, whether it's maximizing profits, efficient trading, or achieving the highest win rate.
AI-Powered : With intelligent AI recommendations, the tool dynamically fine-tunes your RSI approach, steering you towards ideal strategy performance.
Rapid Testing : Evaluate thousands of RSI strategies.
Dual Direction : Perfect both long and short RSI strategies with equal finesse.
Deep Insights : Access detailed metrics including profit factor, PnL, win rate, trade counts, and more, all within a comprehensive strategy script.
Instant Alerts : Set alerts and trade.
Full Customization : Test and optimize all RSI settings, including cross levels, profit targets and stop losses.
Simulated Execution : Explore the impact of limit orders and other trade types through simulation.
Integrative Capability : Combine your own custom indicators or others from the TradingView community for a personalized optimization experience.
Flexible Timeframes : Set your optimization and backtesting to any date range.
Key Settings
The image above shows explanations for a list of key settings for the optimizer.
Direction : This setting controls trade direction: Long or Short.
Entry Condition : Define RSI entry: Select whether to trigger trades on RSI crossunders or crossovers.
RSI Lengths Range : Choose the range of RSI periods to test and find the best one.The AI will find the best RSI period for you.
RSI Cross Range : Set the range for RSI levels where crosses trigger trade signals. The AI will find the best level for you.
Combinations : Select how many RSI strategies to compare.
Optimization Type : Choose the goal for optimization and the AI: profit, win rate, or efficiency.
Profit Target : Set your profit target with this setting.
Stop Loss : Decide your maximum allowable loss (stop loss) per trade.
Limit Order : Specify whether to include limit orders in the strategy.
Stop Type : Choose your stop strategy: a fixed stop loss or a trailing stop.
How to: Find the best RSI for trading
It's important to remember that merely having the AI-Optimized RSI on your chart doesn't automatically provide you with the best strategy. You need to follow the AI's guidance through an iterative process to discover the optimal RSI settings and strategy.
1.Starting Your Strategy Setup
Begin by deciding your goals for each trade: your profit target and stop loss. You'll also choose how to manage your stops – whether they stay put (fixed) or move with the price (trailing), and whether you want to exit trades at a specific price (limit orders). Keep the initial settings for RSI lengths and cross ranges at their default to give the tool a broad testing field. The AI's guidance will refine these settings to pinpoint the most effective ones through a process of comprehensive testing.
The image above shows our chart prior to any optimization efforts.
Note: the settings shown above in the key settings section will be used to start our demonstration.
2. Follow AI’s suggestions
Optimization Prompt: After loading your strategy, the indicator will prompt you to change the RSI length range and RSI level range to a better performing range.
Continue changing the RSI length range and RSI level range to match the indicator's suggestions until "Best Found" is displayed!
The image above shows results after we applied the tool’s suggestions. New suggestions have appeared, and we will continue to apply them.
Continue to adjust settings as recommended by the optimizer. If no better options are found, the optimizer will suggest increasing the number of combinations. Repeat this process until the optimizer indicates that the optimal setting has been identified.
Success! With the "Best Found" notification, an optimized RSI is now active. The AI will keep refining the strategy based on ongoing performance, ensuring continuous optimization.
AI Mode
AI Mode incorporates Heuristic-Based Adaptive Learning to fine-tune trading strategies in a continuous manner. This feature consists of two main components:
Heuristic-Based Decision Making: The algorithm evaluates multiple RSI-based trading strategies using specific metrics such as Profit and Loss (PNL), Win Rate, and Most Efficient Profit. These metrics act as heuristics to assist the algorithm in identifying suitable strategies for trade execution.
Online Learning: The algorithm updates the performance evaluations of each strategy based on incoming market data. This enables the system to adapt to current market conditions.
Incorporating both heuristic-based decision-making and online learning, this feature aims to provide a framework for trading strategy optimization.
Settings
AI Mode Aggressiveness:
Description: The "AI Mode Aggressiveness" setting allows you to fine-tune the AI's trading behavior. This setting ranges from “Low” to “High”, with “High” indicating a more assertive trading approach.
Functionality: This feature filters trading strategies based on a proprietary evaluation method. A higher setting narrows down the strategies that the AI will consider, leaning towards more aggressive trading. Conversely, a lower setting allows for a more conservative approach by broadening the pool of potential strategies.
Adaptive Learning Aggressiveness:
Description: When Adaptive Learning is enabled, the "Adaptive Learning Aggressiveness" setting controls how dynamically the AI adapts to market conditions using selected performance metrics.
Functionality: This setting impacts the AI's responsiveness to shifts in strategy performance. By adjusting this setting, you can control how quickly the AI moves away from strategies that may have been historically successful but are currently underperforming, towards strategies that are showing current promise.
Optimization
Trading system optimization is immensely advantageous when executed with prudence.
Technical-oriented, mechanical trading systems work when a valid correlation is methodical to the extent that an objective, precisely-defined ruleset can consistently exploit it. If no such correlation exists, or a technical-oriented system is erroneously designed to exploit an illusory correlation (absent predictive utility), the trading system will fail.
Evaluate results practically and test parameters rigorously after discovery. Simply mining the best-performing parameters and immediately trading them is unlikely a winning strategy. Put as much effort into testing strong-performing parameters and building an accompanying system as you would any other trading strategy. Automated optimization involves curve fitting - it's the responsibility of the trader to validate a replicable sequence or correlation and the trading system that exploits it.
Ücretli komut dosyası
ILDA FINALY_BOT_V1conversionPeriods = input.int(9, minval=1, title="Conversion Line Length")
basePeriods = input.int(26, minval=1, title="Base Line Length")
laggingSpan2Periods = input.int(52, minval=1, title="Leading Span B Length")
displacement = input.int(26, minval=1, title="Lagging Span")
donchian ( len ) => math. avg (ta.lowest( len ), ta.highest( len ))
conversionLine = donchian (conversionPeriods)
baseLine = donchian (basePeriods)
leadLine1 = math. avg (conversionLine, baseLine)
leadLine2 = donchian (laggingSpan2Periods)
plot(conversionLine, color=#2962FF, title="Conversion Line")
plot(baseLine, color=#B71C1C, title="Base Line")
plot(close, offset = -displacement + 1, color=#43A047, title="Lagging Span")
p1 = plot(leadLine1, offset = displacement - 1, color=#A5D6A7,
title="Leading Span A")
p2 = plot(leadLine2, offset = displacement - 1, color=#EF9A9A,
title="Leading Span B")
plot(leadLine1 > leadLine2 ? leadLine1 : leadLine2, offset = displacement - 1, title = "Kumo Cloud Upper Line", display = display.none)
plot(leadLine1 < leadLine2 ? leadLine1 : leadLine2, offset = displacement - 1, title = "Kumo Cloud Lower Line", display = display.none)
fill(p1, p2, color = leadLine1 > leadLine2 ? color. rgb (67, 160, 71, 90) : color. rgb (244, 67, 54, 90))
Sine Wave TheoryThere are some ideas out there that the market is like a collection of quantum events and that it could all be broken down into sine waves. I created this script to put that to the test.
The idea is simple, I tested 3 different factors that could be put into sine wave form.
1.) Bar Change
2.) Volume Average Change
3.) Coin Flip
For the bar change, I simply allow the sine wave to move upwards or downwards if the bars have changed color in their sequence. For example, if there were 3 red bars and 1 green bar, it would not move the sine wave up or down until the green bar appeared.
For the average volume change, it was the same idea, except that the sine wave could only move up or down if the volume had moved up or below the average value of the length given for calculating the average volume.
Finally, the coin flip simply simulates flipping a coin, and allows the sine wave to move one direction or the other once it has a side that is different from the previous chosen side. For example, heads, heads, heads, tails (once it flipped to tails, this would allow it to move a direction).
The sine wave trading theory that I watched claimed that if you know the correct sine wave # (which is how large the peak is, and/or the sine wave count which is how many peaks and valleys occur) that you can successfully predict future trades. Their claims that the reason it does not look like a perfect sine wave for these events is because there is different amounts of trading going on, thus the timing will be slightly off.
I am posting this to disagree with their ideas. For example, if you select to turn on trading for coin flip and turn off bar change, you will see the coin flip did better on the default settings!
It just so happens that any setting will eventually be good, making all the sine wave variations just completely random if you win or not.
I posted this to demonstrate how silly trading sine waves is. The real trick is using cosine and tangent waves... lol j/k
I hope this helps someone avoid this scam concept.
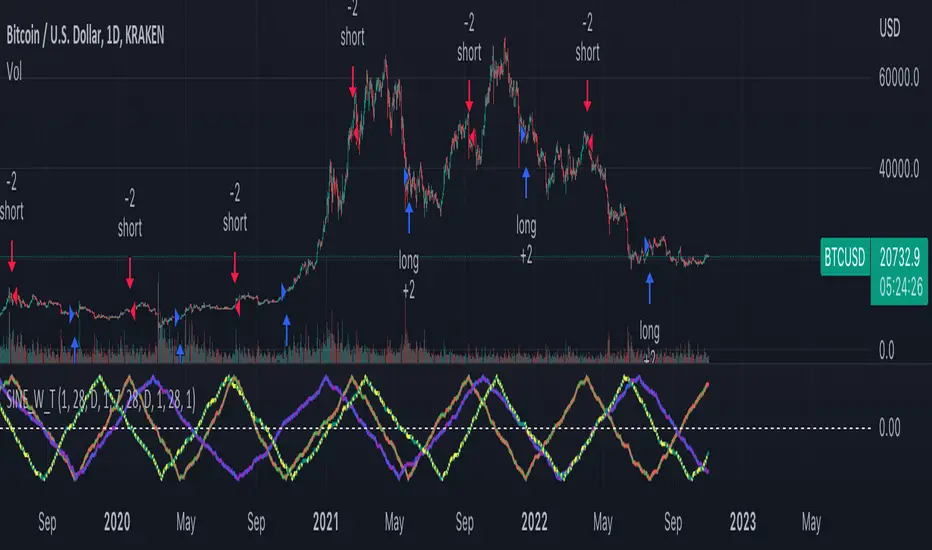
AVPHOW TO USE:
This script is designed to be used on MES primarily. ES works as well but much more capital is needed.
3000 per contract is the recommended amount of initial capital. This number is a combination of the maintenance requirements to hold a contract through the settlement period and an additional amount for any drawdown. 1k maintenance + 2k drawdown buffer. This is a conservative estimate. You may need to change this to fit your individual broker requirements and risk tolerance.
Depending on the signal and how it is filtered the script will sometimes reverse a position or close it. Be mindful of which.
An important note is to not decrease the number of contracts traded once you have upped the position size if you plan to increase as the profit allows.
SIMULATION:
I've included an option to see the compounding and changes in position size according to the HOW TO section. If you have access to "Deep Backtesting" option the results will be clearer. The current limitations of the data provided by TradingView at the 5m resolution limits the deep backtest to just shy of 1 year worth of trades.
The initial number of contracts to be traded can be changed to fit your own account size you wish to trade. You may also wish to see how it builds from just a single contract and building up based off profit alone. In that case leave the initial size as 1.
The buffer size is the amount of capital required to increase the position size. You may wish to increase risk by lowering this number or have a more conservative one by increasing it.
Volume Weighted Average Price STHello everyone.
I am using vwap standard deviation to find trades.
Above standard deviation 1 is buy
Below standard deviation -1 is sell
Price crossunder of vwap after Buy signal is exit for long trade
Price crossover of vwap after Sell signal is exit for short trade
You can set target points(optional)
You can limit number of trades every day.
Background color changes to gray when today range matches to ATR(14) or you can enable label to see the value at last bar
Contact me for more details if you have any queries.
volume rsi strategy by pro trader123this strategy includes volume and rsi and plots a buy signal when rsi is below 30 with high average volume and takes profit when the rsi 14 ema crosses rsi
