-=AutoMoon=- Ganymede [STRATEGY-PE/SL]AutoMoon Ganymede is the most versatile and customizable script on Tradingview.
Compatible with:
-Forex
-Altcoins
-Large Marketcap CryptoCurrencies
We Offer:
-No repaint
-Alerts (compatible with Autoview or Gunbot)
-Backtesting Script and Alert script
Purchase here:
gunbot.store
Hacim

-=AutoMoon=- Ganymede [STRATEGY-PE]AutoMoon Ganymede is the most versatile and customizable script on Tradingview.
Compatible with:
-Forex
-Altcoins
-Large Marketcap CryptoCurrencies
We Offer:
-No repaint
-Alerts (compatible with Autoview or Gunbot)
-Backtesting Script and Alert script
Purchase here:
gunbot.store

Strength of MovementCRYPTO TRADERS PRO
This script is designed to generate a comparison of price action against historical movements. To complete this, the following are calculated:
Average price actions close vs previous close;
A baseline of price actions over x periods;
A baseline of volume over x periods; and
A percentile movement for volume when compared to it's baseline
From these calculations; we can infer a ratio for the below moves:
Price is increasing w/ increasing volume
Price is increasing w/ decreasing volume
Price is decreasing w/ increasing volume
Price is decreasing w/ decreasing volume
From here; we can establish a pattern and identify momentum changes and 0-cross trade opportunities.
By factoring in a STOP LOSS factor; as well as a buffer to mitigate false crosses; historic tests can be fined tuned for relative cryptocurrencies. For example; BTCUSD - with a buffer of '2' - provides a test result of 40% returns with a 0.812 Sharpe Ratio.

LFT (Low Frequency Trading) StrategyLFT (Low Frequency Trading) Strategy - For Brokers with HIGH FEES.
Hi,
This is a LFT Strategy made for brokers with high fees per trade. It minimizes the amount of signals given by using an algorithm which only enters when the market has satisfied 15 different indications, and a few custom requirements such as VOD. (Volatility on Daily)
Also you should set a 100 point SL.
DO NOT USE THIS IF THE BROKER YOU ARE USING DOES NOT HAVE HIGH FEES - THIS STRATEGY SHOULD ONLY BE USED FOR LARGE SWING TRADING, NOT SCALPING. YOU WILL NOT RECEIVE SMALL SIGNALS, ONLY MAJOR MOVEMENTS.
I will make modifications to the strategy and publish a version which can be used for scalping, only if there is demand.
To get this strategy just comment below and I will grant you access for a while until the next large update.
Use at your own risk, you are increasing your chances at losing money by not following my instructions. USE ONLY FOR HIGH FEE BROKERS.

VWMA + SMA BBollinger + RSI Strategy (ChartArt) mod by BiO618This is a script I remade from the original ChartArt's "CA_RSI_Bolling_Strat".
I added a VWMA following the SMA basis curve.
BBand was made with the SMA curve, +2DS.
The point of adding VWMA to the script is to get a fast correlation between price change and volume change.
How to interpret it:
Since 3-Intervals-VWMA = (P1*V1 + P2*V2 + P3*V3) / (V1+V2+V3)
As the volume grows, VWMA get smaller.
If the price goes to the upper band, and the VWMA follows it, Price grew more than Volume, and a correction would happen soon.
If the price goes to the lower band, and the VWMA follows it, Price dipped with a lot of Volume, and a continuation of trend would be expected.
If the price goes to the upper band, and the VWMA stays close to SMA, Price grew with a correspondient Volume, and the continuation of trend would be expected.
If the price goes to the lower band, and the VWMA stays close to SMA, Price dipped with low Volume, a correction would happen soon.
Remember that NO INDICATOR is flawless, support your interpretation with other indicators like RSI and MACD.
Hope you enjoy it!
φ!


TTS Patterns Strategy [by Ken]This strategy tester backtest Turtle Soup Pattern which user can vary these parameter
1. Max Candle
2. Reward
3. Pending Bar

Inigo Montoya's QuestEXPERIMENTAL UNFINISHED VERSION DRAFT V001
AT YOUR OWN RISK
NO WARRANTY
NO CLAIMS


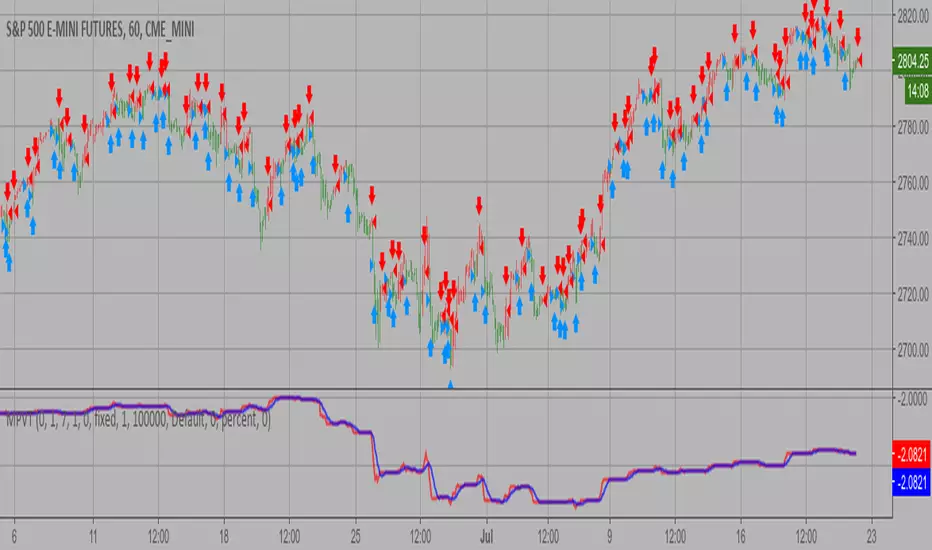
Modified Price-Volume Trend Backtest The related article is copyrighted material from
Stocks & Commodities.
Strategy by HPotter.
You can change long to short in the Input Settings
WARNING:
- For purpose educate only
- This script to change bars colors.
NGRN MACD-X & RSI v4 STRATEGYMACD-X, RSI & Volume Indicator Strategy - Version 4
Overview
This strategy and it's associated study were modeled after the famous Philakone described algorithms on his now defunct instructional video series.
This indicator allows for full customisation of parameters and interaction between three indicators that allow users to shape their trading methods to their desired goals. This associated strategy also allows users to backtest the study alerts script and find the best settings towards that end.
MACD + RSI + VOLUME - are of the most powerful and widely usded indicators, MACD/Histogram crosses, coupled with RSI & Volume increases/decreases will detects areas of deeply oversold / overbought and buys/sells on the reversal
Features
Full customisation - All parameters are open for customising to allow the trader to build their own strategy and adapt from market to market.
Clean/Simple UI - Facilitating ease of use.
Enable Buying OR Selling, - or have them both active at the same time.
Toggle off and on ALTERNATING Buy and Sell feature (pyramiding) - to allow for consecutive DCA style buys or SCALING out of an entry (partial sell).
Customizable Stop-Loss plot - to enable users to create a STOP-LOSS alert option or other alert(s) based on the plot location.
Toggle Auto Stop-Loss sell option - to enable users choose whether or not to automatically issue a sell signal when close crosses stop loss plot, or choose to toggle off if not profitable.
Customizable Take-Profit plot - to enable users to create a TAKE-PROFIT alert option or other alert(s) based on the plot location.
Study and associated Strategy - to use the TradingView ‘Strategy Tester’ back-testing features to find the best alert settings for specific coins in bear, bull and sideways markets.
Changes Version 4
Improved STOP-LOSS plot draw.
Added the option to automatically sell when stop-loss cross triggered or have the option disabled, in the event a better profit can be achieved.
Added new TAKE-PROFIT plot (aqua line) to visually guide users where to place the TAKE-PROFIT parameter as well as give users options to create alerts based on the TAKE-PROFIT plot.
Access
Full Access is 0.1 ETH , one time fee for LIFETIME access to the STUDY indicator, STRATEGY and future updates as well as support and SETTINGS for various markets on the Binance Exchange.
Settings
SCREENSHOT LINKS:
BUY SETTINGS: prntscr.com
SELL SETTINGS: prntscr.com

MACD + RSI + EMA + SMA + Ichimoku + overbought + buy, sell +Doji// MACD + EMA 200 *** buy and sell strategy (RSI, EMA, SMA) *** Doji Harami *** overbought and oversold *** trend direction *** divergence *** Ichimoku
Use this script in time 1h
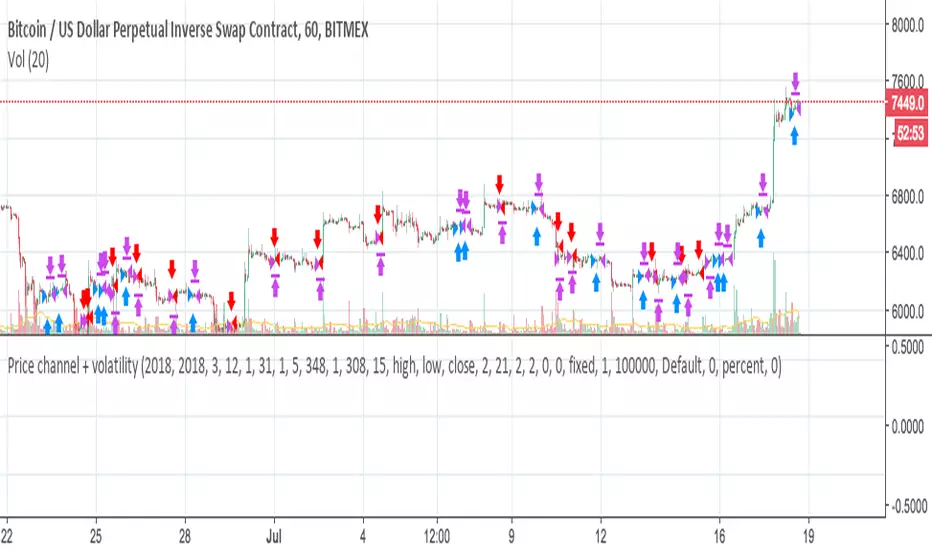
Price channel + volatilityCombination with price channel + volatility. Good approach to robot and hand trading. The best time frame 1H leverage up to 7. I use the script for trading with own robot development. Only for bitmex XBT/USD and rebate will be as bonus 0.025)


Strategy testingCombining concept of Bollinger Band and volume analysis.
it looks like strategy direction should be long only.


ChrixBBThis is a special flavor of Bollinger Bands strategy, with RSI , MFI and Stochastic checks. All the indicators act as oscillators, except for Stochastic , that can also be used with crossover/crossunder triggers. Contact me for access.

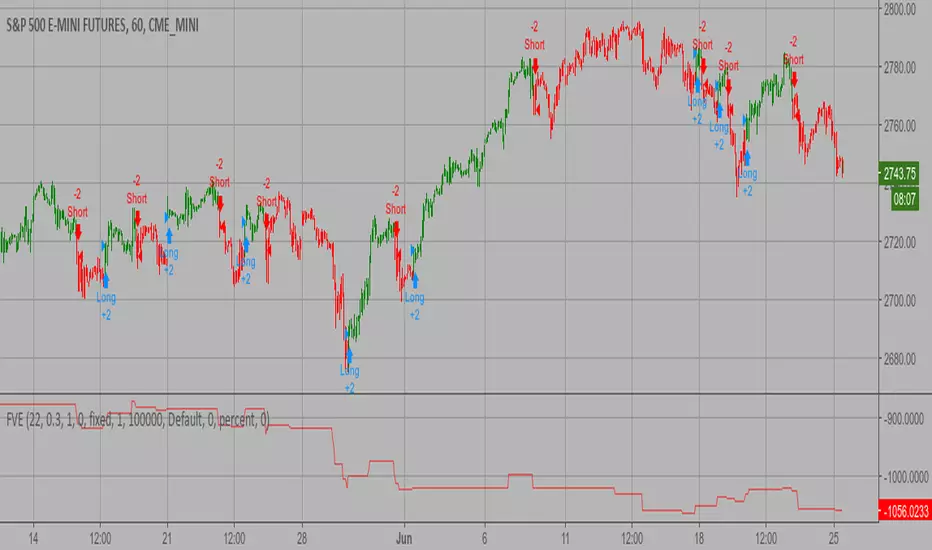
Finite Volume Elements (FVE) Backtest The FVE is a pure volume indicator. Unlike most of the other indicators
(except OBV), price change doesn?t come into the equation for the FVE (price
is not multiplied by volume), but is only used to determine whether money is
flowing in or out of the stock. This is contrary to the current trend in the
design of modern money flow indicators. The author decided against a price-volume
indicator for the following reasons:
- A pure volume indicator has more power to contradict.
- The number of buyers or sellers (which is assessed by volume) will be the same,
regardless of the price fluctuation.
- Price-volume indicators tend to spike excessively at breakouts or breakdowns.
You can change long to short in the Input Settings
WARNING:
- For purpose educate only
- This script to change bars colors.