Breton Composite BTC Volume -turningpoint -strategyComposite BTCUSD Volume strategy compiled from 9 different exchanges, attempting to isolate turning points by trading on volume spikes and bag holding bars
Hacim

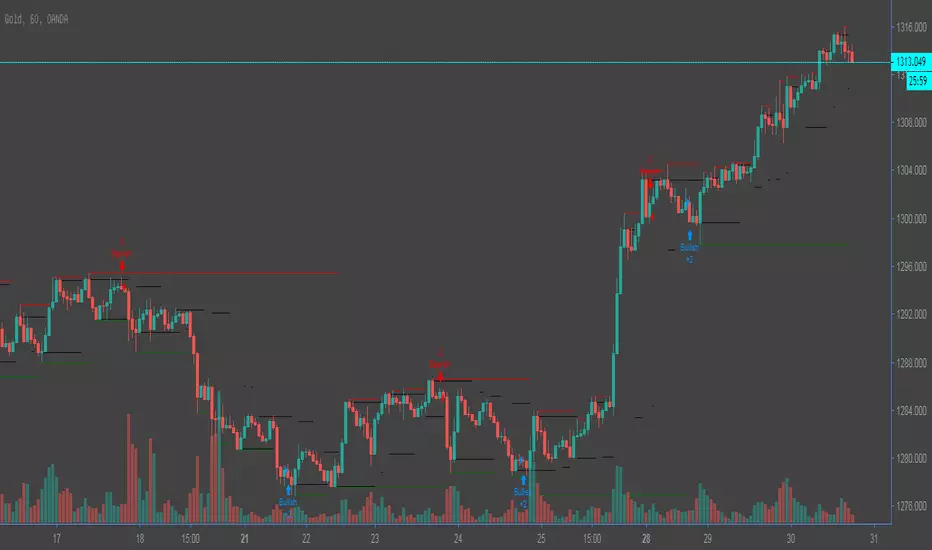
Support-Resistance Cloud (S/RC) for FX by Tirano안녕하세요. 다이너스티 팀의 안드레아 입니다.
기존에 티라노라는 이름으로 활동했습니다.
Support-Resistance Cloud 소개
1. 한번이라도 지지 혹은 저항이 작용한 구간을 라인으로 표현합니다. 한번 맞고 튕긴 구간은 되돌림을 통한 리테스트가 있기 마련이고, 다시한번 튕길 가능성이 높습니다.
- 따라서 되돌림이 일어났을때 선으로 표현되는 구간에서 진입하면 수익으로 연계할 확률이 높습니다.
- 매물대를 표현한 PoC 라인이 보조적으로 사용됩니다. (피보나치 상으로 의미있는 구간에 표현됩니다)
- 박스권 상황에 유리합니다.
2. 전체적인 흐름을 구름과 채널의 형태로 표현합니다.
- 구름이 서서히 내려오며 하방 추세라면 매수신호에서 long으로 진입하기 보다는, 구름에 닿았을때 short으로 진입하는게 좋습니다.
- 전체적인 흐름(추세)를 거스르지 않고 매매할 수 있습니다.
- 한 방향으로 진행되는 one way 상황에 유리합니다.
기타 문의 사항은 댓글 남겨주시면 감사하겠습니다.
Hi. this is Andreas of the Dynasty team.
Introduction to Support-Resistance Cloud
1. The lines where the support or resistance acts once are expressed by lines. Once hit and bounced, there is a retest through bounce, and it is likely to bounce again.
- Therefore, if you enter from the section represented by the line when the recurrence occurs, the probability of linking with the profit is high.
- The PoC line representing the residential area is supplementary. (Expressed in Fibonacci sensible section)
- It is advantageous in the box case situation.
2. Express the overall flow in the form of clouds and channels.
- If the cloud is going down slowly, it is better to go into the short when touching the cloud, rather than going into long in the buy signal.
- You can trade without overtaking the whole flow (trend).
- It is advantageous for one way situation that goes in one direction.
If you have any other questions, please leave a comment.

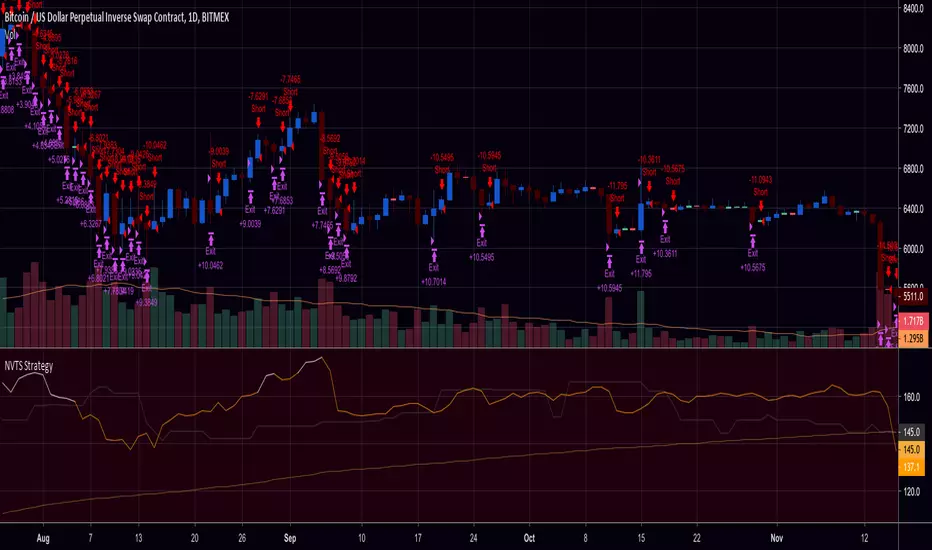
NVT Signal with RMA and Thresholds (Strategy / Backtest)This is the strategy w/ backtester and trailing-stop / stop-loss for kishin's NVT alerts
Icarus v2 [STRATEGY] - by @cryptomrdavis -This is the strategy version from the Icarus v2 indicator
Happy trading
+++ use this tool on your own risk. i'm not responsible for your loses. DYOR +++
____________________________________________________________________________
BTC: 1GVRDK3HHr9CKM5SF2CGpCNXFuavB3L4j9
ETH: 0x7b825fa752b9926D3E8397cDb1d9E5473D074646
XLM: GAXUQJSW55C7MAC4GI26NZUGIKSHFDVFRFKZCXPLMPY4HCADSDT55XK6
BCH: qz57n04ud6mn42u00aymqkku8tfh0lk4jv9c28mjvv
tippin.me
____________________________________________________________________________


SKEW PRO BacktestHello Fellow Traders!
-------------------------------------------
This is the newest addition to Gnome Alerts PRO!
This Bot Script works on all Crypto, Leverage, Forex, & Traditional Exchanges.
FEATURES
------------------------
*Autoview Ready*
- Easy to Use
- Backtesting Included
- Stop Loss
More info on how gain access in my profile!

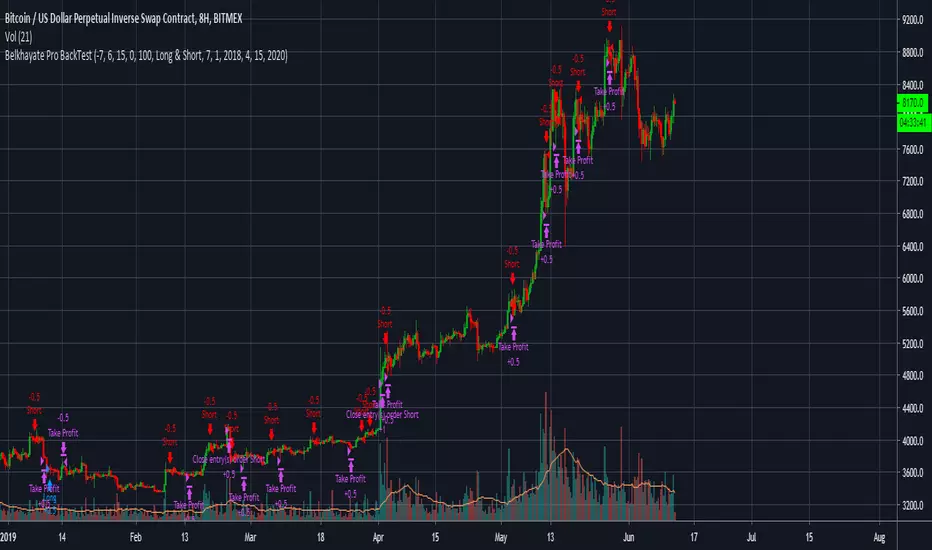
Belkhayate Pro BackTestHello Fellow Traders!
-------------------------------------------
This is the newest addition to Gnome Alerts PRO!
This Bot Script works on all Crypto, Leverage, Forex, & Traditional Exchanges.
FEATURES
------------------------
*Autoview Ready*
- Easy to Use
- Backtesting Included |
-Take Profit
- Stop Loss
Learn more by visiting my bio.


The People's Indicator Swing TradeThe People's Indicator Swing Trade is the Longer Term Version of the People's Indicator. It will allow you to spot patterns.

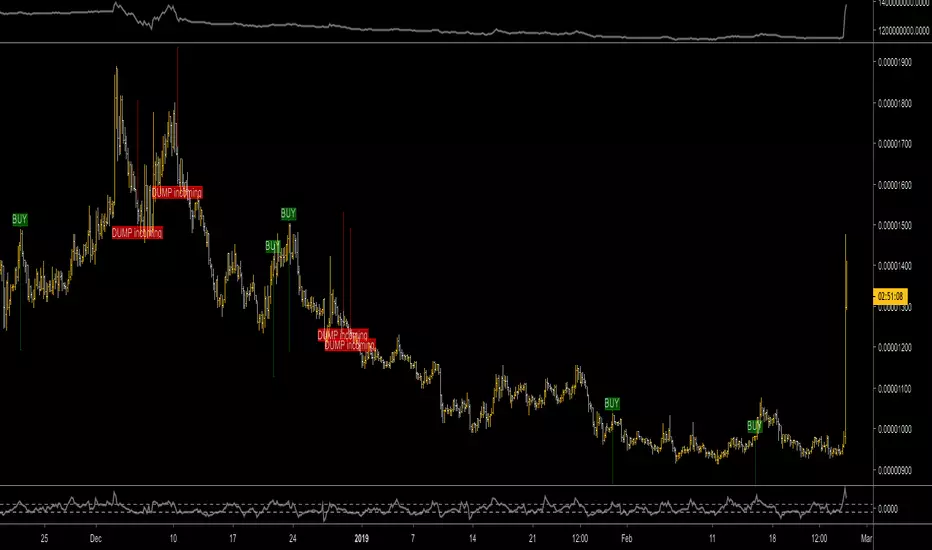
Pump/Dump Hunter 15M+ Strategy// The strategy is based on the pumps and dumps, as well as a sudden change in market volumes

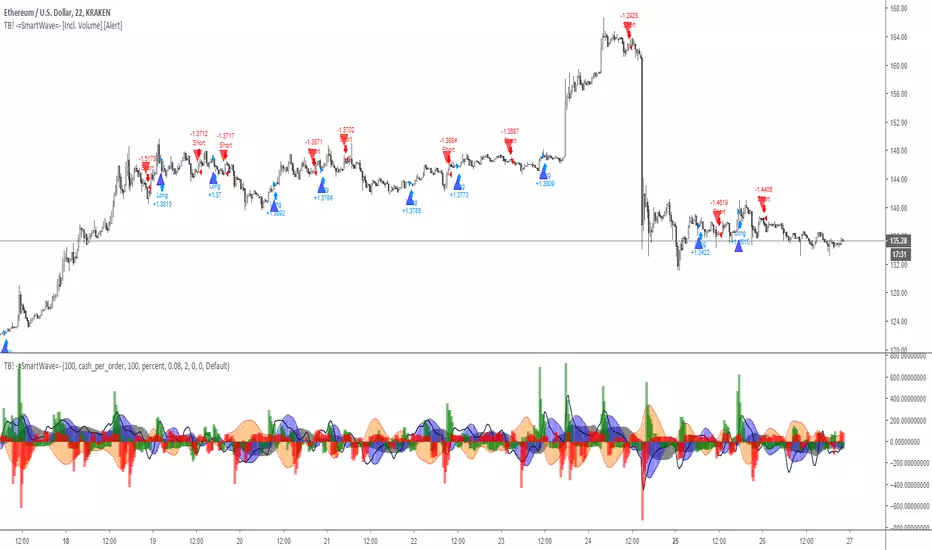
TB! -=SmartWave=- [Incl. Volume]My Precious SmartWave Formula Ready for Action.
What does it do?
It monitors buys vs sells, since the market moves because people buy n sell,i kinda thought it would be important.
It also monitors price action in relation to that volume to determine if a lot of volume is gobbled up by (over-) leveraged positions.
It provides a good insight when to take some action.
NB.
The drawback and the losses it makes can be reduced a lot with a 2.5% stoploss and fib based TP's, i just did not care to have the script deal with those,

TREND PROTECTTrading system developed for protecting grid trading or gamma short positions or for taking advantage of a rise of the BTC protecting from crashes.
It is in forward test without changing the parameters since April 2018.

On Balance Volume w MA StratI couldn't find an OBV MA strategy, so I modified one into what i wanted. Now for all to enjoy.


VB Strategy ProVB Strategy Pro based on the vb indicator.
with buy zone and sell zone, you can trade easy.
this indicator used volume and Bollinger Bands.
VB indicator Pro