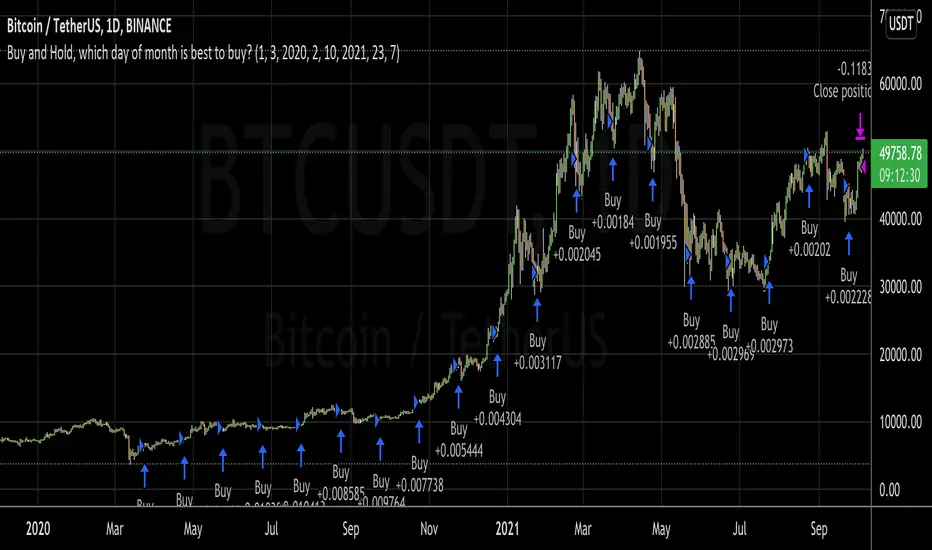
Buy and Hold, which day of month is best to buy?I wanted to invest a certain fiat amount each month and was wondering which day would be best to do this.
So, with this script, you can set your entry day. On the last day of the date range, it will close all positions. You can then see what amount of the asset you have accumulated to date. If you try all the days of the month and see when you can sell the most amount of the asset, you've found the best buy date of the month for that asset.
A second option is to set an exit day. This is good for a strategy where you would go long (buy) on the entry date and short (sell) on the exit day.
This was inspired by people running out of money by the end of the month and selling their asset, which could make the price fall. Then when they receive the wages by the 5th or so, they would rebuy, causing the price to go up.
Hacim
TemaVWAPRSI StrategyExchange: Kraken
Timeframe: 5m
Pair: ETH/USD
If you use this for any other exchange or pair, you'll have to tweak the settings, most importantly are the trailing stop ticks. This strategy is currently in what I would call beta mode. It uses the volume weighted average price indicator, rate of change, two triple exponential moving averages and the relative strength index to find buy and sell signals.

Algo Trading Strategy (Nifty & BankNifty)What is Algo Trading Strategy ( Nifty & Bank Nifty )?
There are many 9 to 5 working professionals who have some spare money to invest each month but they can not do active trading because they are busy with their full time job.
So they wish to have an automated system which could take and close trades for them with a proven back-tested strategy, proper money management, ability to trade within particular timings, pre-defined maximum loss they can bear and so on.
To cater needs of such type of traders, we created from scratch; and published an 'AutoTrading Algo (Nifty & Bank Nifty) in Sep 2021. (The link is given below, please read on).
Many people who want to try this AutoTrading Algo want us to share stats of this algo with them.
In order to fulfil this demand, we have converted that "Algo Trading" Study into a Strategy whose description you are reading right now.
For all other queries related to how our "Algo Trading (Nifty & Bank Nifty)" works, what are its limitations, benefits and other features, please read the description of our main 'Algo Trading (Bank Nifty & Nifty )' study which is available at following link:
Note:
1. in order to test this strategy on longer time period, you must have a Premium TradingView account.
2. If you have premium TradingView account, the stats you generate will exactly match with our stats which we keep sharing in our channel.
3. To Enable Auto-Trading, You will need to connect this Algo with your broker's trading platform through 3rd party platforms. We will guide you on how to do this, when you contact us.

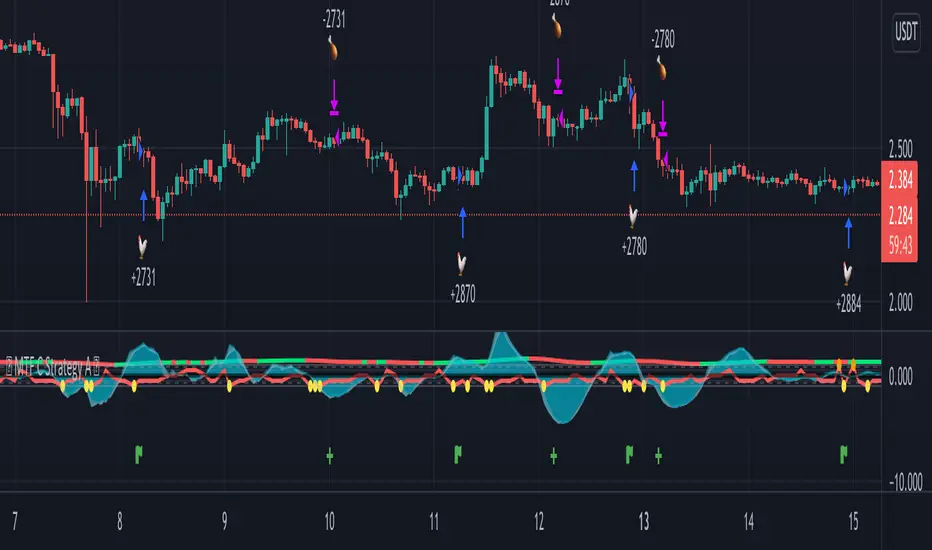
MTF C Strategy A
The Pearson coefficient is a type of correlation coefficient that represents the relationship between two variables that are measured on the same interval or ratio scale. It's a measure of the strength of the association between two continuous variables.
This script allows you to choose one or more sources as a curve, if several sources are chosen, their average is taken into account in an EMA or SMA of your choice. It is possible to have the average of all the curves and to add one or more other curves for an influence on the calculated average.
Then, on the basis of this curve a correlation is calculated from 8 time ranges which give 4 curves, it is on this basis that the conditions of entries in the trade and / or exits are based with the possibility of adding an RSI condition.
For some entries, it is possible to try the symmetrically opposite condition, ie the one that is used in shorts.
To make entry short work, you must activate an exit short option.
However, exit conditions are more flexible than entry conditions because they allow the inverse entry condition used and / or to use statistical indices such as CCI / RSI / ROC / BB as exit condition independently or combined way.
It should be noted that if a condition among those chosen is executed substantially first, it will predominate over the others (same for long / short entries).
In addition, it is possible to choose a stop loss as an exit condition, however, it is not possible to combine the other exit conditions with the stoploss at the same time. Credits to adolgov for the base of the stoploss script part.
You can combine several curves, just as it is possible to combine several types of trade entries / exits.
The strategy uses 100% of equity, it has not been configured in such a way that there is an order pyramid and the closings are done on a total equity basis.
You can configure a daily session interval, a limit of the number of daily trades, a limit of drawdown.
You can add comments for each execution of an opening / closing order respectively to the direction (long or short).
Each step of the configuration has a tip, a button that must be hovered over in order to have the information relating to the configuration.
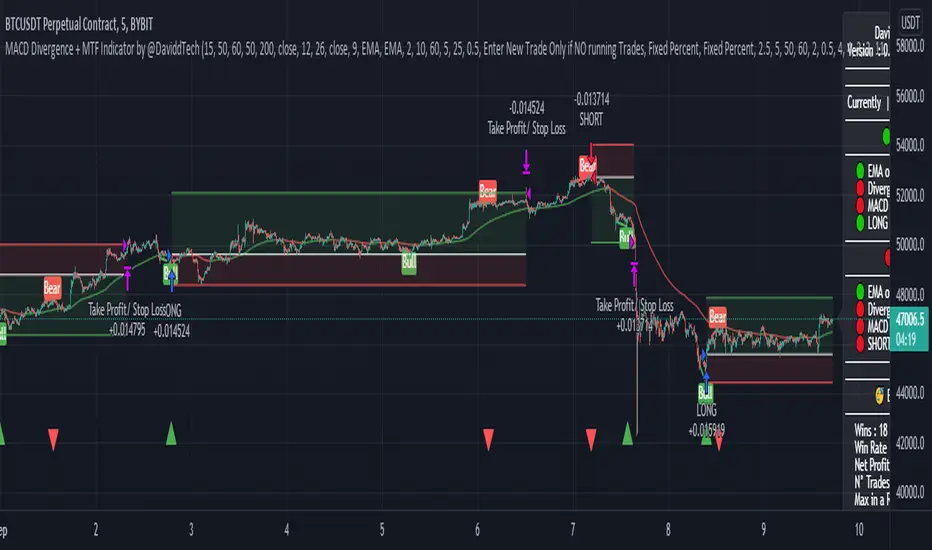
MACD Divergence + MTF EMA Reversal by @DaviddTechMACD Divergence + MTF Indicator / EMA by @DaviddTech
Long :
* Find Divergence in the MACD line
* Multi Time Frame EMA 50 15 minutes above Multi Time Frame EMA 50 60 minutes
* MACD and Signal line are below the 0 line
* MACD crosses above the Signal line
Short :
* Find Divergence in the MACD line
* Multi Time Frame EMA 50 15 minutes below Multi Time Frame EMA 50 60 minutes
* MACD and Signal line are above the 0 line
* MACD crosses below the Signal line
EMA usages instead.
* I found that as a strategy this could work better with the 200 EMA line.
* Trends reversals also gave good results.
Trend Reversals :
* Price is below EMA 200 - Take LONG on divergence.
* Price is above EMA 200 - Take SHORT on divergence.
** You may need to turn off MTF ema when using the Simple EMA 200
WARNING:
- For purpose educate only - My mission is to debunk fake strategies with code to find THE ONE.
- Plots EMAs and other values on chart.
- This script to change bars colors.
SQZ Multiframe StrategyThis is a first attempt to automate what my current strategy when trading is.
It uses 2 timeframes: the one you are currently using to see the chart and an "anchor trend" which is a higher order frame.
Supported timeframes are: 1m, 5m, 15m, 30m, 1H, 4H, 1D, 1W
The Strategy relies on two indicators:
Squeeze Momentum Indicator
CMF
How does it works?
It looks for a moment when the following conditions are met.
For Long:
Positive directionality in SQZM monitor in anchor timeframe
Positive directionality in SQZM monitor in current timeframe
Recent minimum in CMF
For Short:
Negative directionality in SQZM monitor in anchor timeframe
Negative directionality in SQZM monitor in current timeframe
Recent maximum in CMF
After a BUY or SELL order is executed the plot will start showing two lines: A TP line, and a SL line.
The TP and SL move dynamically based on a greedy algorithm based on 3 input parameters.
Min Profit to Start Moving SL (%): Sets an initial target for the trade.
Maximum Possible of SL (%): This is the maximum amount possible for SL. If volatility is not too high, a shorter SL will be chosen based on Kaufman's Stops method
Take profit factor: Is how much portion of the target I am taking as profit once the target is reached
Example for 5% Min profit:
When the first target is reached (+5%), the SL will be updated to 2.5% over the enter price.
When the second target is reached (+10%), the SL will be updated to 5% over the enter price.
Note: The strategy might abandon the position prematurely if a contrary signal is received while the trade is opened, and will change direction.
The Strategy has been backtested mostly for crypto. It might be good for stocks too, but the parameters mentioned might need some adjustments since price moves at a different rate.
Recommended timeframe is 4H for BTC , and 30min/1H for alts.
Comments and ideas are more than welcome!

Full Swing Gold Vwap Macd SMO StrategyThis is a full strategy designed for gold market using 12h timeframe chart.
Its components are:
VWAP monthly
SMO oscillator
MACD histogram
Rules for entry:
For long: when enter when close of the candle is above vwap monthly, current histogram is higher than the previous one and SMO oscillator is above 0
For long: when enter when close of the candle is below vwap monthly, current histogram is lower than the previous one and SMO oscillator is below 0
Rules for exit:
We exit the trade if we get a reverse condition.
We also exit the trade based on a risk management system, both for SL and TP using % movements.
If you have any questions let me know !

Long TermThe Strategy is to buy based on Stan which is long term strategy on stocks. This works on 30WEEK And RSI indicator which helps to understand when to enter stock and when not to.
Additionally due to fast moving trades, added logic of crossover of close price above 50DMA

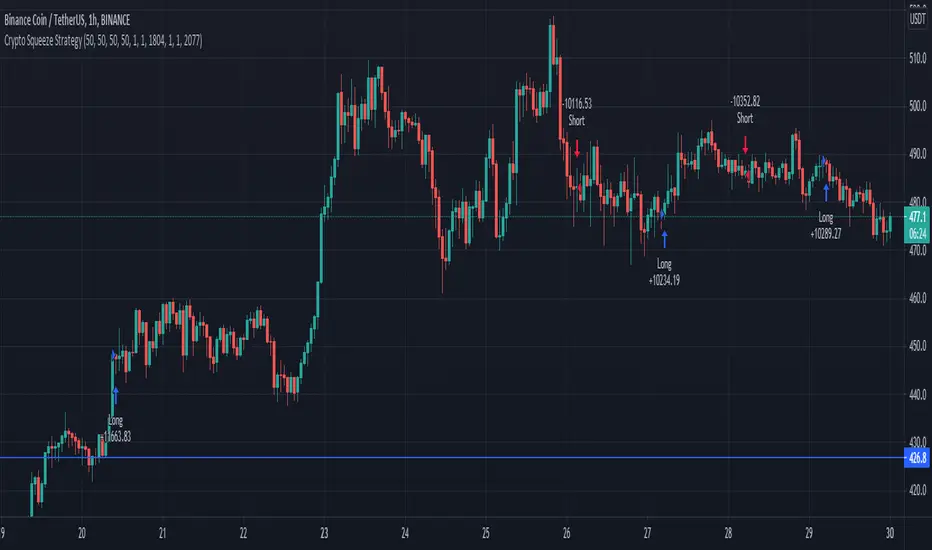
Crypto Squeeze StrategyThis strategy was inspired by two famous Trading View contributors. Shout out to Lazy Bear and Crypto Face!
The strategy includes a similar replication of the blue wave, and MFI indicator. The point of the strategy is to buy when the blue wave crosses up the zero value, and the MFI is greater than zero value. This indicates that there is strong bullish momentum and money flowing into the market.
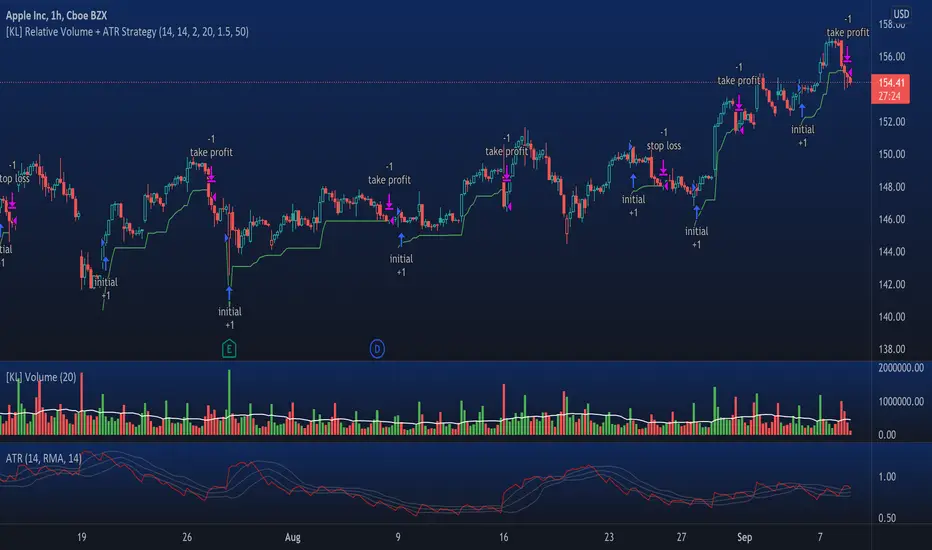
[KL] Relative Volume + ATR StrategyThis strategy will enter into long position when (a) current volume is above the average volume, and when (b) volatility of prices (based on ATR) is relatively low.
Backtested on hourly timeframes, win rates range between 35% to 50% on stocks with positive drifts (i.e. tendency to move upwards). Default setups are as follows:
- Average volume is computed using simple moving average (sma) of 14 periods. By default, 1.4x ratio seems to work well on most large cap stocks. If it's too high, then amount of potential points for entry will decrease. But if it's too low, then this indicator becomes meaningless.
- ATR (for determining volatility), look back period is 14 (following conventions). I have noticed that the profits could change drastically when changed to different values for each individually security. Feel free to experiment around with this parameter.
Other information: This strategy is based off of one of my previous scripts; a script called "Relatively Volume Strategy". The objective of this new script is to simplify the process of determining periods of low volatility. In this new script, we assume prices are consolidating when current ATR is within its moving average value by +/- one standard deviation.
Swing VWAP Weekly Stock and Crypto StrategyThis is a simple yet very efficient swing strategy designed for crypto and stock market, using big timeframes.
Its main component is VWAP weekly, so for best scenarios its better to use big timeframes such as 8h+.
The rules for entry are simple:
If our close if above vwap weekly we enter long .
If our close is below vwap weekly we enter short.
We exit from the trade, when a reverse condition than the entry one is triggered.
Because this strategy has no risk management inside, I recommend to be careful with it.
If you have any questions, let me know

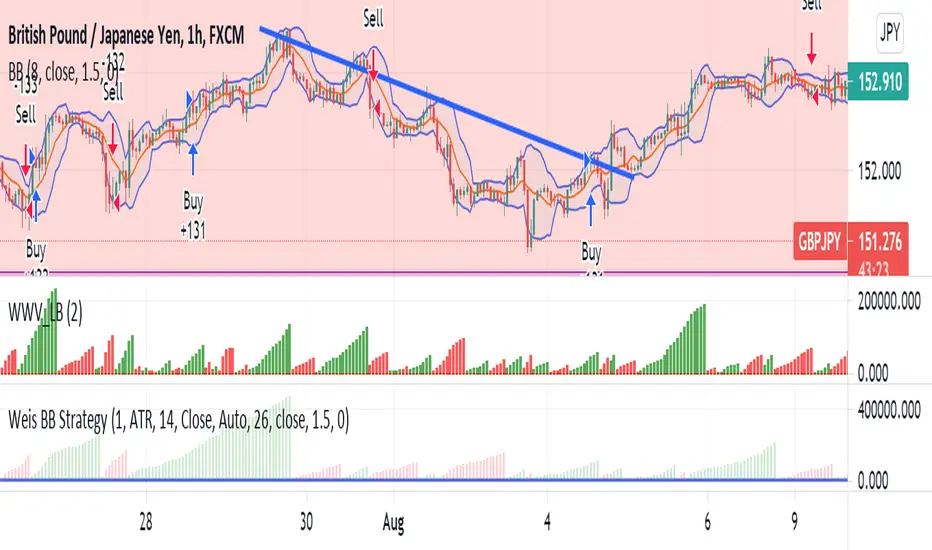
Weis BB StrategyThis is a strategy based on Weis Wave & EMA. Weis Wave Volume is used to determine the overall trend and Bollinger Band to determine the Price breaking out from resistance zones.
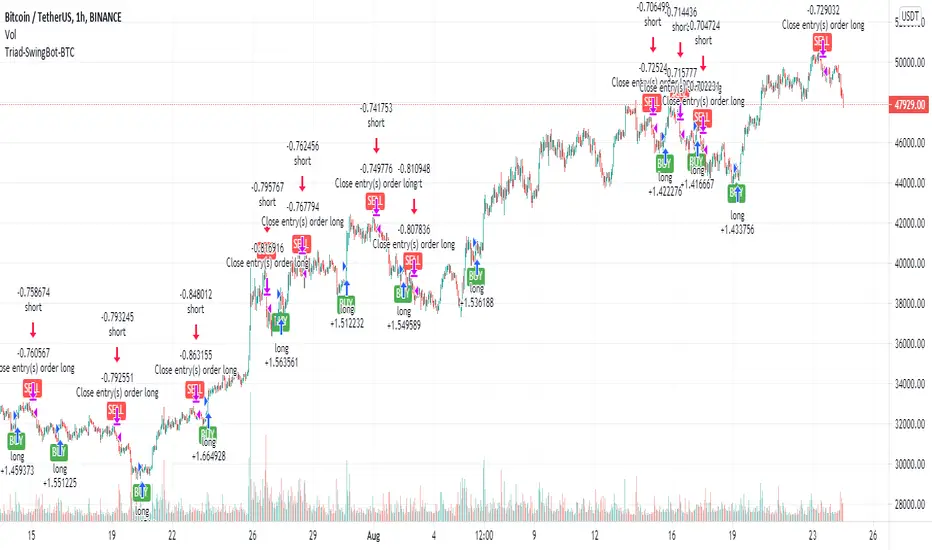
Triad-SwingBot-BTCStrategy tuned for BitCoin . The indicator version of this uses alerts to start a long or short DCA 3comma bot. Preferably running on futures exchange so I can go long or short and use 5x margin. Alerts also take profit/close position when trend changes.
KYC crackdown is leaving me limited places I can run these now.
Use this on Binance BTC /USDT 1HR chart. Binance seems to give the best data even when trading from other exchanges.
There are various versions of these I might release tuned to each cryptocurrency. I have about 20 different coins that were profitable. Each work best with different settings.
This strategy uses a variety of factors to determine long and short entry including:
-Price is starting to trend up (long) or down (short)
-Price closing above/beneath specified EMA or SMA
-Price within RSI bounds for valid entry
-MACD histogram is positive(long) or negative (short)
-Volume surge indicating viable entry
If there's decent interest in the indicator version of this with alerts to send long/short signals to bots, I'll work out an invite-only system.
Ultimate MACD Strategy [PrismBot] [Lite]Included in this Ultimate MACD Lite Strategy:
✔️ Tweak a multitude of specific settings (MA lengths, R:R, SL distance etc)
✔️ Enable advanced setup filters
✔️ Use money management and risk calculations
✔️ Draw trade info directly to chart (eg. SL size in percent, win rate etc)
✔️ Use various filters (eg. time filter, date filter, MA slope angle etc)
✔️ Manage risk per position when auto-trading forex through AutoView
✔️ Choose from various alert conditions!
✔️ Sync to any bot or algorithmic trading system
Some details about this strategy:
LONG SIGNAL
When the MACD is below the zero line of the histogram, close is above the 200EMA, and the MACD line crosses above the signal line, longs are taken
SHORT SIGNAL
When the MACD is above the zero line of the histogram, close is below the 200EMA, and the MACD line crosses below the signal line, shorts are taken
A couple of options are given for how to calculator stop losses.
The Take profit is calculated by the risk of the stop loss. So a 1.5 take profit target is 1.5 times the stop loss added to the entry price.
There is also an option to filter out trades by the histogram deviation. This prevents crossovers that are too close to the histogram from being taken.
Please note I used the code for the PPO instead of the traditional MACD to make calculating these percentage deviations more consistent across multiple asset types.
You can easily enable and disable strategies using the checkbox.
This strategy incorporates a risk to reward system where the user can select between ATR and Percent based stop losses and take profit targets. This means that the user has much better control over money management when utilizing this strategy and it doesn't require you to babysit the strategy to ensure it's entering and existing strategies in an ideal place.
You can also enter custom messages for alerts for use with bots (set alerts to "alert() function calls only")

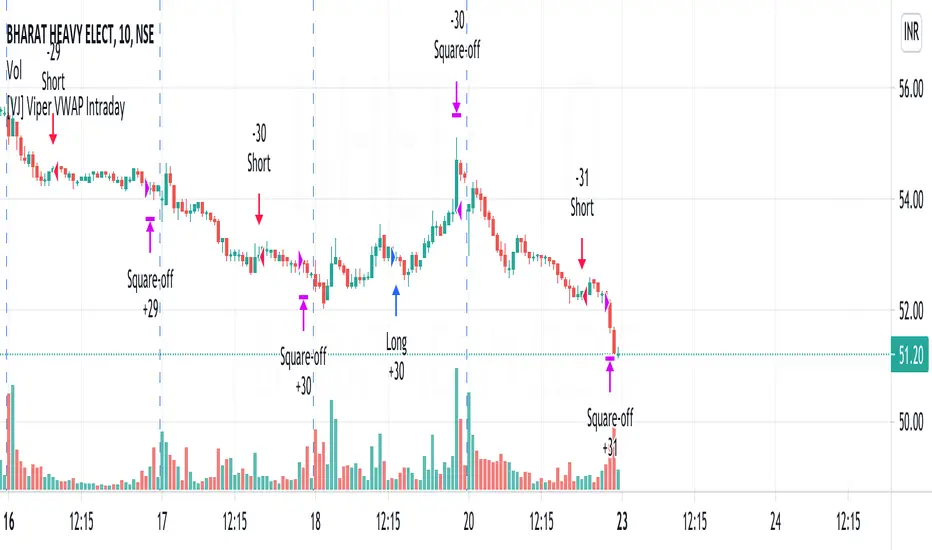
[VJ] Viper VWAP IntradayHello Traders, this is a simple intraday strategy involving the ever reliable VWAP and a chop index to add twist to the traditional style . You can modify the values on the stock and see what are your best picks. Comment below if you found something with good returns
Strategy: VWAP based strategy but uses an additional powerful indicator Chop index to help us stay out of false trades.
Indicators used :
VWAP identifies the true average price of a stock by factoring the volume of transactions at a specific price point and not based on the closing price. VWAP can add more value than your standard 10, 50, or 200 moving average indicators because VWAP reacts to price movements based on the volume during a given period.
The Choppiness Index is designed to determine whether the market is choppy or trading sideways, or not choppy and trading within a trend in either direction. Using a scale from 1 - 100, the market is considered to be choppy as values near 100 (over 61.80) and trending when values are lower than 38.20)
Buying/Selling typically happens at VWAP Breakouts which is then validated with extreme CI to ascertain the entries
Aggressive trade stop can be employed by using the % for long and shorts in the strategy.
Usage & Best setting :
Choose a good volatile stock and a time frame - 10m.
CI Index : 14
Trend Factor - anything below 38.2 is considered in trend, you can experiment from 50
There is stop loss and take profit that can be used to optimise your trade
The template also includes daily square off based on your time.
[VJ] Mega Supertrend for IntradayThis is a simple intraday strategy for working on Stocks or commodities based out on Super Trend and intraday's best friend - VWAP . You can modify the start time and end time based on your timezones. Session value should be from market start to the time you want to square-off
Important: The end time should be at least 2 minutes before the intraday square-off time set by your broker
Comment below if you get good returns
Strategy: Tweaked Super trend with VWAP
Indicators used :
Super trend is simple and easy to use indicator and gives a precise reading about an on going trend.It is built with two parameters, namely period and multiplier.The Buy and Sell signal modifies once the indicator tosses over the closing price. When the Super trend closes above the Price, a Buy signal is generated, and when the Super trend closes below the Price, a Sell signal is generated. In this case we use it only for direction .
Multiplier is a vital input for Super trend. If the multiplier value is too high, then lesser number of signals is made.
Volume is important as we don’t want to get stuck with a stock which has few takers, even if you think it is priced attractively. Thus, the VWAP was created to take into account both volume as well as Price so that the potential trader would make the trading decision or not.
In simple terms, the Volume Weighted Average price is the cumulative average price with respect to the volume
Buying/Selling
when the closing price starts moving up/down and farther from the VWAP, there is pressure among the traders to sell/buy, a general belief kicks in that it might be that the stock is overvalued/undervalued .This is the time when we couple the Super trend to take our entries
Usage & Best setting :
Choose a good volatile stock and a time frame - 5m.
ST multiplier : 3
There is stop loss and take profit that can be used to optimise your trade
The template also includes daily square off based on your time.

WUNDER VolPIN SHORT StrategyHello to everyone
Overview
I am publishing the 2nd version of the volpin long strategy that I have published before. In this strategy, we make purchases 20 times with DCA logic and we exit at the rate we wish.
Calculation:
In this strategy, we buy according to bar movements. The volume of the bars and the needle tips they leave are used in the calculation. You can edit the intensity of the needle point in the settings section from the section that says pin percentage. You can adjust the volume intensity from the volatility percentage section. The most important part here is that you must change it for each time zone while making the settings. For example, I set the volatility to 1.005 and the pin percentegae part to 1.004 in the 15-minute charts by default. You can use these settings by changing them according to the time zone. You can also evaluate the strategy at any time in the day and time setting section.
Summary :
In summary, it is a simple but very effective strategy. Just get the settings right. Lots of gains.ery effective strategy. Just get the settings right. Lots of gains.

QuickSilver Intraday using RSIThis is a simple intraday strategy using very basic intraday super indicators - RSI & VWAP for working on Stocks . You can modify the values on the stock and see what are your best picks. Comment below if you found something with good returns
Strategy:
Indicators used :
The Relative Strength Index (RSI) is one of the most popular and widely used momentum oscillators.The values of the RSI oscillator, typically measured over a 14-day period, fluctuate between zero and 100. The Relative Strength Index indicates oversold market conditions when below 30 and overbought market conditions when above 70
VWAP identifies the true average price of a stock by factoring the volume of transactions at a specific price point and not based on the closing price. VWAP can add more value than your standard 10, 50, or 200 moving average indicators because VWAP reacts to price movements based on the volume during a given period.
Buying happens at VWAP Breakouts which is then validated with RSI to check for overbought & oversold conditions.
Aggressive trade stop can be employed by using the % for long and shorts in the strategy.
Usage & Best setting :
Choose a good volatile stock and a time frame - 10m.
RSI : 9
Overbought & Oversold - can be varied as per user
There is stop loss and take profit that can be used to optimise your trade
Extending this to,
In general guidelines for RSI :
Short-term intraday traders (day trading) often use lower settings with periods in the range of 9-11.
Medium-term swing traders frequently use the default period setting of 14.
Longer-term position traders often set it at a higher period, in the range of 20-30.
The template also includes daily square off based on your time.

[VJ]Thor for MFIThis is a simple intraday strategy for working on Stocks or commodities . You can modify the start time and end time based on your timezones. Session value should be from market start to the time you want to square-off
Important: The end time should be at least 2 minutes before the intraday square-off time set by your broker
Comment below if you get good returns
Strategy:
Indicators used :
Moving average (MA) is a widely used technical indicator that smooths out price trends by filtering out the “noise” from random short-term price fluctuations. Here moving averages are used to identify trend direction and to determine support and resistance levels. Overbought and oversold regions are also taken into consideration
The Money Flow Index ( MFI ) is a momentum indicator that measures the flow of money into and out of a security over a specified period of time. It is related to the Relative Strength Index ( RSI ) but incorporates volume , whereas the RSI only considers price. The MFI is calculated by accumulating positive and negative Money Flow values (see Money Flow ), then creating a Money Ratio. The Money Ratio is then normalized into the MFI oscillator form.
Using the combination of Overbought and Oversold values and varying MFI and using the MA filter to ensure the direction , we can buy/sell when conditions are met
Buying with MFI
1. MFI drops below 20 and enters inside oversold zone.
2. MFI bounces back above 20.
3. MFI pulls back but remains above 20.
4. A MFI break out above its previous high is a good buy signal.
Selling with MFI
1. MFI rises above 80 and enters inside overbought zone.
2. MFI drops back below 80.
3. MFI rises slightly but remains below 80.
4. MFI drops lower than its previous low is a signal to short sell or profit booking
Usage & Best setting :
Choose a good volatile stock and a time frame - 5m.
MFI factor : 3
Moving Average : 80
Overbought & Oversold - can be varied as per user
There is stop loss and take profit that can be used to optimise your trade
The template also includes daily square off based on your time.

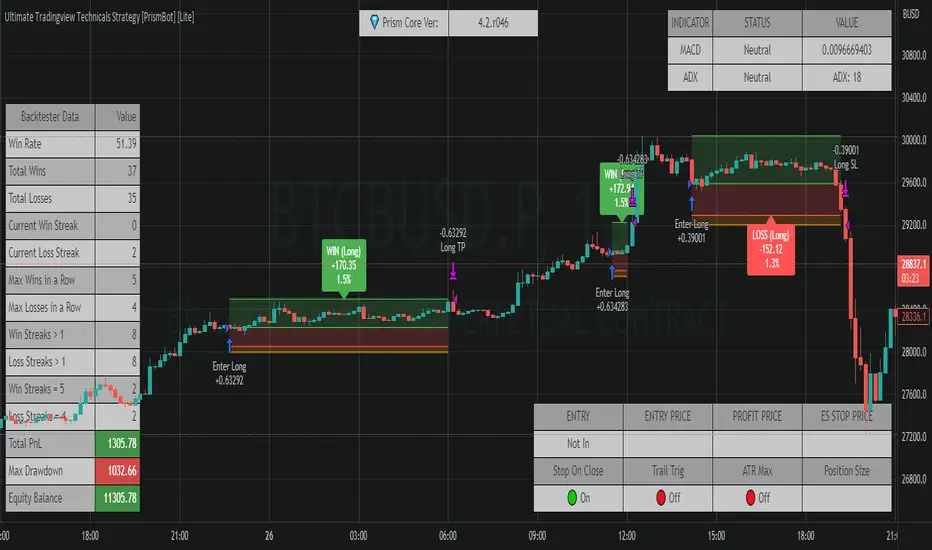
Ultimate Tradingview Technicals Strategy [PrismBot] [Lite]Included in this builder:
MACD
RSI
Tradingview Technical Analysis
Ichimoku
Global Trend Filter
Pullback Filter
Our most robust strategy to date with MACD , RSI , and many other basic strategies included as well as additional filters and alert options.
It is an advanced trading strategy built with the intent to make it easy for anyone to begin trading, but also avoid too much complication of strategy concepts.
For instance, you can change the MACD settings to be "more sensitive" by using a simple dropdown menu, and adjust which strategy you are employing with the MACD on the fly with another.
You can easily enable and disable strategies using the checkbox.
The strategy demo results use 100% equity per trade as an example - the reason for this is that the stop loss is set to 1%, so each trade is risking 1% (give or take slippage). Slippage is set to 5 ticks, and a 0.04% commission (Binance average for market and limit orders)
This strategy incorporates a risk to reward system where the user can select between ATR and Percent based stop losses and take profit targets. This means that the user has much better control over money management when utilizing this strategy and it doesn't require you to babysit the strategy to ensure it's entering and existing strategies in an ideal place.
The status box shows the current state of the various strategies and their values. A red circle indicates the filter / strategy is not valid for entry yet. A green circle indicates that filter / strategy is valid for entry. When all selected strategies are valid simultaneously, the next bar will trigger an entry signal.
If you have any questions about this strategy, please leave them in the comments below, or DM for more details. Thanks!
Additional features in this lite strategy:
✔️ Tweak a multitude of specific settings (MA lengths, R:R, SL distance etc)
✔️ Use money management and risk calculations
✔️ Draw trade info directly to chart (eg. SL size in percent, win rate etc)
✔️ Use various filters (eg. time filter, date filter etc)
✔️ Manage risk per position
✔️ Sync to any bot or algorithmic trading system
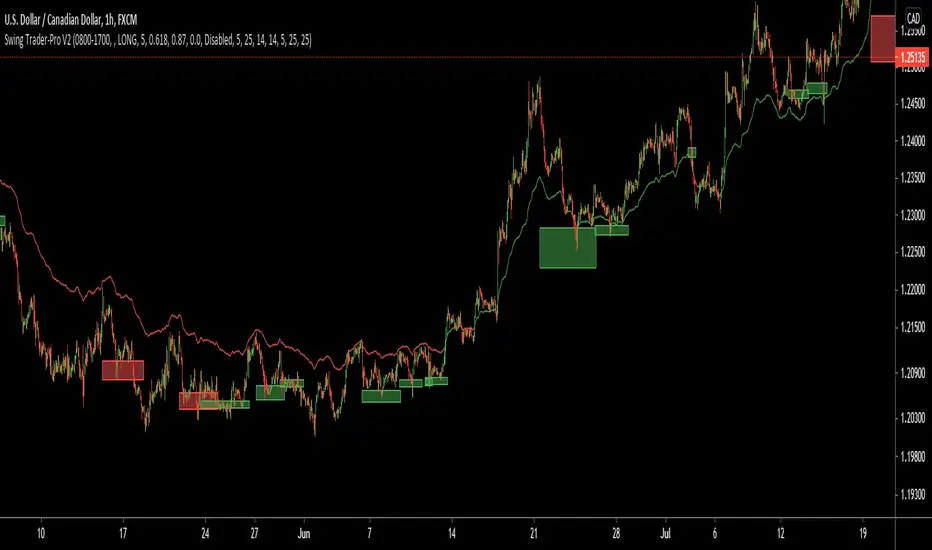
Swing Trader-Pro V2The strategy- what is it?
This indicator is designed from a theory created by myself in order to distinguish a correction from an impulse. This comes down to the ability to compare "x" range of candles to "y" range of candles and highlight key differences to then correctly portray that the most recent move in price will be (or is) a correction.
Following this theory, we all understand that corrections don't go with the trend right? So this means at some point, there is a high probability of a rejection somewhere in this most recent move, that will ultimately push price higher or lower as it continues back with the trend. Therefore, through extensive quantitative research and back-testing, we are able to highlight areas of high-probability rejections within these supposed corrections.
How does it work?
Firstly, we need to establish a high and low point (using pivots ) that help us decide what the state is of the recent move between the high and low (we call this "point A" and "point B"). So we can only consider whether the recent move in price was an impulse or a correction until the move from "point B" to "point C" is made. But before that, once we have identified "Point A" and "point B", we use 2 (supposedly) strong levels which help integrate a box onscreen and thus, indicate this area of high liquidity. This box will continue to adjust according to the change of pivots (if price keeps creating HH's & HL's or LH's & LL's depending on market trend). But if we establish a strong high and low and price stays within this range, then the box will remain in place.
The default color of the box is red; the only time the color of the box will change is when:
- Price retraces from the high/low back to the box (price has to touch the box)
AND
-If any of our confirmations indicate a successful correction based on our theory.
So the box color varies:
- Red = very weak (or) no entry = no confirmations were made
- Yellow = weak entry = some but not all confirmations were made
- Green = strong entry = all confirmations have indicated that the move from "point B" to "point C" (remember that "point C" is where the box is) is a correction when compared with the move from "point A" to "point B"
These confirmations are all validated on the same candle during live candle activity (not when the candle has closed on the box). As this happens, the confirmations will determine the state of entry quality as soon as price touches the box.
In this time, we will see a new orange label highlighting what indicators have confirmed a successful correction and what haven't.
The label shows the different confirmation indicators in which we have provided different names (as this is the secret we intend to keep). So we have:
- "CC"
- "B1/B2"
- "B3"
Usually, we will see either an "OK" or "NOT OK" next to each confirmation indicator. This just tells us whether they have confirmed or not. Please note that this "point C" label does not stay permanently, regardless of the state of entry quality. The label will in fact stay on the screen until the next box has been generated, which is usually a few candles after the entry has been triggered.
Entries, SL's and TP's
This indicator shows the user an area of high-probability rejection. So in terms of specifying a precise entry, you're completely free to enter on the following:
- the moment price touches the box (depending on what color it is of course)
- the other end of the box (if you would like to catch a "sniper entry")
- or if price pierces the entire box and is still green, you can wait to see if price comes back through the box (which indicates a false breakout).
As for Stop-losses, i would recommend:
- Long entries: set your SL at the recent low (this should be "point A")
- Short entries: set your SL to the recent high (this should be "point A" as well, because if you're switching from the "long entry" setting to the "short entry" setting, the indicator labels flip around and are the opposite of what they are for long entries).
For Take profits, this is entirely up to the user. Because some entries will allow you to have great RR ratios depending on how you manage the active trades. Some recommendations below:
- Set TP to "point B" pivot
- Use trailing stop function or something similar if available
- Add other indicators such as the RSI and close when price reaches key levels
- When price shows signs of exhaustion or early stages of reversal then just close
Additional information and recommendations
- This works on any time frame and on any financial market, whether you prefer Forex, stocks, crypto, commodities , etc.
- In regards to trade direction, you can change in the settings to look for either long or short positions in the market. I would recommend using it in favor of the overall trend of the markets because you will find a lot better entries. Although, this does work against the trend at times as well. Additionally, this tool also works in consolidating markets which is beneficial.
- After becoming used to the script, i would say to apply it twice to your screen and have one looking for Long entries and the other looking for Short entries.
- As the user, you have the ability to remove the labels in the parameter settings (because it does look quite messy onscreen, especially if you have both long and short entries on at the same time). I would only personally show the labels when price hits the current box to see what confirmations have been identified.
- I will also provide the best parameters to use. You will only need one set of parameters for each long and short setting, as these parameters are universal for any time frame and any financial market.
FIRST UPDATE
After extensive back testing using our first version, we found that in fact, there are some great opportunities being wasted as the entry box stays red. This is due to some series of market structure that don't always fit our theory of continuations within the market. We found that although our theory is accurate, the amount of times the market fits this is more rare than times when price follows sequences. When we look for sequences in the market instead of specifying differences between impulses and corrections, we actually see areas of serious repetitiveness, thanks to how our indicator initially generates. Not how it confirms. So, understanding this new theory through one component of our previous indicator, we are still able to keep boxes at the same area yet accurately confirm more profitable entries external to our full previous strategy.
Moving towards the practical side of things:
-Make sure "add extra confirmation" parameter is selected, as this will allow the indicator to search for more valid entries rather than just our normal confirmations. (this is a tick box).
- Default parameters are already set for both C1 and C2
In a simple sense, this update is added to find more confirmations to turn more red boxes into green boxes based on other theories outside of our original one. How we do this exactly is part of the mystery.
SECOND UPDATE
- Fibonacci based moving average: using elements of the Fibonacci sequence and its relevance to being a hot-spot in price activity, we have integrated this into a moving average which is stronger than your usual MA. Here, you will notice it showing stronger signs of rejecting price, especially when trending. Hence, this is extremely useful to implement into your strategy as part of the trend identification. When price is consolidating, depending on how volatile or close-in the waves are during these periods, the FMA is similar to your typical MA, so therefore not so good. But the overall intention of this is to enhance your conclusion to whether price is trending and whether price is bullish or bearish.
- This is now a strategy, not just an indicator: So now we can choose from a huge variety of parameters in accordance to what ones work best with what pair, or time frame. The typical parameters to change would be the entry points, stop losses and take profits. We have also added in a "SL to entry" option. ALL PARAMETERS ARE FIBONACCI LEVELS AS THIS MAKES IT UNIVERSAL TO ANY PAIR/ TIME FRAME.
- Move the entry boxes : So this is very useful for certain pairs and mainly to help the user understand key sequences on a quantitative level. Sometimes we can notice that pairs spike higher than the typical entry (0.618) so we have allowed flexibility to the point where you can alter the box appearance to either the 0.618 level (default), 0.786 and the 0.9 level.
- Back-testing: Now the user can back-test the strategy and see the performance within any financial market you add this to! Please note that according to the strategy, once a trade is placed, it wont enter any more trades when the current one is still active. I have requested to change this, but it is out of our development team's reach. However, this doesn't discredit what the system can help you achieve, as you will still be able to find profitable parameters within the financial markets.
Strategy default properties
Backtest start: this date is when you would like to start the backtest, however, the indicator will go as far as the data can be read
Backtest end: choose your date to end the back test.
Trade session: choose the trading session you want this strategy to work on.
Filter by session: you can filter the backtested results depending on whether you want the strategy to take trades within the chosen trading session.
Filter by Fibonacci moving average: select this if you would like for the back tested results to consider whether the valid trade setups are in accordance to what the FMA displays (Bullish or Bearish). This is deselected.
Fibonacci Moving Average Timeframe: here you can select what timeframe you would like the FMA to work on, default is the “same as chart” button/ option.
TraderDirection: choose whether you would like LONG or SHORT entries for the indicator to find.
Max risk per trade: choose the risk setting per trade, i would suggest lowering this to 1% ((MODERATOR) This is the default setting!)
EntryFib: choose between the options as to where you would like the strategy to enter positions, the default is the 0.618 zone which is the closest side of the box to price. You will also see that when you choose to change this, the boxes on your screen will move accordingly. A very helpful function!
StopFib: choose your Stop Loss based on the same Fibonacci level as what you choose for your entry, remember that the higher the fib level, the higher (or safer) your Stop Loss is from price spiking. It all comes down to preference.
TakeProfitFib: choose your Take Profit based on the same Fibonacci level as what you choose for your entry, remember that the lower the fib level, the higher your Take Profit is again, It all comes down to preference.
BreakevenFib: the default setting is on “disabled” however when you select a certain Fibonacci level, once price reaches there during the active trade, your Stop Loss will be set to entry, this function is designed to stop volatile price fluctuations rendering your in-profit trade result to hitting your Stop Loss and losing when it closes out.
Stock trending strategy This is a long only strategy designed maily for stock markets and futures. In general it works best with 1h, however it can be optimized with other timeframes as well.
Components:
VWAP
MACD histogram
EMA 9
Rules for entry
Long :
For VWAP: close is above the vwap daily
EMA: close is above the moving average
MACD histogram is above 0
Short:
For VWAP: close is belowthe vwap daily
EMA: close is below the moving average
MACD histogram is below 0
Rules for exit
This strategy does not have any risk management inside. Instead it exits whenver it receives an opposite signal form the original one used for entry.
If you have any questions let me know !

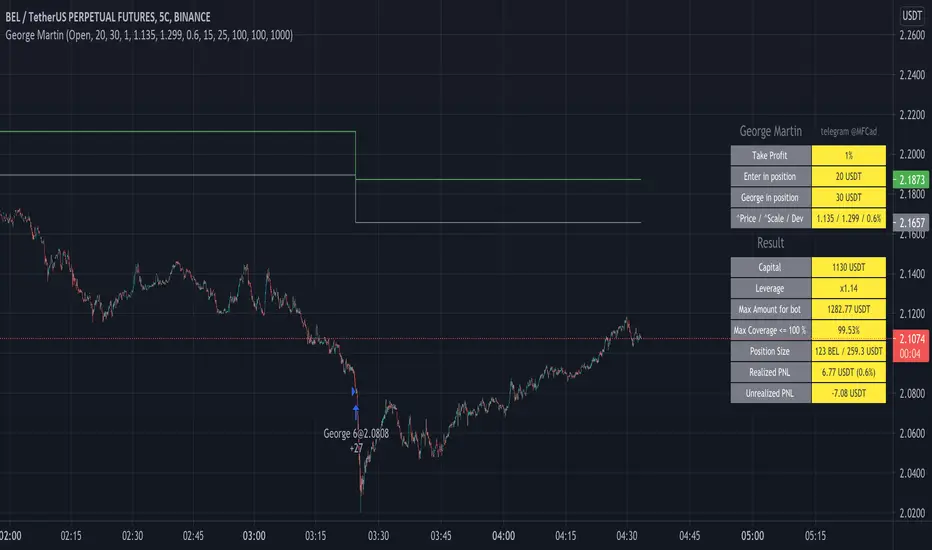
George MartinENG:
This script is based on a simple principle - MartinGale. Each subsequent entry, if the price goes in the wrong direction, increases the number of contracts taking into account the coefficient and also changes the entry price taking into account the coefficient. The coefficients can be configured so that the script keeps the drawdown up to 85%. For instructions and connection - write.
RUS:
Этот скрипт основан на простом принципе - Мартин Гейл. Каждый следующий вход если цена идет не в нужную сторону, увеличивает количество контрактов с учетом коэффициента и также меняется цена входа с учетом коэффициента. Коэффициенты можно настроить таким образом чтобы скрипт держал просадку до 85%. Для инструкций и подключения - пишите.