Volume Spread Analysis [TANHEF]Volume Spread Analysis: Understanding Market Intentions through the Interpretation of Volume and Price Movements.
█ Simple Explanation:
The Volume Spread Analysis (VSA) indicator is a comprehensive tool that helps traders identify key market patterns and trends based on volume and spread data. This indicator highlights significant VSA patterns and provides insights into market behavior through color-coded volume/spread bars and identification of bars indicating strength, weakness, and neutrality between buyers and sellers. It also includes powerful volume and spread forecasting capabilities.
█ Laws of Volume Spread Analysis (VSA):
The origin of VSA begins with Richard Wyckoff, a pivotal figure in its development. Wyckoff made significant contributions to trading theory, including the formulation of three basic laws:
The Law of Supply and Demand: This fundamental law states that supply and demand balance each other over time. High demand and low supply lead to rising prices until demand falls to a level where supply can meet it. Conversely, low demand and high supply cause prices to fall until demand increases enough to absorb the excess supply.
The Law of Cause and Effect: This law assumes that a 'cause' will result in an 'effect' proportional to the 'cause'. A strong 'cause' will lead to a strong trend (effect), while a weak 'cause' will lead to a weak trend.
The Law of Effort vs. Result: This law asserts that the result should reflect the effort exerted. In trading terms, a large volume should result in a significant price move (spread). If the spread is small, the volume should also be small. Any deviation from this pattern is considered an anomaly.
█ Volume and Spread Analysis Bars:
Display: Volume and/or spread bars that consist of color coded levels. If both of these are displayed, the number of spread bars can be limited for visual appeal and understanding, with the spread bars scaled to match the volume bars. While automatic calculation of the number of visual bars for auto scaling is possible, it is avoided to prevent the indicator from reloading whenever the number of visual price bars on the chart is adjusted, ensuring uninterrupted analysis. A displayable table (Legend) of bar colors and levels can give context and clarify to each volume/spread bar.
Calculation: Levels are calculated using multipliers applied to moving averages to represent key levels based on historical data: low, normal, high, ultra. This method smooths out short-term fluctuations and focuses on longer-term trends.
Low Level: Indicates reduced volatility and market interest.
Normal Level: Reflects typical market activity and volatility.
High Level: Indicates increased activity and volatility.
Ultra Level: Identifies extreme levels of activity and volatility.
This illustrates the appearance of Volume and Spread bars when scaled and plotted together:
█ Forecasting Capabilities:
Display: Forecasted volume and spread levels using predictive models.
Calculation: Volume and Spread prediction calculations differ as volume is linear and spread is non-linear.
Volume Forecast (Linear Forecasting): Predicts future volume based on current volume rate and bar time till close.
Spread Forecast (Non-Linear Dynamic Forecasting): Predicts future spread using a dynamic multiplier, less near midpoint (consolidation) and more near low or high (trending), reflecting non-linear expansion.
Moving Averages: In forecasting, moving averages utilize forecasted levels instead of actual levels to ensure the correct level is forecasted (low, normal, high, or ultra).
The following compares forecasted volume with actual resulting volume, highlighting the power of early identifying increased volume through forecasted levels:
█ VSA Patterns:
Criteria and descriptions for each VSA pattern are available as tooltips beside them within the indicator’s settings. These tooltips provide explanations of potential developments based on the volume and spread data.
Signs of Strength (🟢): Patterns indicating strong buying pressure and potential market upturns.
Down Thrust
Selling Climax
No Effort → Bearish Result
Bearish Effort → No Result
Inverse Down Thrust
Failed Selling Climax
Bull Outside Reversal
End of Falling Market (Bag Holder)
Pseudo Down Thrust
No Supply
Signs of Weakness (🔴): Patterns indicating strong selling pressure and potential market downturns.
Up Thrust
Buying Climax
No Effort → Bullish Result
Bullish Effort → No Result
Inverse Up Thrust
Failed Buying Climax
Bear Outside Reversal
End of Rising Market (Bag Seller)
Pseudo Up Thrust
No Demand
Neutral Patterns (🔵): Patterns indicating market indecision and potential for continuation or reversal.
Quiet Doji
Balanced Doji
Strong Doji
Quiet Spinning Top
Balanced Spinning Top
Strong Spinning Top
Quiet High Wave
Balanced High Wave
Strong High Wave
Consolidation
Bar Patterns (🟡): Common candlestick patterns that offer insights into market sentiment. These are required in some VSA patterns and can also be displayed independently.
Bull Pin Bar
Bear Pin Bar
Doji
Spinning Top
High Wave
Consolidation
This demonstrates the acronym and descriptive options for displaying bar patterns, with the ability to hover over text to reveal the descriptive text along with what type of pattern:
█ Alerts:
VSA Pattern Alerts: Notifications for identified VSA patterns at bar close.
Volume and Spread Alerts: Alerts for confirmed and forecasted volume/spread levels (Low, High, Ultra).
Forecasted Volume and Spread Alerts: Alerts for forecasted volume/spread levels (High, Ultra) include a minimum percent time elapsed input to reduce false early signals by ensuring sufficient bar time has passed.
█ Inputs and Settings:
Display Volume and/or Spread: Choose between displaying volume bars, spread bars, or both with different lookback periods.
Indicator Bar Color: Select color schemes for bars (Normal, Detail, Levels).
Indicator Moving Average Color: Select schemes for bars (Fill, Lines, None).
Price Bar Colors: Options to color price bars based on VSA patterns and volume levels.
Legend: Display a table of bar colors and levels for context and clarity of volume/spread bars.
Forecast: Configure forecast display and prediction details for volume and spread.
Average Multipliers: Define multipliers for different levels (Low, High, Ultra) to refine the analysis.
Moving Average: Set volume and spread moving average settings.
VSA: Select the VSA patterns to be calculated and displayed (Strength, Weakness, Neutral).
Bar Patterns: Criteria for bar patterns used in VSA (Doji, Bull Pin Bar, Bear Pin Bar, Spinning Top, Consolidation, High Wave).
Colors: Set exact colors used for indicator bars, indicator moving averages, and price bars.
More Display Options: Specify how VSA pattern text is displayed (Acronym, Descriptive), positioning, and sizes.
Alerts: Configure alerts for VSA patterns, volume, and spread levels, including forecasted levels.
█ Usage:
The Volume Spread Analysis indicator is a helpful tool for leveraging volume spread analysis to make informed trading decisions. It offers comprehensive visual and textual cues on the chart, making it easier to identify market conditions, potential reversals, and continuations. Whether analyzing historical data or forecasting future trends, this indicator provides insights into the underlying factors driving market movements.
Volumepriceanalysis

VolumeSpreadAnalysisLibrary "VolumeSpreadAnalysis"
A library for Volume Spread Analysis (VSA).
spread(_barIndex)
Calculates the spread of a bar.
Parameters:
_barIndex (int) : (int) The index of the bar.
Returns: (float) The spread of the bar.
volume(_barIndex)
Retrieves the volume of a bar.
Parameters:
_barIndex (int) : (int) The index of the bar.
Returns: (float) The volume of the bar.
body(_barIndex)
Calculates the body of a bar.
Parameters:
_barIndex (simple int) : (int) The index of the bar.
Returns: (float) The body size of the bar.
wickUpper(_barIndex)
Calculates the upper wick of a bar (upper shadow).
Parameters:
_barIndex (simple int) : (int) The index of the bar.
Returns: (float) The upper wick size of the bar.
wickLower(_barIndex)
Calculates the lower wick of a bar (lower shadow).
Parameters:
_barIndex (simple int) : (int) The index of the bar.
Returns: (float) The lower wick size of the bar.
calcForecastedSMA(_source, _length, _forecastedLevel)
Calculates the forecasted Simple Moving Average (SMA).
Parameters:
_source (float) : (series float) Source data for calculation.
_length (simple int) : (int) The length of the SMA.
_forecastedLevel (float) : (float) The forecasted level to include in the calculation.
Returns: (float) The forecasted SMA value.
calcForecastedEMA(_source, _length, _forecastedLevel)
Calculates the forecasted Exponential Moving Average (EMA).
Parameters:
_source (float) : (series float) Source data for calculation.
_length (simple int) : (int) The length of the EMA.
_forecastedLevel (float) : (float) The forecasted level to include in the calculation.
Returns: (float) The forecasted EMA value.
calcForecastedRMA(_source, _length, _forecastedLevel)
Calculates the forecasted Relative Moving Average (RMA).
Parameters:
_source (float) : (series float) Source data for calculation.
_length (simple int) : (int) The length of the RMA.
_forecastedLevel (float) : (float) The forecasted level to include in the calculation.
Returns: (float) The forecasted RMA value.
calcForecastedWMA(_source, _length, _forecastedLevel)
Calculates the forecasted Weighted Moving Average (WMA).
Parameters:
_source (float) : (series float) Source data for calculation.
_length (simple int) : (int) The length of the WMA.
_forecastedLevel (float) : (float) The forecasted level to include in the calculation.
Returns: (float) The forecasted WMA value.
calcElapsedTimePercent()
Calculates the elapsed time percent of the current bar.
Returns: (float) The elapsed time percent.
calcForecastedSpread(multiplierAtMidpoints, multiplierAtPeaks)
Calculates the forecasted spread using elapsed time and dynamic multipliers, handling spread's non-linear nature.
Parameters:
multiplierAtMidpoints (float) : (float) The multiplier value at midpoints.
multiplierAtPeaks (float) : (float) The multiplier value at peaks.
Returns: (float) The forecasted spread value.
calcForecastedVolume()
Calculates the forecasted volume using elapsed time, satisfying volume's linear nature.
Returns: (float) The forecasted volume value.
calcForecastedMA(_source, _length, _forecastedSource, _type)
Calculates the forecasted Moving Average (MA) based on the specified type.
Parameters:
_source (float) : (series float) Source data for calculation.
_length (simple int) : (int) The length of the MA.
_forecastedSource (float) : (float) The forecasted level to include in the calculation.
_type (simple string) : (string) The type of the MA ("SMA", "EMA", "SMMA (RMA)", "WMA").
Returns: (float) The forecasted MA value.
calcMA(_source, _length, _type)
Calculates the Moving Average (MA) based on the specified type.
Parameters:
_source (float) : (series float) Source data for calculation.
_length (simple int) : (int) The length of the MA.
_type (simple string) : (string) The type of the MA ("SMA", "EMA", "SMMA (RMA)", "WMA").
Returns: (float) The MA value.
bullBar(_barIndex)
Determines if the bar is bullish.
Parameters:
_barIndex (simple int) : (int) The index of the bar.
Returns: (bool) True if the bar is bullish, otherwise false.
bearBar(_barIndex)
Determines if the bar is bearish.
Parameters:
_barIndex (simple int) : (int) The index of the bar.
Returns: (bool) True if the bar is bearish, otherwise false.
breakout(_barIndex)
Determines if there is a breakout above the previous bar.
Parameters:
_barIndex (simple int) : (int) The index of the bar.
Returns: (bool) True if there is a breakout, otherwise false.
breakdown(_barIndex)
Determines if there is a breakdown below the previous bar.
Parameters:
_barIndex (simple int) : (int) The index of the bar.
Returns: (bool) True if there is a breakdown, otherwise false.
rejectionWickUpper(_rejectionWick)
Determines if the upper wick is a rejection wick.
Parameters:
_rejectionWick (simple float) : (float) The rejection wick percentage.
Returns: (bool) True if the upper wick is a rejection wick, otherwise false.
rejectionWickLower(_rejectionWick)
Determines if the lower wick is a rejection wick.
Parameters:
_rejectionWick (simple float) : (float) The rejection wick percentage.
Returns: (bool) True if the lower wick is a rejection wick, otherwise false.
setupDataVolume(_data, _mult_Low, _mult_High, _mult_Ultra, _maLengthVolume, _maTypeVolume)
Sets up data for volume levels.
Parameters:
_data (map) : (map) The map to store the levels.
_mult_Low (simple float) : (float) The multiplier for low level.
_mult_High (simple float) : (float) The multiplier for high level.
_mult_Ultra (simple float) : (float) The multiplier for ultra level.
_maLengthVolume (simple int) : (int) The length for MA.
_maTypeVolume (simple string) : (string) The type for MA.
Returns: (void) Nothing.
setupDataSpread(_data, _mult_Low, _mult_High, _mult_Ultra, _maLengthSpread, _maTypeSpread)
Sets up data for spread levels.
Parameters:
_data (map) : (map) The map to store the levels.
_mult_Low (simple float) : (float) The multiplier for low level.
_mult_High (simple float) : (float) The multiplier for high level.
_mult_Ultra (simple float) : (float) The multiplier for ultra level.
_maLengthSpread (simple int) : (int) The length for MA.
_maTypeSpread (simple string) : (string) The type for MA.
Returns: (void) Nothing.
setupDataForecastVolume(_dataForecast, _mult_Low, _mult_High, _mult_Ultra, _maLengthVolume, _predictedLevelVolume, _maTypeVolume)
Sets up data for volume and spread levels for forecast.
Parameters:
_dataForecast (map)
_mult_Low (simple float) : (float) The multiplier for low level.
_mult_High (simple float) : (float) The multiplier for high level.
_mult_Ultra (simple float) : (float) The multiplier for ultra level.
_maLengthVolume (simple int) : (int) The length for MA.
_predictedLevelVolume (float) : (float) The predicted level for MA.
_maTypeVolume (simple string) : (string) The type for MA.
Returns: (void) Nothing.
setupDataForecastSpread(_dataForecast, _mult_Low, _mult_High, _mult_Ultra, _maLengthSpread, _predictedLevelSpread, _maTypeSpread)
Sets up data for spread levels for forecast.
Parameters:
_dataForecast (map)
_mult_Low (simple float) : (float) The multiplier for low level.
_mult_High (simple float) : (float) The multiplier for high level.
_mult_Ultra (simple float) : (float) The multiplier for ultra level.
_maLengthSpread (simple int) : (int) The length for MA.
_predictedLevelSpread (float) : (float) The predicted level for MA.
_maTypeSpread (simple string) : (string) The type for MA.
Returns: (void) Nothing.
isVolumeLow(_data, _barIndex)
Determines if the volume is low.
Parameters:
_data (map) : (map) The data map with volume levels.
_barIndex (int)
Returns: (bool) True if the volume is low, otherwise false.
isVolumeNormal(_data, _barIndex)
Determines if the volume is normal.
Parameters:
_data (map) : (map) The data map with volume levels.
_barIndex (int)
Returns: (bool) True if the volume is normal, otherwise false.
isVolumeHigh(_data, _barIndex)
Determines if the volume is high.
Parameters:
_data (map) : (map) The data map with volume levels.
_barIndex (int)
Returns: (bool) True if the volume is high, otherwise false.
isVolumeUltra(_data, _barIndex)
Determines if the volume is ultra.
Parameters:
_data (map) : (map) The data map with volume levels.
_barIndex (int)
Returns: (bool) True if the volume is ultra, otherwise false.
isSpreadLow(_data, _barIndex)
Determines if the spread is low.
Parameters:
_data (map) : (map) The data map with spread levels.
_barIndex (int)
Returns: (bool) True if the spread is low, otherwise false.
isSpreadNormal(_data, _barIndex)
Determines if the spread is normal.
Parameters:
_data (map) : (map) The data map with spread levels.
_barIndex (int)
Returns: (bool) True if the spread is normal, otherwise false.
isSpreadHigh(_data, _barIndex)
Determines if the spread is high.
Parameters:
_data (map) : (map) The data map with spread levels.
_barIndex (int)
Returns: (bool) True if the spread is high, otherwise false.
isSpreadUltra(_data, _barIndex)
Determines if the spread is ultra.
Parameters:
_data (map) : (map) The data map with spread levels.
_barIndex (int)
Returns: (bool) True if the spread is ultra, otherwise false.
isVolumeText(_data)
Determines text string representing the volume area level.
Parameters:
_data (map) : (map) The data map with volume levels.
Returns: (string) Text string of Low, Normal, High, or Ultra.
isSpreadText(_data)
Determines text string representing the spread area level.
Parameters:
_data (map) : (map) The data map with spread levels.
Returns: (string) Text string of Low, Normal, High, or Ultra.
calcBarColor(_value, _level)
Calculates the color based level.
Parameters:
_value (float) : (float) The value to check.
_level (float) : (float) The value level for comparison.
Returns: (color) The color for the bar.
bullPinBar(_maxBodyPercent, _minWickPercent)
Determines if the bar is a bull pin bar.
Parameters:
_maxBodyPercent (simple float) : (float) The maximum body percentage.
_minWickPercent (simple float) : (float) The minimum wick percentage.
Returns: (bool) True if the bar is a bull pin bar, otherwise false.
bearPinBar(_maxBodyPercent, _minWickPercent)
Determines if the bar is a bear pin bar.
Parameters:
_maxBodyPercent (simple float) : (float) The maximum body percentage.
_minWickPercent (simple float) : (float) The minimum wick percentage.
Returns: (bool) True if the bar is a bear pin bar, otherwise false.
dojiBar(_maxBodyPercent)
Determines if the bar is a doji.
Parameters:
_maxBodyPercent (simple float) : (float) The maximum body percentage.
Returns: (bool) True if the bar is a doji, otherwise false.
spinningTopBar(_minWicksPercent, _emaLength)
Determines if the bar is a spinning top.
Parameters:
_minWicksPercent (simple float) : (float) The minimum wicks percentage.
_emaLength (simple int) : (int) The length for EMA calculation.
Returns: (bool) True if the bar is a spinning top, otherwise false.
highWaveBar(_minBodyPercent, _minWickPercent, _bars)
Determines if the bar is a high wave bar.
Parameters:
_minBodyPercent (simple float) : (float) The minimum body percentage.
_minWickPercent (simple float) : (float) The minimum wick percentage.
_bars (simple int) : (int) The number of bars for comparison.
Returns: (bool) True if the bar is a high wave bar, otherwise false.
consolidationBar(_data, _spread, _bars)
Determines if the bars are in consolidation.
Parameters:
_data (map) : (map) The data map with spread levels.
_spread (simple float) : (float) The spread percentage for comparison.
_bars (simple int) : (int) The number of bars for comparison.
Returns: (bool) True if the bars are in consolidation, otherwise false.
S_DownThrust(_data, _bullPinBarMaxBody, _bullPinBarMinWick)
Determines if there is a sign of strength (DownThrust).
Parameters:
_data (map) : (map) The data map with volume and spread levels.
_bullPinBarMaxBody (simple float) : (float) The maximum body percentage for bull pin bar.
_bullPinBarMinWick (simple float) : (float) The minimum wick percentage for bull pin bar.
Returns: (bool) True if there is a sign of strength (DownThrust), otherwise false.
S_SellingClimax(_data, _rejectionWick)
Determines if there is a sign of strength (Selling Climax).
Parameters:
_data (map) : (map) The data map with volume and spread levels.
_rejectionWick (simple float) : (float) The rejection wick percentage.
Returns: (bool) True if there is a sign of strength (Selling Climax), otherwise false.
S_NoEffortBearishResult()
Determines if there is a sign of strength (No Effort Bearish Result).
Returns: (bool) True if there is a sign of strength (No Effort Bearish Result), otherwise false.
S_BearishEffortNoResult()
Determines if there is a sign of strength (Bearish Effort No Result).
Returns: (bool) True if there is a sign of strength (Bearish Effort No Result), otherwise false.
S_InverseDownThrust(_data, _bearPinBarMaxBody, _bearPinBarMinWick)
Determines if there is a sign of strength (Inverse DownThrust).
Parameters:
_data (map) : (map) The data map with volume and spread levels.
_bearPinBarMaxBody (simple float) : (float) The maximum body percentage for bear pin bar.
_bearPinBarMinWick (simple float) : (float) The minimum wick percentage for bear pin bar.
Returns: (bool) True if there is a sign of strength (Inverse DownThrust), otherwise false.
S_FailedSellingClimax()
Determines if there is a sign of strength (Failed Selling Climax).
Returns: (bool) True if there is a sign of strength (Failed Selling Climax), otherwise false.
S_BullOutsideReversal(_data)
Determines if there is a sign of strength (Bull Outside Reversal).
Parameters:
_data (map) : (map) The data map with volume and spread levels.
Returns: (bool) True if there is a sign of strength (Bull Outside Reversal), otherwise false.
S_EndOfFallingMarket(_data)
Determines if there is a sign of strength (End of Falling Market).
Parameters:
_data (map) : (map) The data map with volume and spread levels.
Returns: (bool) True if there is a sign of strength (End of Falling Market), otherwise false.
S_PseudoDownThrust(_bullPinBarMaxBody, _bullPinBarMinWick)
Determines if there is a sign of strength (Pseudo DownThrust).
Parameters:
_bullPinBarMaxBody (simple float) : (float) The maximum body percentage for bull pin bar.
_bullPinBarMinWick (simple float) : (float) The minimum wick percentage for bull pin bar.
Returns: (bool) True if there is a sign of strength (Pseudo DownThrust), otherwise false.
S_NoSupply(_bullPinBarMaxBody, _bullPinBarMinWick)
Determines if there is a sign of strength (No Supply).
Parameters:
_bullPinBarMaxBody (simple float) : (float) The maximum body percentage for bull pin bar.
_bullPinBarMinWick (simple float) : (float) The minimum wick percentage for bull pin bar.
Returns: (bool) True if there is a sign of strength (No Supply), otherwise false.
W_UpThrust(_data, _bearPinBarMaxBody, _bearPinBarMinWick)
Determines if there is a sign of weakness (UpThrust).
Parameters:
_data (map) : (map) The data map with volume and spread levels.
_bearPinBarMaxBody (simple float) : (float) The maximum body percentage for bear pin bar.
_bearPinBarMinWick (simple float) : (float) The minimum wick percentage for bear pin bar.
Returns: (bool) True if there is a sign of weakness (UpThrust), otherwise false.
W_BuyingClimax(_data, _rejectionWick)
Determines if there is a sign of weakness (Buying Climax).
Parameters:
_data (map) : (map) The data map with volume and spread levels.
_rejectionWick (simple float) : (float) The rejection wick percentage.
Returns: (bool) True if there is a sign of weakness (Buying Climax), otherwise false.
W_NoEffortBullishResult()
Determines if there is a sign of weakness (No Effort Bullish Result).
Returns: (bool) True if there is a sign of weakness (No Effort Bullish Result), otherwise false.
W_BullishEffortNoResult()
Determines if there is a sign of weakness (Bullish Effort No Result).
Returns: (bool) True if there is a sign of weakness (Bullish Effort No Result), otherwise false.
W_InverseUpThrust(_data, _bullPinBarMaxBody, _bullPinBarMinWick)
Determines if there is a sign of weakness (Inverse UpThrust).
Parameters:
_data (map) : (map) The data map with volume and spread levels.
_bullPinBarMaxBody (simple float) : (float) The maximum body percentage for bull pin bar.
_bullPinBarMinWick (simple float) : (float) The minimum wick percentage for bull pin bar.
Returns: (bool) True if there is a sign of weakness (Inverse UpThrust), otherwise false.
W_FailedBuyingClimax()
Determines if there is a sign of weakness (Failed Buying Climax).
Returns: (bool) True if there is a sign of weakness (Failed Buying Climax), otherwise false.
W_BearOutsideReversal(_data)
Determines if there is a sign of weakness (Bear Outside Reversal).
Parameters:
_data (map) : (map) The data map with volume and spread levels.
Returns: (bool) True if there is a sign of weakness (Bear Outside Reversal), otherwise false.
W_EndOfRisingMarket(_data)
Determines if there is a sign of weakness (End of Rising Market).
Parameters:
_data (map) : (map) The data map with volume and spread levels.
Returns: (bool) True if there is a sign of weakness (End of Rising Market), otherwise false.
W_PseudoUpThrust(_bearPinBarMaxBody, _bearPinBarMinWick)
Determines if there is a sign of weakness (Pseudo UpThrust).
Parameters:
_bearPinBarMaxBody (simple float) : (float) The maximum body percentage for bear pin bar.
_bearPinBarMinWick (simple float) : (float) The minimum wick percentage for bear pin bar.
Returns: (bool) True if there is a sign of weakness (Pseudo UpThrust), otherwise false.
W_NoDemand(_bearPinBarMaxBody, _bearPinBarMinWick)
Determines if there is a sign of weakness (No Demand).
Parameters:
_bearPinBarMaxBody (simple float) : (float) The maximum body percentage for bear pin bar.
_bearPinBarMinWick (simple float) : (float) The minimum wick percentage for bear pin bar.
Returns: (bool) True if there is a sign of weakness (No Demand), otherwise false.
N_QuietDoji(_dojiBarMaxBody)
Determines if there is a neutral signal (Quiet Doji).
Parameters:
_dojiBarMaxBody (simple float) : (float) The maximum body percentage for doji bar.
Returns: (bool) True if there is a neutral signal (Quiet Doji), otherwise false.
N_BalancedDoji(_data, _dojiBarMaxBody)
Determines if there is a neutral signal (Balanced Doji).
Parameters:
_data (map) : (map) The data map with volume and spread levels.
_dojiBarMaxBody (simple float) : (float) The maximum body percentage for doji bar.
Returns: (bool) True if there is a neutral signal (Balanced Doji), otherwise false.
N_StrongDoji(_dojiBarMaxBody)
Determines if there is a neutral signal (Strong Doji).
Parameters:
_dojiBarMaxBody (simple float) : (float) The maximum body percentage for doji bar.
Returns: (bool) True if there is a neutral signal (Strong Doji), otherwise false.
N_QuietSpinningTop(_spinningTopBarMinWicks, _spinningTopBarEmaLength)
Determines if there is a neutral signal (Quiet Spinning Top).
Parameters:
_spinningTopBarMinWicks (simple float) : (float) The minimum wicks percentage for spinning top bar.
_spinningTopBarEmaLength (simple int) : (int) The length for EMA calculation.
Returns: (bool) True if there is a neutral signal (Quiet Spinning Top), otherwise false.
N_BalancedSpinningTop(_data, _spinningTopBarMinWicks, _spinningTopBarEmaLength)
Determines if there is a neutral signal (Balanced Spinning Top).
Parameters:
_data (map) : (map) The data map with volume and spread levels.
_spinningTopBarMinWicks (simple float) : (float) The minimum wicks percentage for spinning top bar.
_spinningTopBarEmaLength (simple int) : (int) The length for EMA calculation.
Returns: (bool) True if there is a neutral signal (Balanced Spinning Top), otherwise false.
N_StrongSpinningTop(_spinningTopBarMinWicks, _spinningTopBarEmaLength)
Determines if there is a neutral signal (Strong Spinning Top).
Parameters:
_spinningTopBarMinWicks (simple float) : (float) The minimum wicks percentage for spinning top bar.
_spinningTopBarEmaLength (simple int) : (int) The length for EMA calculation.
Returns: (bool) True if there is a neutral signal (Strong Spinning Top), otherwise false.
N_QuietHighWave(_highWaveBarMinBody, _highWaveBarMinWick, _highWaveBarBars)
Determines if there is a neutral signal (Quiet High Wave).
Parameters:
_highWaveBarMinBody (simple float) : (float) The minimum body percentage for high wave bar.
_highWaveBarMinWick (simple float) : (float) The minimum wick percentage for high wave bar.
_highWaveBarBars (simple int) : (int) The number of bars for comparison.
Returns: (bool) True if there is a neutral signal (Quiet High Wave), otherwise false.
N_BalancedHighWave(_data, _highWaveBarMinBody, _highWaveBarMinWick, _highWaveBarBars)
Determines if there is a neutral signal (Balanced High Wave).
Parameters:
_data (map) : (map) The data map with volume and spread levels.
_highWaveBarMinBody (simple float) : (float) The minimum body percentage for high wave bar.
_highWaveBarMinWick (simple float) : (float) The minimum wick percentage for high wave bar.
_highWaveBarBars (simple int) : (int) The number of bars for comparison.
Returns: (bool) True if there is a neutral signal (Balanced High Wave), otherwise false.
N_StrongHighWave(_highWaveBarMinBody, _highWaveBarMinWick, _highWaveBarBars)
Determines if there is a neutral signal (Strong High Wave).
Parameters:
_highWaveBarMinBody (simple float) : (float) The minimum body percentage for high wave bar.
_highWaveBarMinWick (simple float) : (float) The minimum wick percentage for high wave bar.
_highWaveBarBars (simple int) : (int) The number of bars for comparison.
Returns: (bool) True if there is a neutral signal (Strong High Wave), otherwise false.
N_Consolidation(_data, _consolidationBarSpread, _consolidationBarBars)
Determines if there is a neutral signal (Consolidation).
Parameters:
_data (map) : (map) The data map with volume and spread levels.
_consolidationBarSpread (simple float) : (float) The spread percentage for consolidation bar.
_consolidationBarBars (simple int) : (int) The number of bars for comparison.
Returns: (bool) True if there is a neutral signal (Consolidation), otherwise false.

Net Buying/Selling Flows Toolkit [AlgoAlpha]🌟📊 Introducing the Net Buying/Selling Flows Toolkit by AlgoAlpha 📈🚀
🔍 Explore the intricate dynamics of market movements with the Net Buying/Selling Flows Toolkit designed for precision and effectiveness in visualizing money inflows and outflows and their impact on asset prices.
🔀 Multiple Display Modes : Choose from "Flow Comparison", "Net Flow", or "Sum of Flows" to view the data in the most relevant way for your analysis.
📏 Adjustable Unit Display : Easily manage the magnitude of the values displayed with options like "1 Billion", "1 Million", "1 Thousand", or "None".
🔧 Lookback Period Customization : Tailor the sum calculation window with a configurable lookback period, applicable in "Sum of Flows" mode.
📊 Deviation Thresholds : Set up lower and upper deviation thresholds to identify significant changes in flow data.
🔄 Reversal Signals and Deviation Bands : Enable signals for potential reversals and visualize deviation bands for comparative analysis.
🎨 Color-coded Visualization : Distinct colors for upward and downward movements make it easy to distinguish between buying and selling pressures.
🚀 Quick Guide to Using the Net Buying/Selling Flows Toolkit :
🔍 Add the Indicator : Add the indicator to you favorites. Customize the settings to fit your trading requirements.
👁️🗨️ Data Analysis : Compare the trend of Buying and Selling to help indicate whether bulls or bears are in control of the market. Utilize the different display modes to present the data in different form to suite your analysis style.
🔔 Set Alerts : Activate alerts for reversal conditions to keep abreast of significant market movements without having to monitor the charts constantly.
🌐 How It Works :
The toolkit processes volume data on a lower timeframe to distinguish between buying and selling pressures based on intra-bar price closing higher or lower than it opened. It aggregates these transactions and finds the net selling and buying that took place during that bar, offering a clearer view of market fundamentals. The indicator then plots this data visually with multiple modes including comparisons between buying/selling and the net flow of the asset. Deviation thresholds help in identifying significant changes, allowing traders to spot potential buying or selling opportunities based on the money flow dynamics. The "Sum of Flows" mode is unique from other trend following indicators as it does not determine trend based on price action, but rather based on the net buying/selling. Therefore in some cases the "Sum of Flows" mode can be a leading indicator showing bullish/bearish net flows even before the prices move significantly.
Embark on a more informed trading journey with this dynamic and insightful tool, tailor-made for those who demand precision and clarity in their trading strategies. 🌟📉📈

Smart Money Liquidity Heatmap [AlgoAlpha]🌟📈 Introducing the Smart Money Liquidity Heatmap by AlgoAlpha! 🗺️🚀
Dive into the depths of market liquidity with our innovative Pine Script™ indicator designed to illuminate the trading actions of smart money! This meticulously crafted tool provides an enhanced visualization of liquidity flow, highlighting the dynamics between smart and retail investors directly on your chart! 🌐🔍
🙌 Key Features of the Smart Money Liquidity Heatmap:
🖼️ Visual Clarity: Uses vibrant heatmap colors to represent liquidity concentrations, making it easier to spot significant trading zones.
🔧 Customizable Settings: Adjust index periods, volume flow periods, and more to tailor the heatmap to your trading strategy.
📊 Dynamic Ratios: Computes the ratio of smart money to retail trading activity, providing insights into who is driving market movements.
👓 Transparency Options: Modify color intensity for better visibility against various chart backgrounds.
🛠 How to Use the Smart Money Liquidity Heatmap:
1️⃣ Add the Indicator:
Add the indicator to favourites. Customize settings to align with your trading preferences, including periods for index calculation and volume flow.
2️⃣ Market Analysis:
Monitor the heatmap for high liquidity zones signalled by the heatmap. These are potential areas where smart money is actively engaging, providing crucial insights into market dynamics.
Basic Logic Behind the Indicator:
The Smart Money Liquidity Heatmap utilizes the Smart Money Interest Index Indicator and operates by differentiating between the trading behaviors of informed (smart money) and less-informed (retail) traders. It calculates the differences between specific volume indices—Positive Volume Index (PVI) for retail investors and Negative Volume Index (NVI) for institutional players—and their respective moving averages, highlighting these differences using the Relative Strength Index (RSI) over user-specified periods. This calculation generates a ratio that is then normalized and compared against a threshold to identify areas of high institutional trading interest, visually representing these zones on your chart as vibrant heatmaps. This enables traders to visually identify where significant trading activities among smart money are occurring, potentially signalling important buying or selling opportunities.
🎉 Elevate your trading experience with precision, insight, and clarity by integrating the Smart Money Liquidity Heatmap into your toolkit today!

Effective Volume Z-ScoreThis indicator aims at responding the question: is the current trend supported by volume?
The concept and formula
The central concept is the Effective Volume, calculated as follow:
effectiveVolume = volume * (close - open) / (high - low)
Then the Effective Volume Z-Score indicator is calculated by smoothing the effective volume and applying the z-score function:
zscore(x) = (x - mean) / stdev
Essentially, the indicator's value represents the number of standard deviations of the effective volume away from the mean.
How to use it
This indicator should be used for trend confirmation.
For an uptrend, the bigger the indicator value, the greater the volume support, while for a downtrend, the lower the indicator value, the greater the volume support.
Divergences are also important, as with every volume indicator.

Volume Breakout [Afnan]Introducing the Relative Volume / Volume Breakout Multiplier (RVI) , RVI is specifically designed for traders who incorporate volume breakout analysis into their trading strategies, particularly breakout traders.
This indicator provides a unique perspective on volume dynamics by quantifying the extent of volume breakouts in relation to the Simple Moving Average (SMA). It offers an upgraded version of the default volume indicator on TradingView, with the added feature of Relative Volume.
For example, if the volume SMA is 100M and the current volume is 200M, the indicator will return a breakout number of 2.0, indicating that the current volume is twice that of the volume SMA. Conversely, if the volume SMA is 100M and the current volume is 50M, the indicator will return a value of 0.50, indicating that the current volume is half of the volume SMA.
This tool can be a very helpful for breakout traders, helping them identify potential trading opportunities and assess volume strength more effectively. this indicator is a must-have in the toolkit of any trader who focuses on volume breakout analysis.
Remember, every tool we use, every analysis we perform, is a step towards becoming better traders. So, let’s embrace this journey of continuous learning and improvement together. As the saying goes, “The only limit to our realization of tomorrow will be our doubts of today." Let’s step into the future with confidence, armed with the right tools and the right mindset.
Lastly, a big thank you for your support, your likes, and your comments. They mean a lot! If you have any questions, feel free to ask. Together, let’s make trading a rewarding experience!

Volume Flow Oscillator (VFO)I created the Volume Flow Oscillator (VFO) to explore the intricate interplay between volume and price movements over a specific lookback period. This tool contrasts volumes that move in sync with the price against those that move in opposition, signaling potential overbought or oversold territories. To determine the direction, I compare the current price to its value four periods back, shedding light on underlying bullish or bearish momentum. The VFO enriches my analysis and decision-making by offering a detailed perspective on how volume trends correlate with price changes. Its color-coded visuals are crucial for highlighting optimal trading points based on volume dynamics.

Relative Volume Candles [QuantVue]In the words of Dan Zanger, "Trying to trade without using volume is like trying to drive a few hundred miles without putting gas in your tank. Trying to trade without chart patterns is like leaving without having an idea how to get there!"
Volume tends to show up at the beginning and the end of trends. As a general rule, when a stock goes up on low volume, it's seen as negative because it means buyers aren't committed. When a stock goes down on low volume, it means that not many people are trying to sell it, which is positive.
The Relative Volume Candles indicator is based on the Zanger Volume Ratio and designed to help identify key volume patterns effortlessly, with color coded candles and wicks.
The indicator is designed to be used on charts less than 1 Day and calculates the average volume for the user selected lookback period at the given time of day. From there a ratio of the current volume vs the average volume is used to determine the candle’s colors.
The candles wicks are color coded based on whether or not the volume ratio is rising or falling.
So when is it most important to have volume? When prices break out of a consolidation pattern like a bull flag or cup and handle pattern, volume plays a role. When a stock moves out of a range, volume shows how committed buyers are to that move.
Note in order to see this indicator you will need to change the visual order. This is done by selecting the the 3 dots next to the indicator name, scrolling down to visual order and selecting bring to front.
Indicator Features
🔹Selectable candle colors
🔹Selectable ratio levels
🔹Custom lookback period***
***TradingView has a maximum 5,000 bar lookback for most plans. If you are on a lower time frame chart and you select a lookback period larger than 5,000 bars the indicator will not show and you will need to select a shorter lookback period or move to a higher time frame chart.
Give this indicator a BOOST and COMMENT your thoughts!
We hope you enjoy.
Cheers!

Bull Vs Bear Visible Range VP [Kioseff Trading]Hello!
This Script “Bull vs Bear Visible Range VP” Calculates Bull & Bear Volume Profiles for the Visible Range Alongside a Delta Ladder for the Visible Period!
Features
Volume Profile Anchored to Visible Range
Delta Ladder Anchored to Visible Range
Bull vs Bear Profiles!
Standard Poc and Value Area Lines, in Addition to Separated POCs and Value Area Lines for Bull Profiles and Bear Profiles
Configurable Value Area Target
Curved Profiles
Up to 9999 Profile Rows per Visible Range
Stylistic Options for Profiles
This Script Generates Bull vs. Bear Volume Profiles for the Visible Range!
Up to 9999 Volume Profile Levels (Price Levels) Can Be Calculated for Each Profile, Thanks to the New Polyline Feature, Allowing For Less Aggregation / More Precision of Volume at Price and Volume Delta.
Bull vs Bear Profiles
The Image Above Shows Primary Functionality!
Green Profiles = Buying Volume
Red Profiles = Selling Volume
Bullish & Bearish Pocs for the Visible Range Are Displayable!
Profiles Can Be Anchored on the Left Side for a More Traditional Look.
The indicator is robust enough to calculate on "small price periods", or for a price period spanning your entire chart fully zoomed out!
That’s About It :D
This Indicator Is Part of a Series Titled “Bull vs. Bear” - A Suite of Profile-Like Indicators I Will Be Releasing Over Coming Days. Thanks for Checking This Out!
If You Have Any Suggestions Please Feel Free to Share!

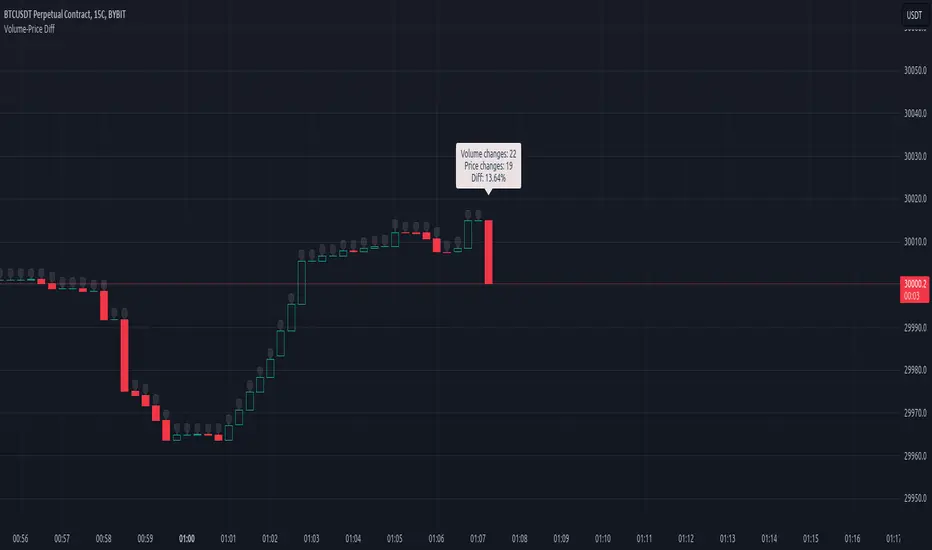
Volume-Price DiffScript is designed to analize volatility in real-time.
Once added to chart, script starting to collect 2 things:
Ticks count (tc)
Price changing ticks count (pctc)
The pctc/tc ratio may be interpret as a volatility measure.
Label above real-time bar shows:
Ticks count
Price changing ticks count
Ratio between (2) and (1) in percents
Using this indicator trader may detect volatility spikes.
More the "Diff" - less the volatility and vice versa.
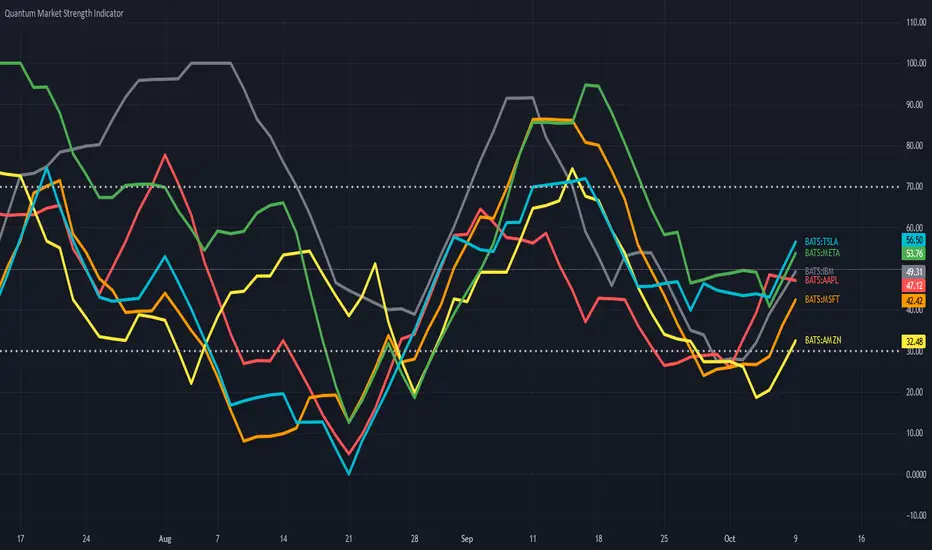
Quantum Market Strength Indicator (MSI)The Market Strength Indicator (MSI) is yet another in our stable of volume-based indicators, and as such, is a must-have tool for trading virtually any type of market and across a myriad of applications from trend trading to swing trading, scalping, and much more. While its sister indicator, the Currency Strength Indicator (CSI), helps you analyze which currencies are oversold, overbought, correlating, and trending, the MSI or Market Strength Indicator does this also, but in this case, for all markets, including stocks, ETFs, futures, and cryptocurrencies, but with one key difference – VOLUME.
As with our core methodology of volume price analysis, volume adds an entirely new dimension to trading analysis as it reveals the driving pressure behind the price action, be it strong or weak, which are all factored into the algorithm that drives the Market Strength Indicator. But with the MSI indicator, its use and application is only limited by your imagination.
For example, we can use it to see which markets are correlating and which are not so that we might use it as an intraday tool for index futures. And, of course, with knowledge gained from the stock trading and investing program, we could then further validate any analysis by setting each against the top five market cap stocks, for confirmation of strength and to give us more confidence in trading an index future.
And not just index futures, but any futures you care to consider, such as energy, metals, softs, currencies or anything else.
For day traders of stocks, you might wish to see which are correlating with one another and which are not, for example, if you are pairs trading, and also whether a particular stock is moving with the primary futures index. If not, this may be a warning sign. And of course, for ETF traders, we have the SPY, a host of ETFs, and alongside them, the sectors, such as the XLK, the XLE, and more, giving you an instant and powerful insight into sentiment across the entire market complex.
The Market Strength Indicator has much to offer; whether you are a stock investor or day trading scalper, index or ETF trader, swing trader or trend trader, it is all here as the indicator signals in a clear and intuitive way when a stock, future or ETF is overbought or oversold in all timeframes, giving you that potent insight into potential reversals from strong to weak and back again. If you enjoy getting into a trend early and trading reversals, then this is the indicator for you, but if you prefer trading trends – no problem, just jump aboard once the move has some momentum and is underway as displayed by the steepness of the line on the indicator.
It’s all here and so much more, from market correlations to market strength and weakness and in all the timeframes from seconds to months.
And just like its sister indicator, the CSI, the MSI is an oscillator that moves seamlessly from overbought to oversold and back again between a value of 100 at the top and zero at the bottom, with each instrument or market represented with a single-colored line. To help further, we’ve included two regions on the indicator to represent these states at 70 and 30, respectively, but you can change these accordingly and perhaps extend them further to 80 and 20. These levels are purely intended as guides to help provide additional information as to the market state and a potential reversal in due course.
Now, in a single indicator, you have the opportunity to gauge sentiment across multiple markets, whether these are correlating or not, and from there develop a myriad of trading opportunities, or alternatively give you that all-important confidence to dive in, or maintain an existing position. Through its unique algorithm based on volume, it is another indicator only limited by your imagination, and like all our other indicators, one we urge you to use in multiple timeframes.
Quantum VRSIThe VRSI indicator is another in the suite of volume indicators we have developed and one that complements our volume price analysis methodology perfectly. and was developed out of a desire to build further on our cornerstone of VPA by peeling back the layers of volume and considering the relative aspect of volume. Hence, the acronym of Volume Relative Strength Index indicator encapsulates what the indicator is all about.
By analyzing relative volume, we are able to see a visual representation of the pressure in a trend, or indeed the lack of pressure, and in doing so, present in a clear, intuitive, and colorful way whether the trend we are trading or considering joining is being driven with constant or rising pressure as it develops. If so, the indicator gives us that all-important ingredient: confidence—namely, the confidence to continue maintaining the position for as long as possible. However, equally important is when we see a trend that is tiring, with falling pressure, sending a strong signal it is time to close out. Alternatively, when there is little or no pressure in the trend, this is a signal to wait and be patient.
These signals are delivered in a variety of ways, primarily through a color change sequence of brighter or darker colors, but equally importantly, based on the height of each pressure bar and its relationship to its neighbor or groups of bars. And herein lies the close relationship to the volume price analysis methodology since the interpretation of both is about judging bars against one in terms of confirmation of trends, such as rising volume and rising pressure bars, or alternatively falling volume and falling pressure bars signaling that the trend is weakening.
The Volume Relative Strength Index indicator, or VRSI, embodies the core concept of volume-price analysis. It blends trading volume data with price to create an indicator for all the various markets and instruments, whether stocks, ETFs, futures, forex, or cryptocurrencies. The result is an intuitive visual representation of the market’s underlying bullish and bearish pressure in the form of an oscillating histogram with varying colors, with the central fulcrum at zero giving a clear indication when sentiment is shifting from bullish to bearish, or vice versa.
Now, for the first time, you can see the strength of the trend represented visually and clearly based on our two leading indicators of relative volume and price, giving you that essential ingredient we all seek: confidence. And just as with all our other indicators, we urge you to use it in multiple timeframes.

Quantum VWAP ProThe VWAP indicator is another of our suite of volume indicators and one which was first referred to in 1988 when it appeared in an article entitled “The Total Cost Of Transactions On The NYSE” in the March edition of the Journal Of Finance from that year, which went on to explain its importance, particularly from an institutional perspective, which underpins its significance in appreciating the power and importance of this indicator.
In many ways, it is akin to the volume price analysis methodology itself, as we are merely attempting to follow the footprints in the sand left by their passage and described by volume. The same is true here, but in this case, we are following the institutions in much the same way.
Originally, the VWAP indicator was developed as a benchmark to measure whether an institutional customer received a fair execution of their order by the broker buying and selling on their behalf. The difference between the reported price and the VWAP gave the customer a benchmark against which to judge whether they had received a fair price or not. A portfolio manager for example, wants to know how the price they paid compared to the average price of the stock during the time it took to fill the order. If an order is filled at a worse price than the VWAP, it raises questions as to the ability of the broker. If the broker purchased a million shares at $40.50 and the VWAP during this time was at $40.70, the customer is likely to be happy since they paid 20 cents less than ‘fair value’. Equally, if the stock were purchased above, at, say $40.90 per share, the customer would consider this a poor trade, paying well above the fair value price at the VWAP.
The simplicity of this easy-to-understand benchmark, which creates this fair value price concept, has led to its wholehearted adoption amongst the institutions, and moreover, why algorithmic VWAP orders now dominate institutional market activity. A huge percentage of institutional orders are executed as VWAP orders, which raises two key questions. First of all, why, and second, how can we benefit from using the indicator?
If we start with the why, according to reports from the leading market makers, almost 40% of orders are now executed on this basis as they attempt to obtain a buy or sell price close to or better than the VWAP during the time it takes to complete the buy or sell order. These orders, therefore, help to hugely reinforce the importance of the VWAP since it is the guiding principle on which these orders are based. Even Warren Buffet uses VWAP, as evidenced when he sold his entire position in Southwest Airlines over two days, holding 2.3 million shares.
This highlights the key issues for any large institutional investor involving the price. If executed in a single order, an order to buy a large block of shares would almost certainly swamp the market, raising the price exponentially and, in addition, overwhelm the average volume traded in the day.
It is this issue of putting the price up against their own buying or conversely seeing the price fall as a result of their own selling that leads to the parent and child order scenario where significant block orders are broken into a multitude of smaller orders, which are duly executed over days, weeks or months. It is this aspect of institutional order execution that makes the VWAP such a potent indicator.
However, at Quantum Trading, we don’t just build a single indicator and leave it at that! We always take them to another level, and here we have done the same, bundling together a total of five indicators into one amazing value package so you can select your favorite from those on offer. The reason for this is we recognize the different ways the volume-weighted average price is used, which is why we offer a total of FIVE variants to choose from, and these are as follows:
VWAP – Volume Weighted Average Price
MVWAP – Moving Volume Weighted Average Price
AVWAP – Anchored Volume Weighted Average Price
TWAP – Time Weighted Average Price
Interday Volume Weighted Average Price
All five variants include the option to display upper and lower bands that act as envelopes above and below the VWAP based on standard deviation, which you can adjust and set yourself. These price envelopes become essential dynamic support and resistance levels, which can help predict the extremes of price action as it oscillates around the VWAP from the fastest to the slowest timeframes and everything in between.
All five indicators are packaged into one powerful indicator, which we have named the Quantum VWAP Pro indicator for obvious reasons, and as you would expect, it works in all markets and instruments, whether stocks, futures, ETFs, forex or cryptocurrencies.
Finally, as with all our indicators, we recommend you use it in multiple timeframes.

Unusual Market Volume DetectorIntroduction
Price usually moves in lockstep with the volume trends i.e. price goes higher when there is buying and it goes down when there is selling in the market. But sometimes, the market behaves unusually i.e. Price and volume move in opposite directions. This indicator identifies precisely this divergent behavior in the market!
This script analyses the volume trends by utilizing changes in On Balance Volume (OBV) for the instrument and compares it with the price trend to color the lower panel on your chart window. The color changes as the direction of the OBV trend changes from Up to Down or vice versa. If there is a divergence between the price trend and volume trend, the color will switch to Purple.
Divergence in volume and price trends typically indicate a battle between supply and demand. This may coincide with a change in market direction as well. It is important to know which side won after this battle, as the market will follow that side.
This tool will alert traders of unusual market volume behavior and when both price & volume trends are in sync.
Features
A Purple color in the lower panel indicates that the Volume and Price trends are diverging and are moving in the opposite direction
A Green color in the lower panel indicates that the Volume is trending higher supporting bullish price action
A Red color in the lower panel indicates that the Volume is trending lower supporting bearish price action
How to use the Indicator while Trading?
When the Volume trend matches the price action ( Trend ), you have confirmation of your trade bias. Therefore when you are taking Long trades, you would want to see a Green color in the lower panel and a Red color when you are going Short.
When a Divergence is identified by the tool, as Purple color in the lower panel, Trader can take the following steps:
Take profit or partially close the position if you are in a Trade as this divergence presents
uncertainty
Watch for which color comes up after divergence, that side of the market has a higher
probability of prevailing. For example, a Red color indicates Selling in the market and vice
versa.
Divergence usually precedes a market direction change and therefore Trader can take this
into account when planning Trade bias and position size. Please note a divergence does
not always precede a reversal in the market and can be a temporary phenomenon with no
effect on the price action.
Basic Set-Up
Add the Indicator to the chart
You can change the default colors for Buying Volume, Selling Volume, and Divergence
Use the “Regular Trading Hours” Session in the Chart Settings for the most effective analysis
Please note : On-Balance Volume is a leading indicator but it doesn't provide specific information on exactly what happened or why. Also, a large spike in a single day may throw off the On Balance Volume for a while. Therefore we are focusing on its trend and comparing it with Price Trends for better effectiveness.
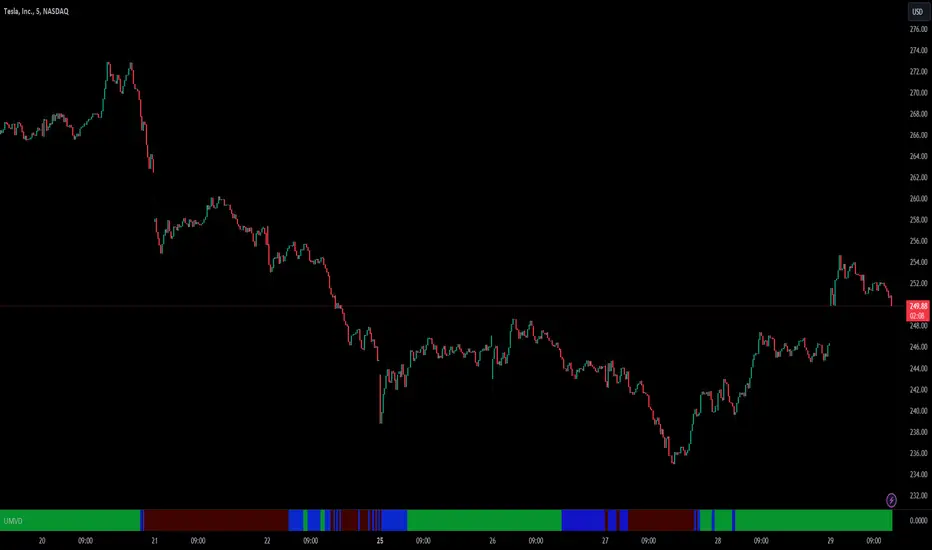
Zaree - Bull & Bear Volume VoidThe "Zaree - Bull & Bear Volume Void" (BBVV) indicator is a versatile tool designed to help traders assess the dynamics of bull and bear power in the market, with a focus on volume-based analysis. This indicator offers a range of features that aid in identifying potential shifts in market sentiment and strength.
Details of the Indicator:
Volume Void Color Settings: This indicator allows you to customize the colors used for different conditions, such as strong bull areas, slowing bull areas, strong bear areas, and slowing bear areas. These colors play a crucial role in visualizing the indicator's output.
Volume Void Settings: The BBVV indicator provides options for selecting specific volume void functions, which include "Relative Volume Comparison," "Percentage of Average Volume," "Fixed Volume Threshold," "Volatility-Adjusted Volume," "Compare to Previous Volume Bars," "Volume Percentile Rank," and "Market Session Comparison." Each function has its own criteria for evaluating volume conditions.
Void Bull Sensitivity and Void Bear Sensitivity: These are key parameters in the settings. The values you choose for void bull sensitivity and void bear sensitivity will significantly impact the background color displayed by the indicator. Properly configuring these values is crucial for the indicator's effectiveness.
Moving Average Settings: You can specify the source and length of moving averages used in the indicator. This helps in smoothing out data and providing a clearer picture of bull and bear power.
Void Color Background Conditions: The indicator dynamically changes the background color of the chart based on the current market conditions. It takes into account bull and bear power, as well as the configured sensitivity levels to determine whether the market is in a strong or slowing bull/bear phase.
MACD and Signal Lines: The indicator also displays MACD and signal lines on the chart, helping traders identify potential bullish and bearish crossovers.
Histogram Bars: Histogram bars are used to represent the strength of bull and bear power. Above-zero bars indicate bullish strength, while below-zero bars indicate bearish strength.
How to Use the Indicator:
Begin by customizing the color settings for different market conditions to your preference.
Select a volume void function that aligns with your trading strategy and objectives.
Configure the void bull sensitivity and void bear sensitivity values carefully. These values should reflect your desired sensitivity to volume conditions.
Choose the source and length of moving averages based on your analysis requirements.
Pay attention to the background color of the chart. It will change dynamically based on the current market conditions, providing insights into the strength of bull and bear power.
Observe the MACD and signal lines for potential bullish or bearish crossovers, which can be used as additional confirmation signals.
Interpret the histogram bars to gauge the strength of bull and bear power.
Example of Usage:
As a swing trader with a focus on volume analysis, you can use the BBVV indicator to enhance your trading decisions. Here's an example of how you might use the indicator:
Select "Relative Volume Comparison" as the volume void function to assess volume relative to a simple moving average.
Configure void bull sensitivity and void bear sensitivity to match your risk tolerance and trading style.
Choose "SMA" as the moving average type with a suitable length.
Pay attention to the background color changes in the chart. Strong bull areas may indicate potential bullish opportunities, while strong bear areas may signal bearish conditions.
Monitor the MACD and signal lines for potential crossovers, aligning them with the background color to validate your trading decisions.
Use the histogram bars to assess the strength of bull and bear power, helping you gauge market sentiment.
Remember that the BBVV indicator is a valuable tool to complement your trading strategy. It provides insights into volume dynamics and market conditions, allowing you to make informed trading choices.
Be sure to adjust the indicator settings according to your trading preferences and always consider the broader market context in your analysis.

Volume Profile - BearJust another Volume Profile but you can fit into your chart better by moving back and forth horizontally. also note you can fix the number of bars to show the volume by that way you can use a fib retracment to line up high/low volume nodes with fib levels... see where price as bad structure. or just play with the colors to make a cool gradient?
Volume Profile is a technical analysis tool used by traders to analyze the distribution of trading volume at different price levels within a specified time frame. It helps traders identify key support and resistance levels, potential areas of price reversals, and areas of high trading interest. Here's how to read Volume Profile on a trading chart:
1. **Choose a Time Frame**: Decide on the time frame you want to analyze. Volume Profile can be applied to various time frames, such as daily, hourly, or even minute charts. The choice depends on your trading style and goals.
2. **Plot the Volume Profile**: Once you have your chart open, add the Volume Profile indicator. Most trading platforms offer this tool. It typically appears as a histogram or a series of horizontal bars alongside the price chart.
3. **Identify Key Elements**:
a. **Value Area**: The Value Area represents the price range where the majority of trading volume occurred. It is often divided into three parts: the Point of Control (POC) and the upper and lower value areas. The POC is the price level where the most trading activity occurred and is considered a significant support or resistance level.
b. **High-Volume Nodes**: High-volume nodes are price levels where there was a significant amount of trading volume. These nodes can act as support or resistance levels because they represent areas where many traders had their positions.
c. **Low-Volume Areas**: Conversely, low-volume areas are price levels with little trading activity. These areas may not provide strong support or resistance because they lack significant trader interest.
4. **Interpretation**:
- If the price is trading above the POC and the upper value area, it suggests bullish sentiment, and these levels may act as support.
- If the price is trading below the POC and the lower value area, it suggests bearish sentiment, and these levels may act as resistance.
- High-volume nodes can also act as support or resistance, depending on the price's current position relative to them.
5. **Confirmation**: Volume Profile should be used in conjunction with other technical analysis tools and indicators to confirm trading decisions. Consider using trendlines, moving averages, or other price patterns to validate your trading strategy.
6. **Adjust for Different Time Frames**: Keep in mind that Volume Profile analysis can yield different results on different time frames. For example, a support level on a daily chart may not hold on a shorter time frame due to intraday volatility.
7. **Practice and Experience**: Like any trading tool, reading Volume Profile requires practice and experience. Analyze historical charts, paper trade, and refine your strategies over time to gain proficiency.
8. **Stay Informed**: Stay updated with market news and events that can impact trading volume. Sudden news can change the significance of volume levels.

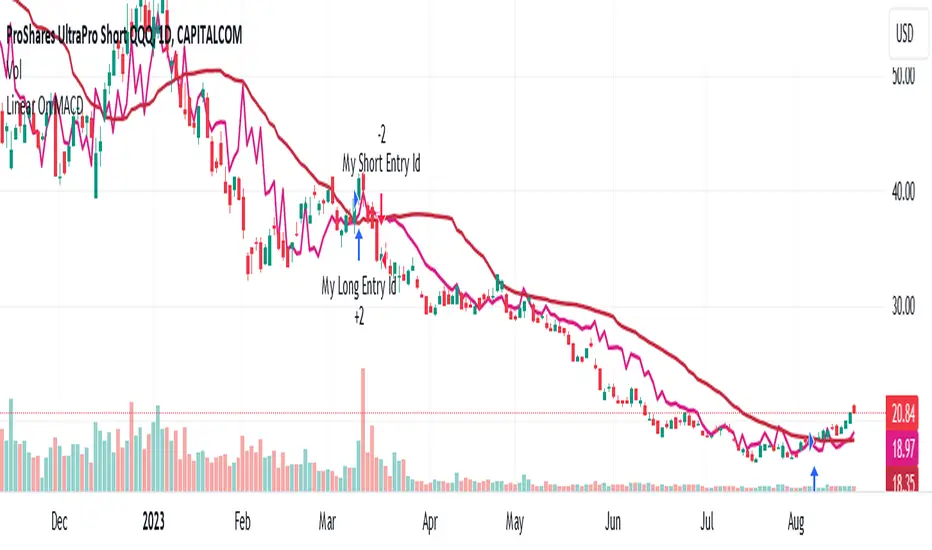
Linear On MACDUnlocking the Magic of Linear Regression in TradingView
In the ever-evolving world of financial markets, traders and investors seek effective tools to gauge price movements, make informed decisions, and achieve their financial goals. One such tool that has proven its worth over time is linear regression, a mathematical concept that has found its way into technical analysis and trading strategies. In this blog post, we will explore the magic behind linear regression, delve into its history, and understand how it's widely used as a technical indicator.
The Birth of Linear Regression: From Mathematics to Trading
Linear regression is a statistical method that aims to model the relationship between two variables by fitting a linear equation to observed data. The formula for a linear regression line is typically expressed as y = a + bx, where y is the dependent variable, x is the independent variable, a is the intercept, and b is the slope.
While the roots of linear regression trace back to the field of statistics, it didn't take long for traders and investors to recognize its potential in the financial world. By applying linear regression to historical price data, traders can identify trends, assess the relationship between variables, and even predict potential future price levels.
The Linear On MACD Strategy
Let's take a closer look at a powerful example of how linear regression is employed in a trading strategy right within TradingView. The "Linear On MACD" strategy harnesses the potential of linear regression in conjunction with the Moving Average Convergence Divergence (MACD) indicator. The goal of this strategy is to generate buy and sell signals based on the interactions between the predicted stock price and the MACD indicator.
Here's a breakdown of the strategy's components:
Calculation of Linear Regression: The strategy begins by calculating linear regression coefficients for the historical stock price based on volume. This helps predict potential future price levels.
Predicted Stock Price: The linear regression results are then used to plot the predicted stock price on the chart. This provides a visual representation of where the price could trend based on historical data.
Buy and Sell Signals: The strategy generates buy signals when certain conditions are met. These conditions include the predicted stock price being between the open and close prices, a rising MACD, and other factors that suggest a potential bullish trend. On the other hand, sell signals are generated based on MACD trends and predicted price levels.
Risk Management: The strategy also incorporates risk tolerance levels to determine entry and exit points. This ensures that traders take into account their risk appetite when making trading decisions.
Embracing the Magic of Linear Regression
As we explore the "Linear On MACD" strategy, we uncover the power of linear regression in aiding traders and investors. Linear regression, a mathematical marvel, seamlessly merges with technical analysis to provide insights into potential price movements. Its historical significance in statistics blends perfectly with the demands of modern financial markets.
Whether you're a seasoned trader or a curious investor, the Linear On MACD strategy exemplifies how a robust mathematical concept can be harnessed to make informed trading decisions. By embracing the magic of linear regression, you're tapping into a tool that continues to evolve alongside the financial world it empowers.
Disclaimer: The information provided in this blog post is for educational purposes only and does not constitute financial advice. Trading and investing carry risks, and it's important to conduct thorough research and consider seeking professional advice before making any trading decisions.
Exceptional Volume Spike - Potential Trend Reversal IndicatorWhat the Script Does:
The indicator aims to identify potential trend reversal points using the following steps:
Input Parameters: The script has three main input parameters that you can adjust:
relative_volume_threshold: This parameter sets the threshold for what is considered an exceptional volume spike in relation to the average volume.
ema_length: The length of the exponential moving average (EMA) used for smoothing calculations.
lookback_period: The period over which the script calculates potential support and resistance levels.
Relative Volume Calculation: The script calculates the relative volume by dividing the current volume by the average volume over the specified lookback_period.
Exceptional Volume Spikes: The script identifies exceptional volume spikes when the calculated relative volume exceeds the specified relative_volume_threshold.
EMA of Exceptional Volume Spikes: The script calculates the exponential moving average (EMA) of volume spikes. This EMA smooths out the volume spikes over the chosen ema_length.
Trend Direction: The script determines the trend direction using the crossovers of the EMA of exceptional volume spikes. If the EMA crosses above the EMA of regular volume (not spikes), it suggests a potential upward trend reversal. Conversely, if the EMA crosses below, it suggests a potential downward trend reversal.
Support and Resistance Levels: The script calculates potential support and resistance levels based on the highest high (hh) and lowest low (ll) over the specified lookback_period. These levels are then plotted on the chart.
Plot Shapes and EMA: The script plots triangle shapes below the bars for potential upward reversals and above the bars for potential downward reversals. Additionally, it plots the EMA of the closing price with different colors based on the trend direction.
By using this script as an indicator on your chart, you can visually assess potential trend reversal points based on exceptional volume spikes, trend direction crossovers, and support/resistance levels. Remember that this script serves as a tool to assist your analysis, and it's important to combine it with other technical analysis tools and strategies before making trading decisions.

nVPSA - Normalized Volume-Price Spread AnalysisNormalized volume-price spread analysis indicator can be helpfully tool in Tom's William metodology - VSA.
The indicator use normalized data by y/x(max) operation, where x(max) is the biggest value in range. Indicator separate spread to four levels - standard divation is separator.
The indicator graphically shows:
- normalized volume, visualized by wide column,
- normalized price spread, visualized by narrow column,
- linear regression calculated from normalized volume, visualised by crosses,
- linear regression from normalized price spread, visualized by circles.
Columns are marked by five colors according to standard deviation:
- blue xsecond deviation, xfourth deviation,
- gold when volume or price spread achive new maximum in analysis range.
Linear regression uses three colors:
- green when volume/spread is up bar by bar,
- red when volume/spread is down bar by bar,
- black when volume/spread is down two times bar by bar.
Additionally, it is posible to use alarm on Golden Bar. Colors and range values are editable from indicator settings.

ETN - Volume CandleHighlights candlestick based on volume data.
Indicator looks back and analyzing volume to find the volume bar with the largest numerical value
Indicator highlights the corresponding candlestick .
Indicator marks the high and low of that candlestick.
Users can adjust lookback period. Default is set to 50 .
Users can adjust how the indicator plots the high and low.
I currently have the high and low not being displayed on the charts until I come up with a better version.
On my chart, indicator colored the candlesticks YELLOW.
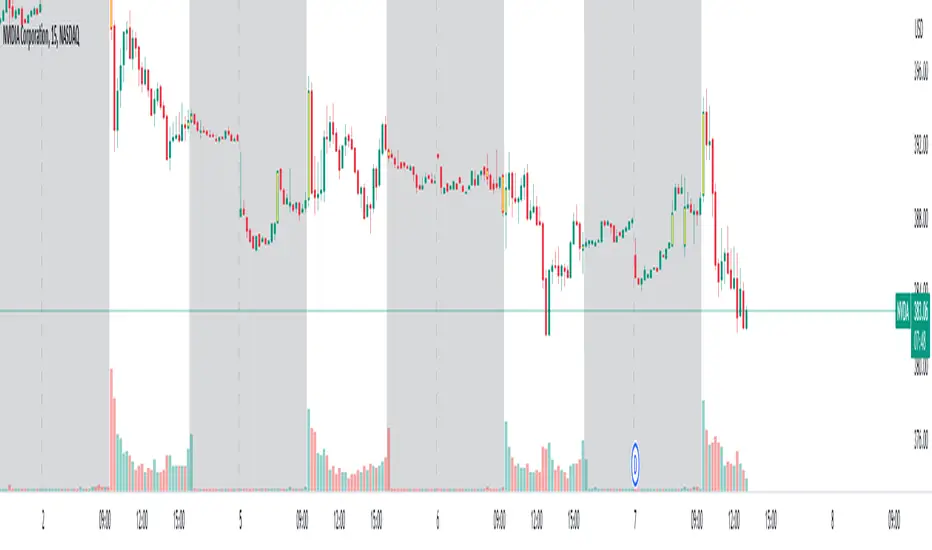
High Volume Candles Detector - Open Source CodeGreetings, fellow traders!
Throughout my trading career, I've been intrigued by the dynamic interplay between candlestick patterns and trading volume. This fascination led me to develop an open-source indicator to help illuminate these patterns for the broader trading community.
Upon researching the Public Library, I found that many indicators relating to candlestick/volume analysis are proprietary and not open-source. This discovery further fueled my commitment to contribute a free, accessible tool that traders of all levels can utilize in their technical analysis.
Thus, I am excited to present to you our High Volume Bars Indicator. A unique tool that I believe fills a gap in the Public Library. I truly hope you find it beneficial in your trading journey and that it empowers you to make more informed decisions.
Description:
The High Volume Bars Detector is designed to help traders identify bars with significantly higher volume than the average. Users can filter in the settings menu:
1) The length of the Simple Moving Average (SMA) for volume, allowing you to define the average volume over a specific number of bars.
2) The Volume Multiplier, a factor that determines how much greater the volume of a bar should be compared to the SMA to qualify as a high-volume bar.
3) The Lookback Period, a specified number of candles used as a comparative benchmark for identifying the highest volume.
4) If the Volume bar is green or red, so if the candle price is --> close > open or open > close
Examples to better understand the logic of the indicator:
1) Length of the Simple Moving Average (SMA) for Volume: This setting allows you to define the average volume over a specific number of bars. For instance, if you set the SMA length to 20, the indicator will calculate the average volume of the past 20 bars and use it as a baseline to identify high volume bars.
2) Volume Multiplier: This is a critical factor that determines the threshold for what constitutes a high-volume bar. If you set the volume multiplier to 2.0, for example, the indicator will flag any bar where the volume is twice the value of the SMA volume as a high-volume bar.
3) Lookback Period: This setting lets you specify the number of candles that the indicator should consider when determining the highest volume. For instance, if the lookback period is set to 14, the indicator will compare the volume of the current bar with the volumes of the previous 14 bars. If the current bar's volume is the highest, it will be flagged.
4) Volume Bar Color: This filter helps you identify whether a high-volume bar is bullish or bearish. If the bar is green (close > open), it suggests buyers were dominant during that period. If the bar is red (open > close), it suggests sellers had the upper hand. By setting this filter, you can choose to focus on high volume bars that are either bullish (green) or bearish (red) or both, depending on your trading strategy.
Remember, these filters offer a level of customization that allows you to tailor the High Volume Bars Detector to your unique trading style and requirements. Always remember to adapt these settings to align with your overall trading plan and risk tolerance.
Keep attention!
It is important to note that no trading indicator or strategy is foolproof, and there is always a risk of losses in trading. While this indicator may provide useful information for making conclusions, it should not be used as the sole basis for making trading decisions. Traders should always use proper risk management techniques and consider multiple factors when making trading decisions.
Support me:)
If you find this new indicator helpful in your trading analysis, I would greatly appreciate your support! Please consider giving it a like, leaving feedback, or sharing it with your trading network. Your engagement will not only help me improve this tool but will also help other traders discover it and benefit from its features. Thank you for your support!
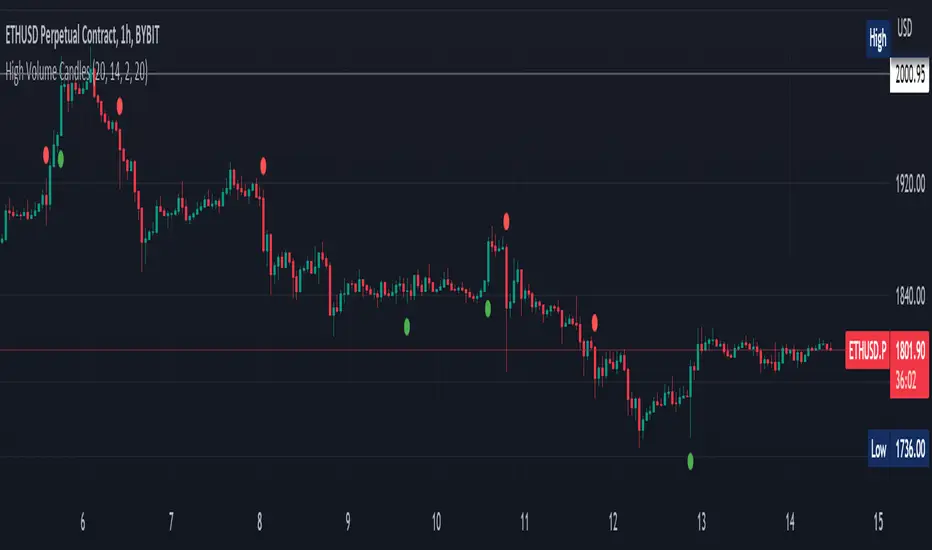
Volume Shaded CandlesDescription:
The Volume Shaded Candles indicator (VSC) is a technical analysis tool designed to represent price candles on a chart with transparency based on the volume traded during each candle. This overlay indicator enhances visual analysis by providing a visual representation of volume intensity.
How it Works:
The VSC indicator calculates the volume-to-transparency ratio by dividing the current volume by the highest volume within the last 10 periods. The ratio is then used to determine the shading intensity of the price candles. Higher volume relative to the recent highest volume results in lower transparency, while lower volume results in higher transparency.
Usage:
To effectively utilize the Volume Shaded Candles indicator, follow these steps:
1. Apply the Volume Shaded Candles indicator to your chart by adding it from the available indicators.
2. Configure the indicator's inputs:
- Specify the color for bullish candles using the "Bullish Color" input.
- Specify the color for bearish candles using the "Bearish Color" input.
3. Observe the shaded candles on the chart:
- Bullish candles are colored with the specified bullish color and shaded according to the volume intensity.
- Bearish candles are colored with the specified bearish color and shaded according to the volume intensity.
4. Interpret the shaded candles:
- Darker shading indicates higher volume during the corresponding candle.
- Lighter shading indicates lower volume during the corresponding candle.
5. Combine the analysis of shaded candles with other technical analysis tools, such as trend lines, support and resistance levels, or candlestick patterns, to identify potential trade setups.
6. Implement appropriate risk management strategies, including setting stop-loss orders and position sizing, to manage your trades effectively and protect your capital.
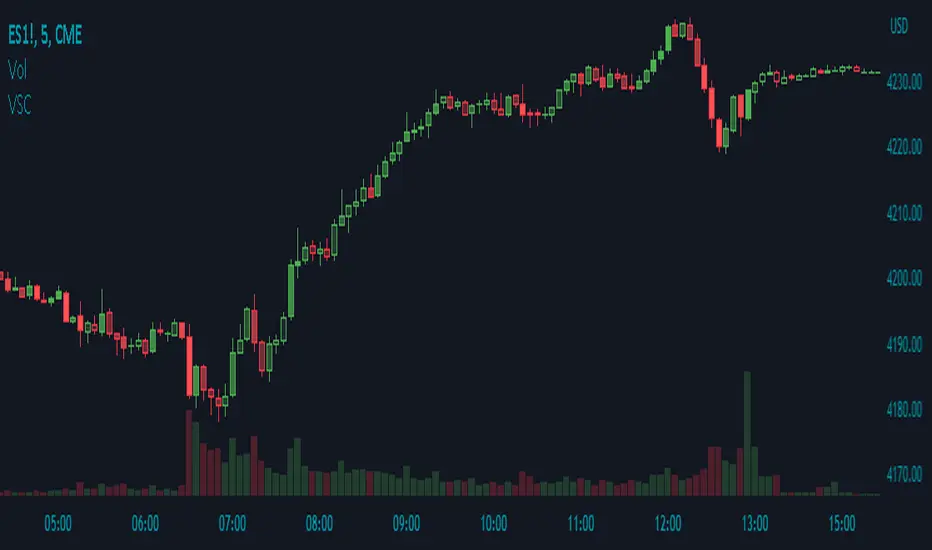
Trend IndicatorThis indicator has different features:
1. Ichimoku = this indicator can plot Ichimoku calculated both in the common formula and with the volume average, you can choose the calculator method for each line.
2. Channel and Bands = this mode allows the user to choose from channel and band, "channel" shows the Keltner channel, and "band" shows the Bollinger bands. Both the indicators are calculated including the volume in the formula of the average midpoint.
3. Color candle = this function allows the user to see two different colors of candles on the chart, the positive color occurs when both the long-term average and the short team average of price calculated using the volume is above the two averages calculated without the volume. This function is great to analyze the volume pressure, useful to identify trend continuation and exhaustion.
4. Extreme reversal zones = this is a version of the Keltner channels calculated over a high number of candles and with high deviation, to identify the potential zones of reversal.
Note that in the "Ichimoku" indicator, the backline is the T.R.A.M.A. indicator, created and published open source by Lux Algo, which I thank for the script.
