FastlaneIt will show a Marking (dot) above/below the candle where the Volume is 500000 and is up more than 5%.
VOLUMEBREAKOUT

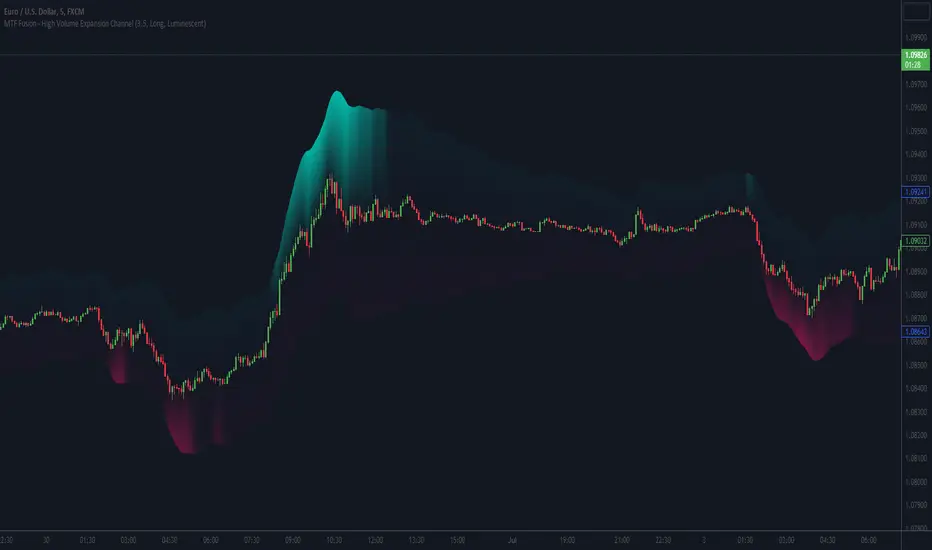
MTF Fusion - High Volume Expansion Channel [TradingIndicators]Exceptionally high volume and rapid price expansion are key markers of powerful moves, especially when they occur during a breakout or breakdown. The High Volume Expansion Channel (HVEC) uses our multi-timeframe fusion and price compression/expansion algorithms to look for high volume and rapid expansion from multiple higher timeframes at once. It uses this info to determine a high volume and expansion 'grade', and then encodes this result into a colored channel. This channel coloring varies in intensity based on how exceptionally high volume is and how rapidly price is expanding in either direction.
What is MTF Fusion?
Multi-Timeframe (MTF) Fusion is the process of combining calculations from multiple timeframes higher than the chart's into one 'fused' value or indicator. It is based on the idea that integrating data from higher timeframes can help us to better identify short-term trading opportunities within the context of long-term market trends.
How does it work?
Let's use the context of this indicator, which calculates a 'high volume and expansion grade' (let's call it HVEG), as an example to explain how MTF Fusion works and how you can perform it yourself.
Step 1: Selecting Higher Timeframes
The first step is to determine the appropriate higher timeframes to use for the fusion calculation. These timeframes should typically be chosen based on their ability to provide meaningful data and action which actively affect the price action of the smaller timeframe you're focused on. For example, if you are trading the 5 minute chart, you might select the 15 minute, 30 minute, and hourly timeframe as the higher timeframes you want to fuse in order to give you a more holistic view of the trends and action affecting you on the 5 minute. In this indicator, four higher timeframes are automatically selected depending on the timeframe of the chart it is applied to.
Step 2: Gathering Data and Calculations
Once the higher timeframes are identified, the next step is to calculate the data from these higher timeframes that will be used to calculate your fused values. In this indicator, for example, the HVEG value is calculated by determining the HVEG for all four higher timeframes.
Step 3: Fusing the Values From Higher Timeframes
The next step is to actually combine the values from these higher timeframes to obtain your 'fused' indicator values. The simplest approach to this is to simply average them. If you have calculated the HVEG value from three higher timeframes, you can, for example, calculate your 'multi-timeframe fused HVEG' as (HigherTF_HVEG_1 + HigherTF_HVEG_2 + HigherTF_HVEG_3) / 3.0.
Step 4: Visualization and Interpretation
Once the calculations are complete, the resulting fused indicator values are plotted on the chart. These values reflect the fusion of data from the multiple higher timeframes, giving a broader perspective on the market's behavior and potentially valuable insights without the need to manually consider values from each higher timeframe yourself.
What makes this script unique? Why is it closed source?
While the process described above is fairly unique and sounds simple, the truly important key lies in determining which higher timeframes to fuse together, and how to weight their values when calculating the fused end result in such a way that best leverages their relationship for useful TA.
This MTF Fusion indicator employs a smart, adaptive algorithm which automatically selects appropriate higher timeframes to use in fusion calculations depending on the timeframe of the chart it is applied to. It also uses a dynamic algorithm to adjust and weight the high volume and price expansion grade calculations depending on each higher timeframe's relationship to the chart timeframe. These algorithms are based on extensive testing and are the reason behind this script's closed source status.
Included Features
MTF Fusion high volume and expansion coloring
MTF Fusion ATR-based channel for visual effect
Channel width customization and explanatory labels
Pre-built color stylings
Options
Show Channel Lines: Show/hide the upper and lower lines of the channel
Fill Channel: Fill the channel with coloring depicting the current degree of high volume and rapid price expansion
Channel Width Multiplier: Sets the width of the ATR-based channel
Explanatory Labels: Show/hide explanatory labels describing the visuals
Lookback: Select how you want the degree of high volume expansion to be calculated (longer = long-term high volume and expansion, shorter = short-term high volume and expansion)
Pre-Built Color Styles: Use a pre-built color styling (uncheck to use your own colors)
Manual Color Styles: When pre-built color styles are disabled, use these color inputs to define your own
OSPL Volume [Community Edition]NSE:BANKNIFTY1!
This indicator is based on the concepts popularized by @OptionsScalper123 "Siva" of OiPulse. His ideology Is that large moves come after high volume candles. For Nifty, high volume is considered to be a candle above 125k volume and for BankNifty it’s 50k.
This indicator allows you to cut the noise and focus only on the high volume candle. It shows high volume candle in a brighter shade and lower volume candles in a less visible shade.
You can set the minimum volume threshold limit for Nifty and BankNifty. The indicator smartly recognizes which index you are using it in and uses the respective threshold volume limit.
All colors are customizable.
Thanks for Siva for all the ideas and wonderful products he has given to the community
Thanks to all the wonderful Pinescipters for developing awesome indicators and keeping the source open.
The source code of this indicator is just a few lines. Hope you can use it in your projects and learn something from this just how I learned from other scripts.
Any changes or updates needed in this indicator, please suggest. I was thinking some kind of alerts can be added when volume crosses the threshold. Let me know.
Boost/like this indicator and comment if you find this useful. Cheers and happy trading!!!

Triangle and Wedge Break [Only Long]The Triangle pattern
Triangle chart patterns are one of the most resourceful and practically advanced templates in technical analysis. These charts are the underpinnings of a well-calculated move when it comes to the assessment of risk and reward ratios. The pattern is often represented by drawing trendlines along an intersecting price scale, which suggests a stoppage in the ongoing trend.
The Wedge pattern
It is a price pattern that is denoted by the intersection of trend lines on a price chart. The opposing trend lines are drawn to connect the respective highs and lows of a price activity progression over the stretch of 10 to 50 periods. The lines can exhibit the magnitude of the highs and lows, signifying whether they are ascending or descending; this pattern gives the appearance of a wedge, hence the name. The wedge pattern has a good track record for forecasting price reversals.
This script is one of an attempt to help traders look for triangles and wedge patterns as soon as a breakout occurs.
How this script works:
1. First, it identifies the two tops of the pattern using the ta.pivot() function.
2. Next, it draws a trendline connecting those 2 tops, top A and top C (called the upper resistance line of the pattern).
3. Next, it draws a trendline connecting those 2 peaks (called the upper resistance line of the pattern).
4. Right now it will test 2 bottoms of the pattern (bottom B and bottom D).
5. Next, it will measure the ratio of waves AB, BC and CD (for example with triangle pattern, we need wave BC to retrace about 0.5 wave AB, same for wave CD and wave BC).
6. Finally, it will alert the trader if a break of a valid pattern occurs.
In addition, this script has more information about average trading volume, volume of candlestick breakouts. Those factors help us further confirm to enter the order.
This script is not all, you should combine other methods to increase your win rate.

Volumen Salvatierra
The "Salvatierra Volume" Indicator is an indicator based and created in homage to Tom Williams (author of "Master The Markets") . It helps to interpret the volume and movements of the market, in a simple way. Its benefits are:
Helps identify climatic volumes
Helps identify if there are or not strong hands in the market
Shows if a trend is being driven by volume and if the volume is strong
Red Volume:
Weak hands only
Green Volume:
Strong Hands Testing or guiding the price
Black Volume:
volume is normal
White Candles:
Sail with very little volume
Black Candles:
candle with a lot of volume
El Indicador de "Volumen Salvatierra" es un indicador basado y creado en homenaje a Tom Williams (autor de "Master The Markets") . Ayuda a interpretar el volumen y los movimientos del mercado, de una manera sencilla. Sus beneficios son:
Ayuda a identificar los volúmenes climáticos
Ayuda a identificar los momentos en los que no hay manos fuertes en el mercado
Muestra si una tendencia esta siendo guiada por el volumen y si el volumen es fuerte
Volumen Rojo:
Solo manos débiles
Volumen Verde:
Manos Fuertes Testeando o guiando el precio
Volumen Negro:
El volumen es normal
Velas blancas:
Vela con muy poco volumen
Velas Negras:
Vela con mucho volumen

High Volume Candles Detector - Open Source CodeGreetings, fellow traders!
Throughout my trading career, I've been intrigued by the dynamic interplay between candlestick patterns and trading volume. This fascination led me to develop an open-source indicator to help illuminate these patterns for the broader trading community.
Upon researching the Public Library, I found that many indicators relating to candlestick/volume analysis are proprietary and not open-source. This discovery further fueled my commitment to contribute a free, accessible tool that traders of all levels can utilize in their technical analysis.
Thus, I am excited to present to you our High Volume Bars Indicator. A unique tool that I believe fills a gap in the Public Library. I truly hope you find it beneficial in your trading journey and that it empowers you to make more informed decisions.
Description:
The High Volume Bars Detector is designed to help traders identify bars with significantly higher volume than the average. Users can filter in the settings menu:
1) The length of the Simple Moving Average (SMA) for volume, allowing you to define the average volume over a specific number of bars.
2) The Volume Multiplier, a factor that determines how much greater the volume of a bar should be compared to the SMA to qualify as a high-volume bar.
3) The Lookback Period, a specified number of candles used as a comparative benchmark for identifying the highest volume.
4) If the Volume bar is green or red, so if the candle price is --> close > open or open > close
Examples to better understand the logic of the indicator:
1) Length of the Simple Moving Average (SMA) for Volume: This setting allows you to define the average volume over a specific number of bars. For instance, if you set the SMA length to 20, the indicator will calculate the average volume of the past 20 bars and use it as a baseline to identify high volume bars.
2) Volume Multiplier: This is a critical factor that determines the threshold for what constitutes a high-volume bar. If you set the volume multiplier to 2.0, for example, the indicator will flag any bar where the volume is twice the value of the SMA volume as a high-volume bar.
3) Lookback Period: This setting lets you specify the number of candles that the indicator should consider when determining the highest volume. For instance, if the lookback period is set to 14, the indicator will compare the volume of the current bar with the volumes of the previous 14 bars. If the current bar's volume is the highest, it will be flagged.
4) Volume Bar Color: This filter helps you identify whether a high-volume bar is bullish or bearish. If the bar is green (close > open), it suggests buyers were dominant during that period. If the bar is red (open > close), it suggests sellers had the upper hand. By setting this filter, you can choose to focus on high volume bars that are either bullish (green) or bearish (red) or both, depending on your trading strategy.
Remember, these filters offer a level of customization that allows you to tailor the High Volume Bars Detector to your unique trading style and requirements. Always remember to adapt these settings to align with your overall trading plan and risk tolerance.
Keep attention!
It is important to note that no trading indicator or strategy is foolproof, and there is always a risk of losses in trading. While this indicator may provide useful information for making conclusions, it should not be used as the sole basis for making trading decisions. Traders should always use proper risk management techniques and consider multiple factors when making trading decisions.
Support me:)
If you find this new indicator helpful in your trading analysis, I would greatly appreciate your support! Please consider giving it a like, leaving feedback, or sharing it with your trading network. Your engagement will not only help me improve this tool but will also help other traders discover it and benefit from its features. Thank you for your support!
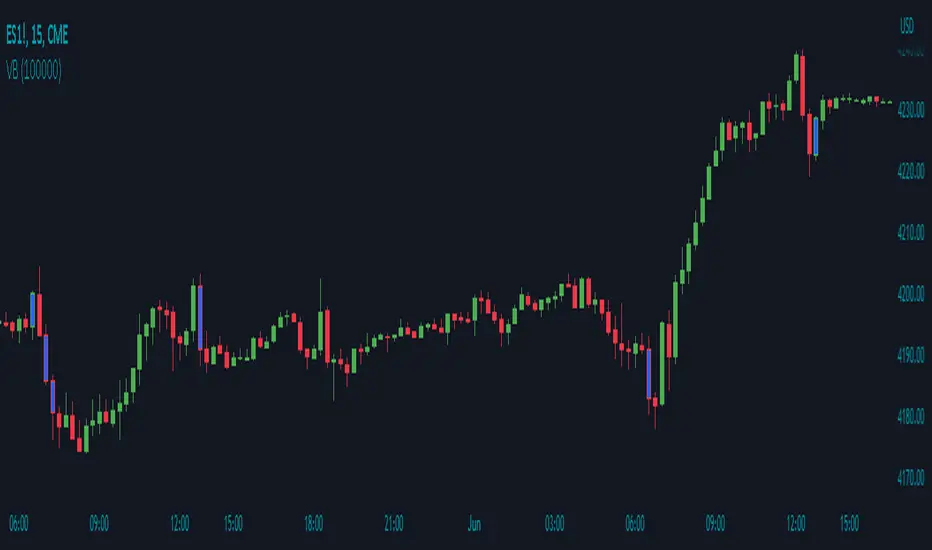
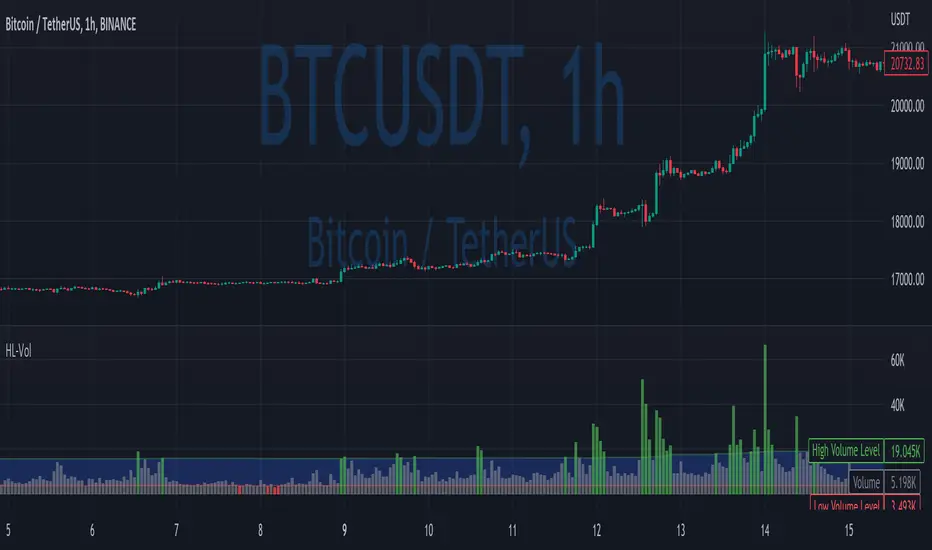
Volume Breakout by Chosen VolumeDescription:
The Volume Breakout indicator (VB) is a technical analysis tool that highlights candles with significant trading volume. It helps traders identify potential breakout periods characterized by high volume activity.
How it Works:
The Volume Breakout indicator compares the volume of each candle with a user-defined minimum volume threshold. If the volume of a candle exceeds or is equal to the specified minimum volume requirement, the indicator identifies it as a volume breakout and marks it accordingly.
Usage:
To effectively utilize the Volume Breakout indicator, follow these steps:
1. Apply the VB indicator to your chart by adding it from the available indicators.
2. Customize the minimum required volume parameter according to your trading preferences. This parameter determines the threshold volume level that a candle must meet or exceed to be considered a breakout candidate.
3. Observe the candles on the chart:
- Candles that meet or exceed the minimum required volume are highlighted with a specific color (yellow by default), indicating potential breakout periods.
4. Pay attention to the volume breakout indications within the candles, as they suggest periods of increased trading activity.
5. Analyze the price action accompanying the volume breakout candles. Breakouts often indicate a surge in buying or selling pressure, potentially leading to significant price moves or trend reversals.
6. Combine the analysis of volume breakout candles with other technical analysis tools, such as trend lines, support and resistance levels, or indicators, to confirm potential trade setups.
7. Implement appropriate risk management strategies, including setting stop-loss orders and position sizing, to manage your trades effectively and protect your capital.
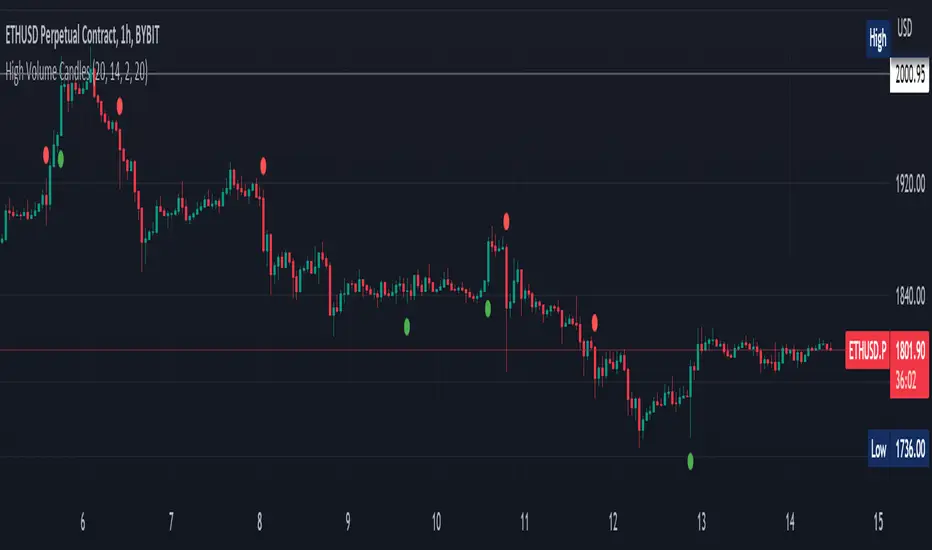
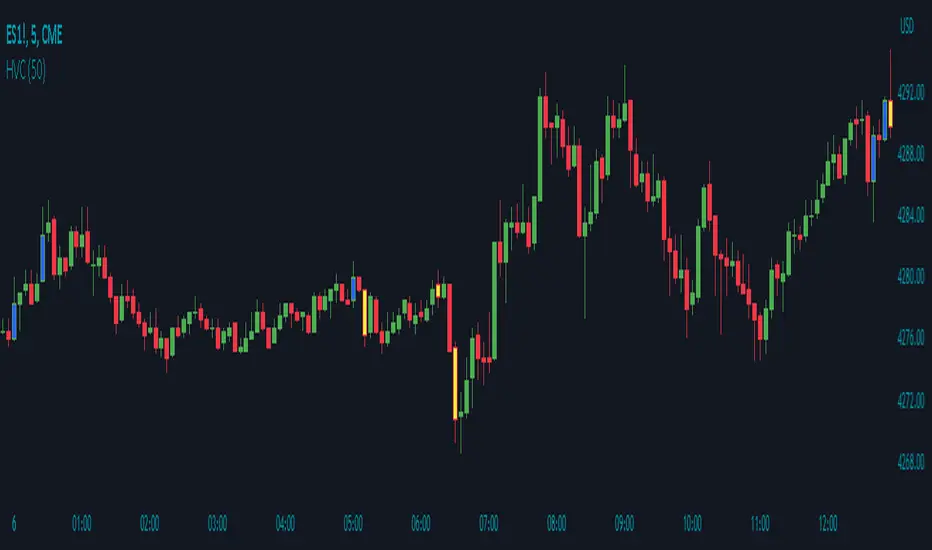
High Volume Candles by Time PeriodDescription:
The High Volume Candles indicator (HVC) is a technical analysis tool designed to identify candles with high trading volume. It allows traders to quickly spot periods of significant market activity based on volume.
How it Works:
The HVC indicator analyzes the volume of each candle in relation to the highest volume observed over a specified lookback period. The indicator compares the current volume with the highest volume within the defined lookback period and identifies candles that have volume equal to or greater than this threshold. It then distinguishes between bullish and bearish candles and assigns custom colors to highlight these high volume occurrences.
Usage:
To effectively utilize the High Volume Candles indicator, follow these steps:
1. Apply the HVC indicator to your chart by adding it from the available indicators.
2. Customize the lookback period according to your trading preferences. This parameter determines the number of previous candles to consider when calculating the highest volume.
3. Observe the candles on the chart:
- Bullish candles (blue by default) indicate periods of high volume when the closing price is higher than the opening price.
- Bearish candles (yellow by default) indicate periods of high volume when the closing price is lower than the opening price.
4. Pay attention to the color-coded volume indications within the candles, which highlight periods of high trading activity.
5. Analyze the volume patterns in conjunction with price action to identify potential trading opportunities. High volume candles often indicate increased market participation and can suggest significant price moves or reversals.
6. Combine the analysis of high volume candles with other technical analysis tools, such as trend lines, support and resistance levels, or indicators, to confirm potential trade setups.
7. Implement appropriate risk management strategies, including setting stop-loss orders and position sizing, to manage your trades effectively and protect your capital.
Volume Channel - [With Volume Filter]The indicator calculates two volume-weighted moving averages (VWMA) using different lengths, and filters them based on a moving average of volume. The filtered VWMA values are then plotted on the chart as lines, representing the fast and slow moving averages. In addition, upper and lower bands are calculated based on the slow VWMA and plotted as lines on the chart.
The fast and slow VWMA lines can be used to identify trends in the market. When the fast VWMA is above the slow VWMA, it is an indication of an uptrend, and when the fast VWMA is below the slow VWMA, it is an indication of a downtrend. The position of the VWMA lines relative to the upper and lower bands can also be used to identify potential trade signals.
When the price is near the upper band, it indicates that the market is overbought, and when the price is near the lower band, it indicates that the market is oversold. Traders can use these signals to enter or exit trades.
The indicator also includes a volume filter, which means that the VWMA values are only calculated when the volume is above a certain moving average of volume. This helps to filter out noise in the market and provide more accurate signals.
Explanation for each parameter
vwmaLength1: This is the length of the fast volume-weighted moving average (VWMA) used in the calculation. The default value is 10, and it can be adjusted by the user.
vwmaLength2: This is the length of the slow volume-weighted moving average (VWMA) used in the calculation. The default value is 25, and it can be adjusted by the user.
bandLength: This is the length of the moving average used to calculate the upper and lower bands. The default value is 34, and it is not adjustable by the user.
volumeFilterLength: This is the length of the moving average of volume used as a filter for the VWMA calculation. The default value is 5, and it can be adjusted by the user.
src: This is the input source for the VWMA calculation. The default value is close, which means the indicator is using the closing price of each bar. However, the user can select a different input source by changing this parameter.
filteredVwma1: This is the filtered VWMA calculated based on the volume filter and the fast VWMA length. It is plotted as a line on the chart and can be used to identify short-term trends.
filteredVwma2: This is the filtered VWMA calculated based on the volume filter and the slow VWMA length. It is plotted as a line on the chart and can be used to identify long-term trends.
ma: This is the moving average of the filtered slow VWMA values, which is used to calculate the upper and lower bands. It is plotted as a line on the chart.
offs: This is the offset used to calculate the upper and lower bands. It is based on the standard deviation of the filtered slow VWMA values and is multiplied by 1.6185 * 3. It is plotted as a line on the chart.
up: This is the upper band calculated as the moving average plus the offset. It is plotted as a line on the chart and can be used to identify overbought conditions.
dn: This is the lower band calculated as the moving average minus the offset. It is plotted as a line on the chart and can be used to identify oversold conditions.

Diddly - Real Volume TrendDiddly Real Volume Trend is an indicator to help traders identify the real trending direction of an asset, it achieves this by using liquidity to assess the overall buying and selling volume sentiment of a market place.
What is Liquidity
Liquidity refers to the ability of an asset to be turned into cash. Cash is the more liquid form of any asset, whereas selling a house would take a little longer to liquidate and convert to cash. Liquidity in financial markets is in essence based on the same principle and refers to how easily an asset can be bought and sold.
Liquidity in simple terms is the volume of participants who are willing to be involved in the market at any given time. Markets are based on auction theory, the more participants who want to buy at a certain price than sell, will dictate that the price goes up. As a result it is important to understand the role that volume has in financial markets, as volume will directly correlate to liquidity and supply and demand.
What does it mean?
Although markets are based on auction theory, sadly we don't have the advantage of a traditional auction, where we are all sitting in a room putting our hands in the air when we are interested in paying x price for a particular item. In this environment it is very clear to see how popular the item for sale is and whether it is possible to pick up a bargain.
Being able to identify the prevailing direction of buying versus selling volume on a chart provides an insight into market sentiment. Also we have to consider that typically most retail traders participate in very liquid markets, where you can get in and out of a position with relative ease.
There are obviously exceptions, extremely low float stocks, but on the whole with liquid assets it takes some big orders to move price, especially with currencies and high float stocks. Understanding these principles helps us as retail traders identify where the big money is seeing a bargain, if buying or overpriced if selling.
However you identify liquidity, I hope you agree that it is an extremely important element to be considering before taking a trade. The last thing any trader wants to be doing if they can avoid it, is getting on the wrong side of the market.
Just as a side note, high and low "Float Stocks" refers to the number of shares in general circulation for buying and selling.
What is "Diddly Real Volume Trend"
This volume trend indicator in simple terms will display the combined accumulated bullish and bearish volume within a window below the main chart. What you will see is a line chart that will be doing one of three things. Either it could be stair stepping in an upwards direction, identifying that we are in a bullish trend or stepping down in a bearish trend. Alternatively it could just be going sideways, which would suggest a ranging market.
This enables traders to make an assessment of the market sentiment using the liquidity direction that it has identified. This can help form an overall daily bias for intra-day traders or help confirm a longer term trend for swing traders.
Although this indicator is not a true oscillator (where the limits of number are fixed between a known upper and lower limit) , it can still be extremely useful in identifying divergence in price and the volume sentiment. As well as assisting in the process of identifying and confirming peak formations and potential reversal points in a market.
How does it Work
The indicator is plotting the volume trend line based on the output of a set of volume calculations, which is confirmed on the close of each candle. The resultant output is either a positive (Bullish sentiment) or negative (Bearish Sentiment), which are all totalled up to show the next point on the graph. As a result the visual effect seen from this process is that the more bullish calculated volume identified than bearish, you will see a rising trend line and the reverse for a bearish market.
The algo calculation which is used on each candle and its related volume is using the following elements.
Volume
Rate of Change
Relative Strength
The indicator is not just looking at the volume total and saying this is a green candle and must provide a positive number. It is looking for the volume and liquidity extremes and filtering out the nothingness of a market that makes no difference to price either way. It is from using these extremes that the indicator is able to plot the activities and direction of the big money in the market.
What is the Indicator Showing me?
Examples:
Here on a stock VKTX, on a 1 minute chart the elements that make up the indicator are annotated on the chart.
There are 6 components highlighted in the above chart, these have been listed below.
Volume Trend Line
This is the indicator driving line and is the result of the calculations described in the previous section.
Fast Moving Average
This is the fast moving average of the "Volume Trend Line". The moving average type and length can be changed in the settings.
(Default = Exponential Moving Average, Length: 60)
Slow Moving Average
This is a slower moving average of the "Volume Trend Line". The moving average type and length can be changed in the settings.
(Default = Hull Moving Average, Length: 3500)
Long Term Moving Average
This is a long term moving average of the "Volume Trend Line". The moving average type and length can be changed in the settings.
(Default = Exponential Moving Average, Length: 400)
Bullish Confirmation
On the "Volume Trend Line", you will see coloured circles dotted along the line, the green circles signifying Bullish Confirmation.
Bearish Confirmation
On the "Volume Trend Line", you will see coloured circles dotted along the line, the red circles signifying Bearish Confirmation.
The Bullish and Bearish confirmation signals are not signals to take trades, they are there to highlight the predominant direction. Seeing one confirmation signal in isolation is not that helpful, but continued prints of confirmation in a single direction would be interesting.
There are a further two signal types that are displayed on the volume trend line, these should be seen infrequently across charts and represent potential extremes of price movement in a single direction. These signals act as a warning that price could stall in this area or potentially make a reversal. As with the other signals within this indicator they are not signals to buy or sell, they are there to provide warning alerts and should be considered with other pieces of information that you are working with.
Bullish Extreme
Plotted on the "Volume Trend Line", you will occasionally see a green coloured downwardly pointing triangle, this represents a Bullish Extreme.
GBPAUD Hourly chart October 2022
Bearish Extreme
Plotted on the "Volume Trend Line", you will occasionally see a red coloured upward pointing triangle, this represents a Bearish Extreme.
GBPAUD Daily chart (February - April) 2023
How Does It Help?
This indicator will compliment any existing strategy and is not intended to be used standalone.
It can be used on any chart from a monthly, one minute to one second, depending on your trading strategy. Using multiple time frame analysis can help traders with a number of decisions that need to be considered before taking entries.
What is my market direction bias?
This can be taken from an hourly for intraday trader or daily for swing traders. What that time frame is depends on your trading plan and objectives from the trades you take.
When do I take my trades?
Again depending on the trading strategy used will dictate many aspect of this decision, although using the volume trend on a lower time frame, can help confirm breakouts, reversals and divergence.
How should I manage my trade?
With any trade you should have a defined risk reward clearly defined, with stops and targets in mind before taking an entry.
The age old saying of "cut your losses quickly and let your winner run", is easier said than mastered. Once in a trade the volume trend can be really helpful to identify trades that could be real runners and allows you to change expectations after entering the trade. Maybe you want to take some profit at the original point and let the remaining run. Maybe there is such strength you want to add to the position. Being able to assess market sentiment once in a trade can help with optimising returns.
The "Volume Trend Line", which is the driving element of this indicator, will be doing one of three things. Either it could be stair stepping in an upwards direction, identifying that we are in a bullish trend, stepping down in a bearish trend or going sideways in a ranging market.
Bullish Volume Trending Market
Here is stock VKTX, on a 1 minute chart. Trend confirmation on price action is determined by Higher Highs and Higher Lows for an uptrend or Lower Lows and Lower Highs on a downtrend. The same principle applies for the volume trend line.
In this example we first see breakout volume on the indicator with the Bullish Break volume, following that the volume trend keeps making higher highs and higher lows, confirming that this asset has short-term upwards potential. (why short-term? this is the 1 minute chart, you would want to consult the daily or hourly for a longer term perspective).
Price also is making higher highs and higher lows, which is in alignment with the indicator and known as "convergence" and is a positive signal for a continued trend.
Bearish Market
So here on Tesla (TSLA) on the 4 hour chart we can see the big sell off that started in April 2022. Where it clearly shows a downward trend, with lots of confirmation for continuation.
Ranging Markets
On this example on the AUDJPY 1 Hour chart, we can see that price is in a ranging market. By drawing trend lines on price and the indicator, it is clear to see that price and the volume trend line are both showing a ranging market. What is more interesting is the structure of the ranges.
The price range at the top of the chart is in an upward direction, whereas the volume trend in the bottom window is showing a downward range. Giving us an early indication of what to expect from this asset.
Diverging Markets
"Divergence" is a very powerful mechanism for identifying potential reversal points in price actions. There is a wealth of published information on this topic which is well worth reviewing, if this is a new principle to you.
Here again on the same AUDJPY 1 Hour chart example, points of interest have been annotated on the chart where the historical range turns into a step down to the next level within the market cycle, as predicted by the divergence in range patterns, price point up and volume pointing down.
In the above example, after identifying the divergence the next most important element is an extremely fast accelerated move down which breaks the lower level of the range, this can be seen on the right side of the bottom window and is labelled "Bearish Breaking Volume".
What is interesting here is that the volume indicator has identified the range breakout when price was still above the lower level of the range. Following that break out volume signal, if we zoom out to a 4 hour chart to see what happened next.
The range breakout was confirmed and price and the volume trend continues to show a downward direction in the market. As for entries and stops that is not the intention of this indicator and will be down to other elements in your trading strategy or in our case other indicators.
Peak Formations
Peak formation refers to the point where an asset is over extended in one direction and there is a potential of change in direction, with a wider pullback or a reversal in the higher time frame trend. These formations are often seen with double bottoms (W patterns) or double tops (M patterns) . Unfortunately these patterns appear all over the chart and trading them in isolation will be challenging.
In this example of EURJPY on the 1 hour chart, we see price and the indicator in the bottom window for the first 3 weeks in March 2022. The pair is trending down which is confirmed by both price and the indicator. There are no signals points plotted on the volume trend line, until one appears on March 4th 2022.
Another one appeared on the next trading day of Monday the 7th and we now have these two signals relatively close to each other. This is interesting information, especially considering that there was no extreme signals for the previous couple of months.
Later that day the volume trend broke the previous volume level, after a W pattern was completed and a green bullish confirmation signal was printed. The following day another bullish confirmation signal is displayed to further confirm that we had made a peak formation reversal.
Please note that using the settings style tab, has enabled the change to the bearish extremes signal, changing the colour and shape to be an orange circle. Which for the purposes of this illustration is easier to see.
Another example of the same pair in August 2022, with a very similar confirmation sequence.
Stock Examples
Here on UBER on a 1 hour chart , is an example of how the indicator can be used in confluence with other trading strategies. If a trader was trading candle patterns, they may see this classic 1 hour bull flag pattern forming.
Without the volume trend analysis this looks like a good buy setup. Adding this analysis to the chart we clearly have a different view point.
Here is what subsequently happened to price and this is in a generally bullish market March 2023.
Scalping Entries
For those traders who work with super fast time frames like the 5 second or even on a 1 second charts, the volume indicator can be used to help time entries as a part of a wider trading strategy of trading a pullback or trading support and resistance levels.
Styling options in the indicator settings enabled this different view of the indicator output, which can be extremely useful for timing entries.
Here on this hot IPO stock, LUNR from February 16th 2023, we have an extremely strong move up from $13.80 to $18.00. One aspect of this move up, is that it is doing this on extremely light volume and the predominant market sentiment on the surface seems very bearish.
This would be a clear indication not to trade this stock at this moment in time, as a trader there would be lots of emotions of FOMO (fear of missing out) , seeing a stock making that kind off move on a new IPO - there is the sense that this stock will go to the moon and your not going to be involved.
As traders we have to consider the risk : reward potential. This stock could drop to $10.00 if someone put in a 50 k market sell order, as it is clear there are not the buyers to support that kind of liquidation.
The following charts are in the 5 second time frame, until otherwise stated
So we need to wait for some confirmation of buying liquidity before we can make any plans for taking an entry, which we get in the form of a couple of strong bullish candles on the chart below. Interestingly the price breaks the previous all time high for this stock, although the volume trend at this stage does not seem strong enough to consider an entry.
At this point we should be on the lookout for further buying liquidity, ideally to break the previous high volume line, which appears in the next chart. This would be the time to take an entry based on other aspects of a trading plan.
Having now taken an entry, we can use the indicator to understand the strength of the buying liquidity and identify areas where we should be looking to take profit or close out the trade. Looking at the volume trend profile shown in the chart below, there is no reason not to hold this stock for a wider move up.
In the next chart we see the first signs of some selling pressure, as the indicator shows signs of red. This would be the area to take some profit and look at a higher time frame perspective, to get the sense of whether to hold the remaining position.
Here on the 5 minute time frame the volume trend is still looking very strong to hold the remaining position. As it turned out it was a good place to take profit as it was just under the high of the day.
Knowing when an asset is going to reverse is not easy and this stock was way too over extended and a top had to finally come. This one minute view of the indicator, shows the point where you would see that the upward liquidity was over and you were now on the backside of the move, with no reason to trade further.
Here on a 15 minute chart you can see the full extent of the move and its reversal back to the original price. It provides a clear illustration that chasing trades through FOMO or holding and hoping is not a profitable approach. Being able to time your entries and exits, where you can clearly manage risk is one of the most important elements to any traders strategy.
This is an extreme example and not something you see every day in any market. It has been included within this narrative with the hope that it clearly illustrates the risk involved in trading and being able to mitigate them, has to be at the forefront of your mind.
Key Settings
Within the indicator settings there are a number of options that are available to users. All aspects of what you can see can either be changed or turned on or off in the "Style" tab as well as changing the colours and their transparency.
The available settings on the "Inputs" tab are for fine tuning the indicator to your style of trading. This fine tuning can be applied to the moving averages that can be displayed and follow the volume trend line as well as the volume filtering process.
The most important ones that are in need of explanation are outline below:
General Settings
"What type of asset is the Algo looking at" : Available Options = "Small Caps", "Large Caps", "Futures", "Currencies" (Default Setting = Currencies)
The indicator will make an assessment of the best settings to use as defaults for the volume filtering, confirmation and extremes signals. The defaults can be changed in the following sections using the override.
"Turn on Turbo Mode" : True or False (Default Settings = True)
This setting will give the indicator volume filtering processes a boost
Signal Settings
Based on the "Asset Type" from the general settings, the indicator will make an assessment of the best settings to use by default. These can be changed by using the settings below.
"Override Default Assessment Thresholds" = True / False
"Percentage Difference to Signify Trend Confirmation" = A percentage value that will tell the indicator how to identify the volume trend line swing points used to identify bullish or bearish confirmation signals. Values from 0.1 to 10 would make the most sense. A too high setting and you will not see any confirmation points plotted. Too low and you may see too many to be useful.
"Percentage Difference to Signify Extremes" = A percentage value that will tell the indicator how to identify the volume trend line swing points used to identify bullish or bearish confirmation signals. Values from 20 to 200 would make the most sense. A low a setting and you will see too many extreme points plotted.
Filter Settings
"Turn On Volume Assessment Filters" = True / False : The volume assessment filters are used to focus the "volume trend line" on higher volume extremes.
Based on the "Asset Type" from the general settings, the indicator will make an assessment of the best settings to use by default. These can be changed by using the settings below.
"Override Default Assessment Filters" = True / False
"Filter Volume using Setting" = The number used in this setting represents a value from 0 to 100. Zero will filter out no volume, whereas 100 would filter it all out. The default setting is 1, as there is a danger of setting this number too high and all you will see in the line chart is big steps up and down, with a plateaus in the middle. Which may be useful, although it would not be so helpful in divergence or volume line breaks.
Fast Moving Average
This is the fast moving average of the "Volume Trend Line".
"Moving Average Type" = The type of moving average calculation to be applied.
Default = "EMA"
Available Options: "SMA","EMA" ,"HMA" ,"SMMA (RMA)" ,"WMA" ,"VWMA"
Moving Average Key
SMA : Simple Moving Average
EMA : Exponential Moving Average
HMA : Hull Moving Average
SMMA (RMA) : Exponentially Weighted Moving Average (alpha = 1 / length.)
WMA : Weighted Moving Average
VWMA : Volume Weighted Moving Average
"Moving Average Length" = The number of candles back into the chart used to calculate the Moving Average. (The higher the number, the slower the moving average becomes)
Default Length = 60
"Apply Double Smoothing" = True or False : This is an option to turn on if an extra smoothing effect to the moving average if required.
Slow Moving Average
This is the slow moving average of the "Volume Trend Line".
"Moving Average Type" = The type of moving average calculation to be applied.
Default = "HMA"
Available Options: "SMA","EMA" ,"HMA" ,"SMMA (RMA)" ,"WMA" ,"VWMA"
(See moving average key)
"Moving Average Length" = The number of candles back into the chart used to calculate the Moving Average. (The higher the number, the slower the moving average becomes)
Default Length = 3500
(By default we have a higher number for the slow length compared to the long term length in the next setting. This is because using the Hull Moving Average, is an accelerated moving average that needs higher values to slow it down. If you were to change this to say an EMA, then you would need to change the length to something like 200, to put this slower moving average in context with the others).
Long Term Moving Average
This is a long term moving average of the "Volume Trend Line".
"Moving Average Type" = The type of moving average calculation to be applied.
Default = "EMA"
Available Options: "SMA","EMA" ,"HMA" ,"SMMA (RMA)" ,"WMA" ,"VWMA"
(See moving average key)
"Moving Average Length" = The number of candles back into the chart used to calculate the Moving Average. (The higher the number, the slower the moving average becomes)
Default Length = 400
"Apply Double Smoothing" = True or False : This is an option to turn on if an extra smoothing effect to the moving average if required.
Finally
We greatly appreciate the support and feedback from the Trading View community, and we are dedicated to continuing to improve our indicators with your support.
We want to help you manage risk, and that's why we emphasise that trading is risky and any technology used to support our trading decisions is based on information from the past. We encourage traders to take responsibility for their trading businesses and always prioritise risk management.

OBV-MACDThe OBV-MACD indicator is a momentum-based technical analysis tool that helps traders identify trend reversals and trend strength. This Pine script is an implementation of the OBV-MACD indicator that uses the On-Balance Volume (OBV) and Moving Average Convergence Divergence (MACD) indicators to provide a momentum data of OBV.
The OBV-MACD indicator uses the OBV to calculate the cumulative volume, which is then smoothed using two moving averages - fast and slow. The difference between these moving averages is plotted as a histogram, with a signal line plotted over it. A buy signal is generated when the histogram crosses above the signal line, indicating a bullish trend, while a sell signal is generated when the histogram crosses below the signal line, indicating a bearish trend.
This Pine script also includes an OBV-MACD-Donchian version that incorporates Donchian channels for the OBV-MACD. The Donchian channel is a technical analysis indicator that helps traders identify the highs and lows of an asset's price over a certain period. The OBV-MACD-Donchian version uses the OBV-MACD indicator along with the Donchian channels to provide signals that the momentum of OBV is making new high/low during that period of time.
Traders can customize the input parameters of the OBV-MACD indicator, such as the timeframe, method of calculation for the moving averages, and the lengths of the moving averages and breakout lengths. The colors of the plot can also be customized to suit the trader's preferences.

High/Low VolumeIn this indicator, I show you a better way to define high/low values of volume (or any other indicator).
Quite often, I get requests from my clients that an indicator level should be “high” or that it should be above a certain absolute level.
The first request is hard to interpret mathematically, but traders can easily spot it on the chart. The second one is not flexible, and it might not make sense in another market regime.
To solve that, you can compute dynamic high/low levels that represent unexpected extreme values that are adaptable to recent conditions.
There are two pretty simple methods I’m using quite often in my scripts percentiles and sigma (standard deviations).
Percentile looks back at X bars and computes the value under which a certain % of data points are located. So, for example, if we’re computing 90%tile and we’re looking at 100 bars, we’ll get a value under which we have values of precisely 90 bars for this indicator. It’s a good idea to use something like 5%tile for low level and 95%tile for high level.
Sigma(σ) is related to standard deviation. If we assume that our data is normally distributed, then 68% of data points should be in the range of mean +-1σ, 95% → mean +-2σ. So we can assume that something above 2σ is a pretty rare and extreme event.
In this script, I give you an example of how to compute both on volume, but you can easily change this to another indicator.
The issue with volume is that it’s not normally distributed, and your low level will be quite often too low to detect any low levels. Ideally, we have to use a more sophisticated formula that fits volume distribution better.
In this indicator, you can set the following parameters:
Choose type: Percentile or Sigma
Lookback Period
High/Low Percentiles
Sigmas #
You can also receive alerts for high/low volume events.
Disclaimer
Please remember that past performance may not indicate future results.
Due to various factors, including changing market conditions, the strategy may no longer perform as well as in historical backtesting.
This post and the script don’t provide any financial advice.
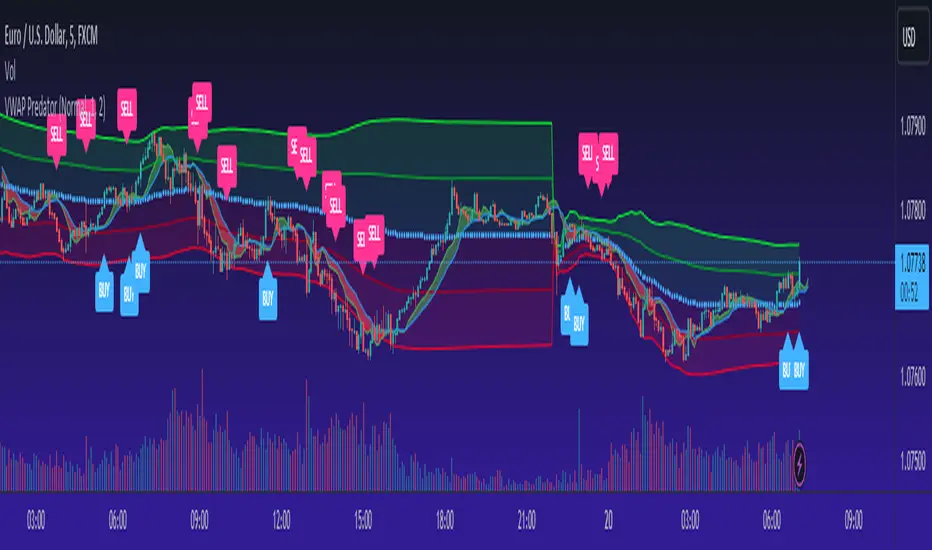
VWAP PredatorUsing VWAP as a start point, the VWAP Predator uses proprietary Fibonacci bands to help determine signal criteria. Most traders use VWAP in a simple way to determine whether an instrument is in a bearish or bullish state, but that doesn't help choosing the correct time to go long or short.
The xBat VWAP Predator uses behavioural analysis with volume, price action with open and close proximities to the Fibonacci bands/zones (Fib Zones). The following describes how the xBrat VWAP Predator is different to any standard use of Volume Weighted Average Price and uses xBrat Proprietary Behavioural logic to determine high probability long and Short signals. All of this heavy lifting and logic is done behind the scenes, keeping traders charts clean.
Long Trading Signals - Candle Coloured in Blue - There are many states with the logic to produce these signals, which are briefly described below:
1. The only standard criteria here - The price action must be above the VWAP Line
2. The Price must open below the boundary of one Fib Zone and close into the next Fib Zone
3. That Same Candle has to be an Accumulation Candle (more volume than the preceding candle and More Buyers) - This is determined with our proprietary logic coding
4. The Same signal candle also has to be higher than average volume. Again, our proprietary xBrat Logic just doesn't look back over a set number of bars, it looks at times of day and day of week, plus more to determine a true valuation of higher, lower or equal to average volume.
5. Only when these states are met, plus two more ema proximity logic, Does the xBrat VWAP predator give a Long Signal.
6. Trade Management is either set targets or indeed a simple ema cross which we provide as a ribbon on the chart to help traders. These ema's are different to entry logic. When the Ribbon turns from green to red, the trader should consider exiting the trade
Short Trading Signals - Candle Coloured in Pink - There are many states with the logic to produce these signals, which are briefly described below:
1. The only standard criteria here - The price action must be below the VWAP Line
2. The Price must open above the boundary of one Fib Zone and close into the next Fib Zone
3. That Same Candle has to be a Distribution Candle (more volume than the preceding candle and More Sellers) - This is determined with our proprietary logic coding
4. The Same signal candle also has to be higher than average volume. Again, our proprietary xBrat Logic just doesn't look back over a set number of bars, it looks at times of day and day of week, plus more to determine a true valuation of higher, lower or equal to average volume.
5. Only when these states are met, plus two more ema proximity logic, Does the xBrat VWAP predator give a Short Signal.
6. Trade Management is either set targets or indeed a simple ema cross which we provide as a ribbon on the chart to help traders. These ema's are different to entry logic. When the Ribbon turns from red to green, the trader should consider exiting the trade.
VWAP Predator is a day trading and scalping signals trading indicator.
Volume Price and FundamentalsVolume Price and Fundamentals indicators contains 4 exponential moving averages based upon Fibonnaci numbers as period (8, 21, 55 & 144) with crossovers and crossunders.
It also contain a table for volume and 50 Day Avg. Volume, Relative volume, Change in Volume, Volume Value, Up-Down Closing Basis days in last 50 days, Volume ratio (U/D Ratio) on last 50-day Up / Down days and along with fundamental analysis table with various Fundamental Analysis parameters and QoQ & YoY comparison basis for better investment decision making.

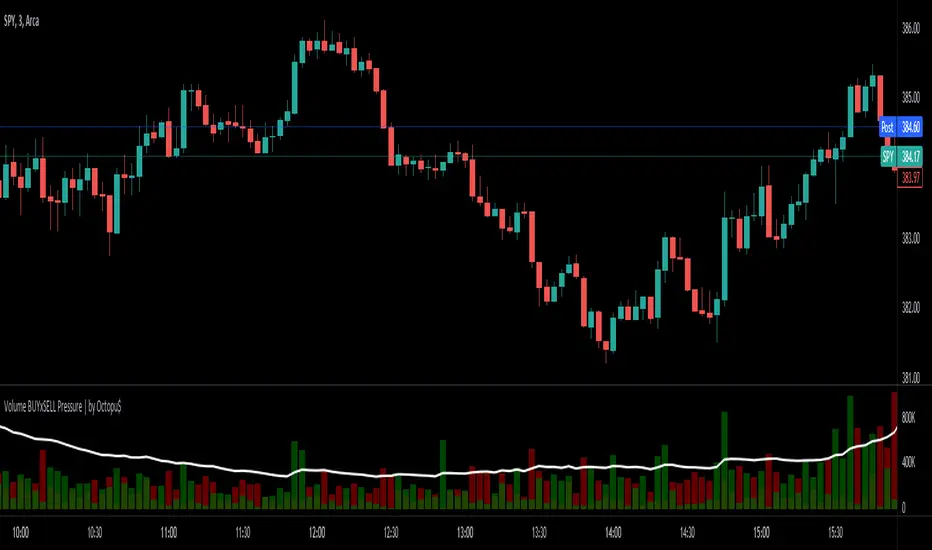
⚖ Volume BUYxSELL Pressure | by Octopu$⚖ Volume BUYxSELL Pressure | by Octopu$
Volume is the number of shares traded in a particular stock, index, or other investment over a specific period of time.
It can indicate market strength, as rising markets on increasing volume are typically viewed as strong and healthy.
In fact, the more, the better. Institutions tend to get more involved in a stock with daily dollar volume in the hundreds of millions or more
But also, when prices fall on increasing volume, the trend is gathering strength to the downside.
That's where BUYxSELL Pressure | by Octopu$ comes in.
Typically, Volume bars follow the candles.
If the Candle is Green (Close > Open), the Volume Bar is also Green.
Now if the Candle is Red (Close < Open) the Volume Bar is also Red.
You never know if it is being Bought or Sold.
This changes the game: along with Price Action, Trend Direction, and other factors. This is possible!
This indicator is composed of:
Volume itself (all of it), displayed by Gray bars;
Identifies Buying Pressure on Green Bars;
And Selling Pressure with Red Bars.
Volume Average as a White Line, for the last "X" Days
Additionally,
It presents a Yellow Triangle as and indication of when the Volume is above the Average in the current TF you are in.
Additionally, this can be set up via an Input: Means if you like to watch it 10% above Average, you got it. 25%? 50%?... You name it.
On top of that,
Includes an indication for Volume Spike as well. So if informs you visually on the Volume Bars of any surges on the TF you are in.
For example: 2x the Volume from the last Candle. Or maybe 3x? 5x... The way you like it the best.
This way, with the combination of your understanding as well as other Indicator and Factor as Confluence, you can improve your analysis and figure out what is going on.
www.tradingview.com
(SPY 5m as an example only)
SPY
Features:
• Total Volume
• Average Volume
• Buying Pressure
• Selling Pressure
• % Above Average
• Volume Spike/Surge (Multiplier)
• Custom Settings
Options:
• Show/Hide Average Line
• Change Length of Average (Days)
• Select/Personalize % of Above Avg
• Add Personalized X Multiplier
• Fully customizable on Style and Colors
• Change shapes and Location
Notes:
v1.0
Indicator release.
Changes and updates can come in the future for additional functionalities or per requests. Follow and Stay Tuned!
Did you like it? Please Support and Shoot me a message! I'd appreciate if you dropped by to say thanks! Thank you.
- Octopu$
🐙
On Balance Volume DeviationThe objective of this indicator is to be a leading indicator that can detect a large price change before it happens. It is based on the On Balance Volume (OBV) indicator, which is a leading indicator based on the premise that a large change in volume often precedes a large price change. This indicator charts the N-Period deviation of the OBV data and displays it as a histogram. This is overlayed on an area chart of the M-Period SMA of the histogram data. This combination helps to visually enhance the pattern that signifies that a jump in price is about to happen.
Useage:
When the histogram bars are above the area plot, then a jump in price is about to happen
As with all leading indicators, there are a lot of false signals. Confirm with price action or another indicator
The further the histogram bars are above the area plot, the larger the predicted jump in price
It seems to work better on shorter intraday timeframes than on the longer timeframes
At the close of a market session, it is a good indicator of how much the price will jump on the opening of the next market session.

Volume Analysis*Sourced code from Volume Flow v3 by oh92 for Bull\Bear volume flow calculations. Thank you so much for your engineering skills!
This indicator integrates the Ma-over-MA crossover strategy in oh92's V3 DepthHouse calculation with a volume-over-MA
calculation to further narrow down "Areas of Interest" levels for a potential re-test zone to the right of the chart.
I added a Moving Average calculation for a multi-level cloud and further broke down more conditions to highlight both
volume flow crossover on the High and Extreme High MA's and also high and extreme high volume spikes on set period average
without bull\bear conditions. Original Bull/Bear Spikes are still viewable although that was the only plot from oh92's script
that was integrated.
Session backgrounds set for research purposes.
Please note: Setting MA Cloud to "None" will remove all plots calculated with the MA Cloud from the chart entirely. Turn off visuals
in the Style tab.

Banknifty Volume - IN
This simple indicator computes the average Relative Strength Index of each Banknifty stock and displays the volume on the chart with color schemes while the average line indicates the average RSI of all Bank Stocks. This indicator works on Banknifty and its stocks.
It works on all time frames
How You can use this?
You can use this indicator for Volume analysis if the average RSI line is above the 0 line, the stock is moving upside and vice versa for Downside .

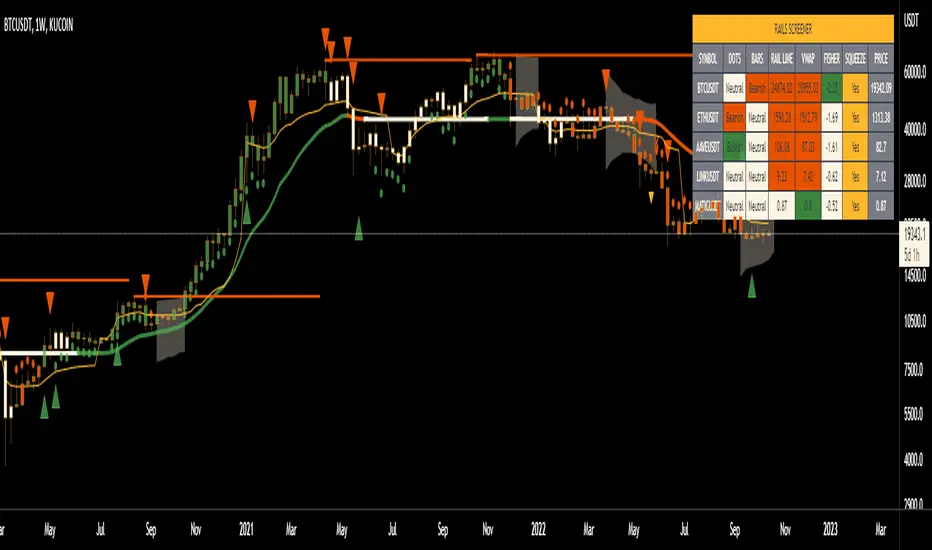
Rails [s3]Centered around a Variable Moving Average. The Variable Moving Average (VMA) is a study that uses an Exponential Moving Average being able to automatically adjust its smoothing factor according to the market volatility. In addition to the VMA, the indicator displays breakouts in volume and when the Bollinger Bands are in a squeeze.
Dots = Microtrend
Triangles = Breakouts in Volume
X = Crossover of Moving Averages
Shaded "Cloud" = Bollinger Bands Squeeze
Alerts can be set for Bearish and Bullish strength (Volume Breakouts), Crossovers, and when Squeezes have started and ended.
Volume Spike Up - VSU
This indicator detects abnormal spike up of volume (Vol) and analyze price action in a very specific manner. so it may give us high probability wining setup.
It was build for BUY setup only, it's good for crypto market and you also can use for stock market but it is not suitable for FOREX.
The default setting values is 4H time frame, use can adjust value for any time frame you want.
I had combined 3 strategies in one indicator:
1. Base on EMA or break from sideway area
2. Looking for a reversal point (High risk and you can use or ignore it)
3. Enter below Bollinger Band (High risk and you can use or ignore it)
If your trading timeframe from 1H and above you should use 1 and 2, if below 1h you should use all.
How it works
The first you have to decide your trading timeframe to select which strategy to use then hide other unnecessary lines , because they may make you confusing.
- "Base on EMAs or break from sideway area" when price near EMAs if have abnormal Vol with good price action, indicator will gives a signal, color of signal depend on how big of Vol.
- "Looking for a reversal point" when price blow of 60 candle if have buying Vol over Vol MA50, signal will be appeared.
- "Entering Below Bollinger Band" when price entering below Bollinger Band with big Vol, signal will be appeared.
Signal show us the Vol spike up only, it's not an Entry, so you have to consider and combine with other indicators to make your own decision.
Stop loss line suggest you should Cut Loss for your position at this price, if you have skill you may hide it.
These settings can be customized however you like. You can enable or disable high risk strategies, you can change timeframe to any period you want, enable or disable trend following.
you can adjust your stop loss distance, and you can adjust the limit rules for signal.
This version is basic and free, it only contain alert for one signal "Volume spike up".

PulseVolume can help confirm signals we might discover using other methods of technical analysis .
This indicator's logic spots above-average turnover and then tests against the price change. Pulse highlights sessions with heavy volume and directional moves. This can help take out the noise and help confirm the trend.

MACD Multi Time Frame with Histogram MAThis is a modification of LonesomeTheBlue's MACD Multi Time Frame indicator to include also moving averages applied to histogram to filter-out important moves.
You can select average period and multiplier to highlight the type of movements that interest you most.
Happy trading!

Nifty & BN 2 Candle Theory Back Testing and Alert Notification How To Initiate Long Trade-in Index Future/ Buy Call Options – 3 Min TF
▪ If The Index Futures Trades Above The VWAP, the Following Parameters are Checked For 2 Candle Theory on the long side
▪ RSI Trades Above 50 & Between 50-75/80
▪ Volume Of 2 Consecutive Bars Is Above 50 K for BN & 125 K For Nifty
▪ All the indicators (Parabolic SAR, Super Trend, VMA, VWAP) Below the Candles
▪ When the above conditions are met enter In 3rd Candle, With 1st Candle High As SL
How I Initiate Short Trade-In Index Future/ Buy Put Options – 3 Min TF
▪ If The Index Futures Trades Below The VWAP, the Following Parameters are Checked For 2 Candle Theory on the short side
▪ RSI Trades Below 40 & Between 40-25/20
▪ Volume Of 2 Consecutive Bars Is Above 50 K for BN & 125 K For Nifty
▪ All the Indicators (Parabolic SAR, Super Trend, VMA, VWAP) Above The Candles
▪ When the above conditions are met enter In 3rd Candle, With 1st Candle High As SL
The indicator checks the above and notifies to enter a long trade and short trade respectively. There is also volume cutoff and change in the volumes respectively, also non-trading times that can be set.
