vx_termsUSAGE
--------
This script helps train your intuition for changes in the VX term structure. I recommend using it on the VIX chart, so you can compare changes in the terms to changes in VIX. It's also nice for calendar spread traders who want to get a feel for the same changes.
1. Select a day, month, and year using the inputs
2. Observe the data table.
3. Open the input again and increment or decrement the day (and month, year as necessary).
4. Click "Ok".
5. Click to deselect the indicator, which allows the chart to load new data.
6. The data table will be reloaded with the next/previous day's data.
The data table has the following columns:
- contract: the VX contracts, in sequence. refer to the CBOE for month codes (F for January, etc.)
- close: the closing price of the contract.
- ma:mb: the spread (difference) between this row and the next row.
- ma:mb chg: the spread's change from prior close.
For example, given the following values for the first two columns:
VXQ2021, 16.5, -3.1, -0.2
VXU2021, 19.6, ..., ...
The front month (Q = august) closed at 16.5, $3.1 below the s\September contract. The negative spread enlarged by $0.20 from $2.90 on the previous trading day.
BUGS, ODDITIES, AND LIMITATIONS:
-------------------------------------------
- The first column will be greyed out after expiration day, which is the 3rd Tuesday of that month. Unfortunately, I can't load the next month's contract due to some limitations with TV.
- The active date is highlighted with a yellow background. When a non-trading date is selected, the highlight will disappear. However, the data table will sometimes fill with the nearest trading date, prematurely. No worries, just know that the data is probably for the previous Friday.
- The script is clunky and slow, but this is the best I can do with TV. Hopefully they add more continuous contracts or allow true dynamic symbol loading.
SPECIAL THANKS:
---------------------
Thanks to HeWhoMustNotBeNamed for helping me get through some messiness. Very helpful guy.
www.tradingview.com
VIX CBOE Volatility Index

VIX Contango 1VIX Contango 1 = 100* (VX2! - VX1!)/VX1!
Show when is VIX in contango or in backwardation. I compare the first two contracts.

QuantAnna: Nifty VIX CorrelationNSE:NIFTY
Simple correlation indicator which oscillates around zero
Shows default correlation with NSE:IndiaVix
You can use it to check correlation with any other trading symbol or indices by simply selecting it in the settings.

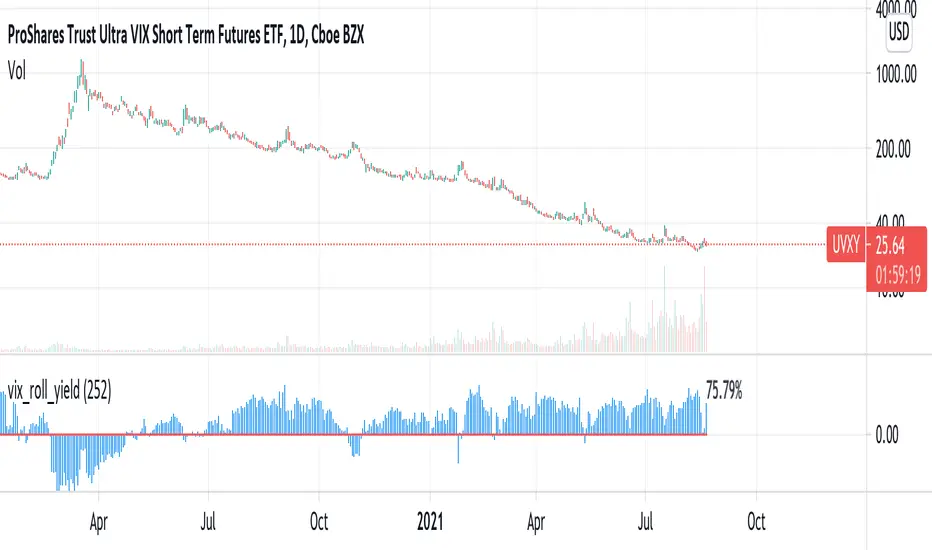
vix_roll_yieldShows the roll yield of the VX futures, which is the ratio of a continuously weighted average of the front two months to the VIX. The VX (VIX futures) contract expires on the third Tuesday of each month. On the next trading day, the front month will have full weighting, and the second month will have no weight. On the expiration day, the back month will have full weighting and the front month will have no weight. In between, the weight gradually shifts.
This weighted average is similar to the SPVIXSTR index that UVXY and several other funds track. When the average is below the VIX, the indicator is negative, and the front month contract will tend to gain value relatively more rapidly than the back month as it converges upward to the VIX spot price. Because funds whose NAV is tied up in VX contracts continuously roll from the (typically cheaper) front month to the back, in situations where the front month is more expensive than usual--or even more expensive than the back month--these products may have a "tailwind". In this case, they are selling expensive front month contracts to purchase cheap back month contracts.
Ordinarily, VIX funds have a "headwind." The roll yield is positive, the front month is cheap, and the back month is expensive. Day by day the funds sell cheap front month contracts and buy expensive back month contracts, which, in turn and over time, become the front month and converge with the VIX, losing value rapidly. This is a brief explanation about the decay of these products.
VIX Fix Double PleasureFULL README: github.com/samgozman/vix-fix-double-pleasure
The idea of an oscillator is quite simple. It is based on the popular VIX Fix oscillator, the purpose of which is to find local bottoms within the scope of trend movement. But in addition to the classic VIX fix, I built an oscillator opposite to it, which serves as a potential signal of the end of local growth.
Components
VIX Fix classic (red lines)
VIX Fix reversed (green lines)
Buy/sell signals (colored dots)
Parameters
VIXFix_length - defval: 22. Classic length for VIX fix
VIXFix_arraySize - defval: 22. The number of periods among which to look for lows and highs. If there are too many signals, reduce this value.
plotMarks - defval: true. Plot high/low marks
How it is calculated
VIX fix classic: (highest(close, VIXFix_length) - low) / highest(close, VIXFix_length) * -100
VIX fix reversed: (lowest(close, VIXFix_length) - high) / lowest(close, VIXFix_length) * -100
Signals
🟢 Buy signal if current "VIX fix classic" or "VIX Fix reversed" value is lowest from the last VIXFix_arraySize periods.
🔴 Sell signal if current "VIX fix classic" or "VIX Fix reversed" value is highest from the last VIXFix_arraySize periods.
General recommendations
I advise you not to use this oscillator for a short positions. Long only . It is recommended to set a long position by pyramiding.

Vix Jump for Selling Puts or Buying CallsThis script aims to identify optimal times when to write Puts for premium, for example using the SPX Weeklies model or simply buying Calls. Not perfect but provides some additional confidence when playing Puts on SPX or the Wheel on SPY.
What it does:
We compare current VIX with a lookback VIX for X% delta. If there is a jump of say 20% over a defined period then that would indicate an opportunity to sell Puts, run a straddle or buy Calls. We use VVIX as a check to stop to many false positives ie VVIX falls of faster than VIX.
You can also use this loosely as a bottom finder.

The dispersion of volatility indicesThe script is my implementation of "Forecasting a Volatility Tsunami" by Andrew Thrasher (Thrasher Analytics). You can find the paper here: www.researchgate.net
I've changed a bit the approach - instead of two volatility indices (VIX & VVIX), I used two more: VXN and VXD. Additionally, I average the percentiles, but there is an option to swtich it to the original approach.

Correlation overlayThe script is intended to indicate when the correlation between VIX and VVIX gets below 0, on the selecteted security chart. It makes sense to plot it on indicies. This aims to present how the chart of a security looked like when the divergance between VIX and VVIX happened.

VIX Near-Term Futures CurveThis indicator provides a 3 day smoothed histogram expressing whether the near term VIX futures curve is in a state of contango or backwardation. The solid red/green bars express the spot vs front-month vs next month curve with the value being the cumulative point spread between them. The shaded overlay bars express the spread between the VIX spot index and front-month futures contract only.
This indicator is to be used on a 1 DAY interval or higher.

MOVE/VXTLT CorrelationMany know of the VIX for equity trading. Yet, many are unaware that there is the same kind of volatility measure for trading bonds, called the MOVE Index.
"The Merrill Lynch Option Volatility Estimate (MOVE) Index is a yield curve weighted index of the normalized implied volatility on 1-month Treasury options which are weighted on the 2, 5, 10, and 30 year contracts."
With this script one can see the the correlation and divergences between bonds and its volatility measure to make educated decisions in trading or hedging.
The idea of this script comes from NicTheMajestic.


VIX Implied Move Bands for ES/Emini futuresThis script uses the close of the VIX on a daily resolution to provide the 'implied move' for the E-mini SP500 futures. While it can be applied to any equity index, it's crucial to know that the VIX is calculated using SPX options, and may not reflect the implied volatility of other indices. The user can adjust the length of the moving average used to calculate the bands, the window of days used to calculate the implied move, and the multiplier that effects the width of the bands.

Vix SpikeThis script calculates spikes Vix tops and bottoms. The Vix Market Bottom is calculated using CM_Williams_Vix_Fix Finds Market Bottoms (Chris Moody). The Vix Market Top is calculated as the inverse of CM Williams’ formula.
The highest Vix Bottom and the highest Vix Top are averaged (over the Highest Vix Lookback period).
Buys are signaled when the Vix Bottom line crosses below the Highest Vix Average.
Sells are signaled when the Vix Top line crosses below Highest Vix Average.
BINANCE:ETHUSDT 5 min
BYBIT:XRPUSD 5 min

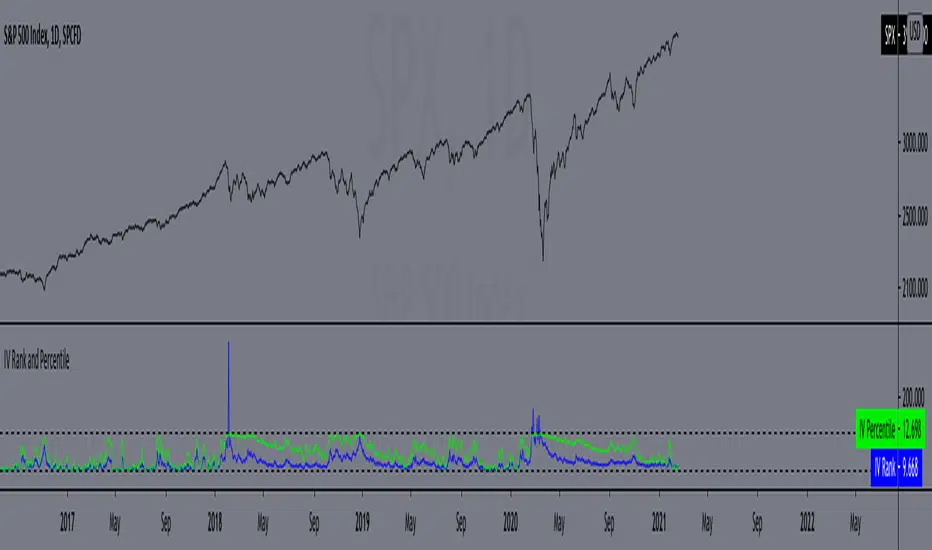
IV Rank and Percentile"All stocks in the market have unique personalities in terms of implied volatility (their option prices). For example, one stock might have an implied volatility of 30%, while another has an implied volatility of 50%. Even more, the 30% IV stock might usually trade with 20% IV, in which case 30% is high. On the other hand, the 50% IV stock might usually trade with 75% IV, in which case 50% is low.
So, how do we determine whether a stock's option prices (IV) are relatively high or low?
The solution is to compare each stock's IV against its historical IV levels. We can accomplish this by converting a stock's current IV into a rank or percentile.
Implied Volatility Rank (IV Rank) Explained
Implied volatility rank (IV rank) compares a stock's current IV to its IV range over a certain time period (typically one year).
Here's the formula for one-year IV rank:
(Current IV - 1 Year Low IV) / (1 Year High IV - 1 Year Low IV) * 100
For example, the IV rank for a 20% IV stock with a one-year IV range between 15% and 35% would be:
(20% - 15%) / (35% - 15%) = 25%
An IV rank of 25% means that the difference between the current IV and the low IV is only 25% of the entire IV range over the past year, which means the current IV is closer to the low end of historical levels of implied volatility.
Furthermore, an IV rank of 0% indicates that the current IV is the very bottom of the one-year range, and an IV rank of 100% indicates that the current IV is at the top of the one-year range.
Implied Volatility Percentile (IV Percentile) Explained
Implied volatility percentile (IV percentile) tells you the percentage of days in the past that a stock's IV was lower than its current IV.
Here's the formula for calculating a one-year IV percentile:
Number of trading days below current IV / 252 * 100
As an example, let's say a stock's current IV is 35%, and in 180 of the past 252 days, the stock's IV has been below 35%. In this case, the stock's 35% implied volatility represents an IV percentile equal to:
180/252 * 100 = 71.42%
An IV percentile of 71.42% tells us that the stock's IV has been below 35% approximately 71% of the time over the past year.
Applications of IV Rank and IV Percentile
Why does it help to know whether a stock's current implied volatility is relatively high or low? Well, many traders use IV rank or IV percentile as a way to determine appropriate strategies for that stock.
For example, if a stock's IV rank is 90%, then a trader might look to implement strategies that profit from a decrease in the stock's implied volatility, as the IV rank of 90% indicates that the stock's current IV is at the top of its range over the past year (for a one-year IV rank).
On the other hand, if a stock's IV rank is 0%, then traders might look to implement strategies that profit from an increase in implied volatility, as the IV rank of 0% indicates the stock's current implied volatility is at the bottom of its range over the past year."
This script approximates IV by using the VIX products, which calculate the 30-day implied volatility of the specified security.
*Includes an option for repainting -- default value is true, meaning the script will repaint the current bar.
False = Not Repainting = Value for the current bar is not repainted, but all past values are offset by 1 bar.
True = Repainting = Value for the current bar is repainted, but all past values are correct and not offset by 1 bar.
In both cases, all of the historical values are correct, it is just a matter of whether you prefer the current bar to be realistically painted and the historical bars offset by 1, or the current bar to be repainted and the historical data to match their respective price bars.
As explained by TradingView,`f_security()` is for coders who want to offer their users a repainting/no-repainting version of the HTF data.
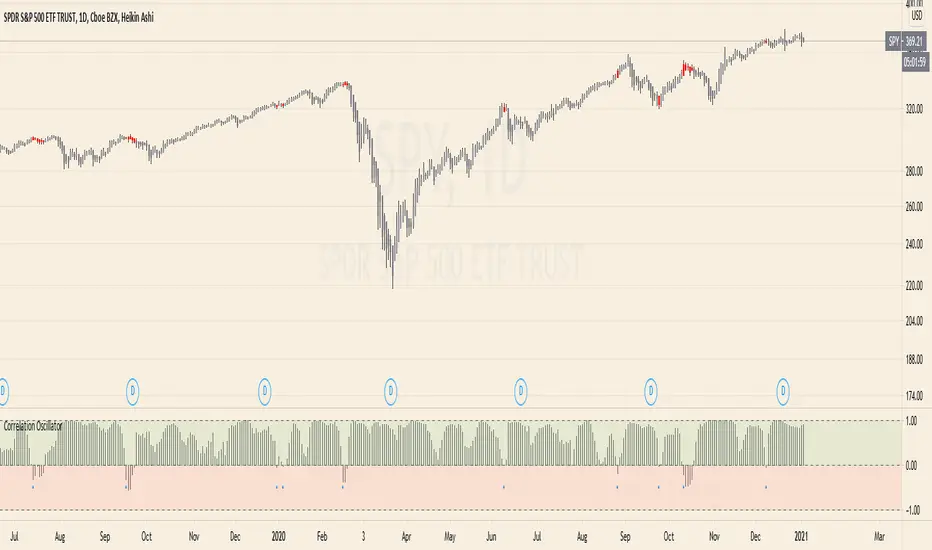
Correlation Oscillator - Anomaly AlertsThis script plots the correlation for two symbols as an oscillator:
A correlation of 1 means that both values move in the same direction together.
A correlation of -1 means that both values are perfectly negative correlated.
Parameter:
Length of the Correlation
The two symbols you want to calculate the correlation for
Barcolor: Defines whether Bar-coloring is set on.
The Number of bars lookback for anomaly: Say both are normally positively correlated it is an anomaly when the correlation turns negative and vica-versa.
Alerts: You can also set an Alert when an anomaly is detected.(blue dots on oscillator)
This has many use-cases:
For example VVIX and VIX are normally positive correlated.
When this turns negative, this can mean that we are on a turning point:
--> VVIX is rising while VIX is falling, risk of future Volatility is increasing (Top)
--> VIX is rising while VVIX is falling, risk of future Volatility is decreasing (Bottom)
Another use-case is just checking the correlation of stocks in your portfolio to diversify.
Daily Crypto StrategyThis is a long only strategy.
This strategy measures and creates a signal when an asset is moving out of a correlation with CBOE VIX into an inverse correlation.
It also has a risk management with TP/SL based on percentages.
If you have any questions let me know.

VIX Term StructureThis script allows users to visualize the state of the VIX Futures Term Structure. The user is able to select from five CBOE VIX Indices; VIX, VIX9D, VIX3M, VIX6M, and VIX1Y and the script will color the candles based on the price relationship between selected indices. Visit the CBOE website for more info on how the various VIX indices are calculated.

Velocity To Inverse Correlation to VIX/Bonds Strategy (2020)This strategy measures and creates a signal when an asset is moving out of a correlation with high yield bonds or the CBOE VIX into an inverse correlation, as well as when an asset is losing correlation with a top corporate bonds ETF. When this signal is triggered, the simulation has the portfolio asset go long.
Additionally, exits are based on a 2% stop loss and a 2% take profit for simplicity sake to indicate whether the direct next move in the asset is up or down.
This was originally tested as a descent indicator for Ethereum's 2020 moves as institutional investors moved into the market.

VIX MTF MomentumSweet little momentum gadget to track the VIX Index.
What is the VIX?
The CBOE S&P 500 Volatility Index (VIX) is known as the 'Fear Index' which can measure how worried traders are that the S&P 500 might suddenly drop within the next 30 days.
When the VIX starts moving higher, it is telling you that traders are getting nervous. When the VIX starts moving lower, it is telling you that traders are gaining confidence.
VIX calculation?
The Chicago Board of Options Exchange Market Volatility Index (VIX) is a measure of implied volatility (Of the S&P 500 securities options), based on the prices of a basket of S&P 500 Index options with 30 days to expiration.
How to use:
If VIX Momentum is above 0 (RED) traders are getting nervous.
If VIX Momentum is below 0 (GREEN) traders are gaining confidence.
Follow to get updates and new scripts: www.tradingview.com

VIX CorrelationIndicator tracks the 10 day correlation with VIX. I prefer to use this with SPY. Can be a great way to flag tops/melt-ups.
Default settings are set to when the correlation is above 0.2, bars turn red, but you can change this.

Finnie's RSI + 3EMA crossover + MFI + Vix Fix-added a medium and long term rsiEMA, in addition to the previous short term, except this time there's a visual crossover :)
-added CM Williams vix fix
-and finally just a general visual overhaul!

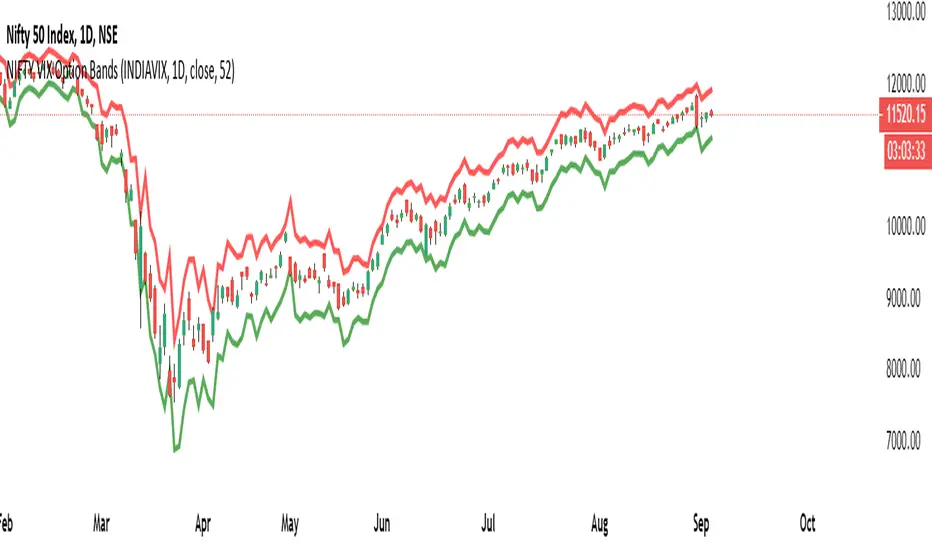
NIFTY VIX Bands1) The script takes current INDIA VIX as input Daily time frame for NIFTY
2) Used a Formula VIX Value / Square root of Time Period
3) Change Timeframe input accordingly 1 Year = 1, Monthly = 12, Weekly = 52, Daily = 365
4) based point 2 formula with 1 standard deviation it creates upper & lower range bands
5) This is generally used for option selling by big traders they go and sell above the band strikes
VIX3M/1M ratioThis script simply calculates and plots the VIX 3 month versus 1 month ratio. Values below 1 indicate a strong panic situation in the market (1 month volatility is higher than the 3 month volatiliy). This might be a good opportunity to sell options.
