Didi Index Pro – NNFX Trend Indicator [UTS]📈 Uber Didi Index Pro – NNFX Trend Indicator
A Top 100 NNFX-Compliant Trend Indicator – Refined for Rule-Based Traders
This enhanced Didi Index is a purpose-built trend indicator optimized for No Nonsense Forex (NNFX) systems. It reimagines the classic Brazilian Didi Index with powerful upgrades designed for serious, rules-based trading.
🔍 What Makes This Version Unique?
✅ NNFX-Adjusted Logic
• Removes short/fast MAs to reduce noise
• Designed to work only with long-period moving averages – as per VP’s recommendations
🔁 Inverted & Zero-Centered
• Deviations are plotted relative to the medium MA baseline at zero
• Inverted formula offers better signal clarity (e.g., rising above zero = uptrend)
🎛️ Customizable with 25+ Moving Average Types
• Choose SMA, EMA, WMA, VWMA, Hull, LSMA, and more
• Tune each line individually to match your system rules
📢 Alerts Built In
• Set alerts for crossovers, entering/exiting zones, or custom signal events
• Works as a primary confirmation, secondary confirmation or even exit indicator
🎯 Clean Signals, Fast Readability
• Removed the "Curta" and relies on the better "Longa" line relative to a zero centered "Media" line
• Great for confirming higher timeframe trends or filtering false entries
🕰️ History & Context
Originally developed by Brazilian trader Odir “Didi” Aguiar, the Didi Index compares short, medium, and long moving averages to spot market compression and expansions. This version repurposes the idea for trend-following, not mean reversion, and fully aligns with NNFX methodology.
📎 How to Use in NNFX Systems
Use this indicator as part of your C1 or C2 (confirmation) indicator:
When the Longa line is above zero → Bias = Long
When the Longa line is below zero → Bias = Short
Avoid trades when both lines are tightly compressed near zero
✅ Designed by traders who follow the rules.
✅ Built for traders who want clarity, consistency, and compliance.
🚀 Moving Averages
Trend-determining method offers 26 high quality Moving averages to choose.
"SMA", Simple Moving Average, R. H. Hooker, 1901
"EMA", Exponential Moving Average, P. N. Haurlan, early 1960s
"MDMA", McGinley Dynamic MA, John R. McGinley, 1990s
"DSEMA", Double Smoothed EMA, William Blau, year unknown
"DEMA", Double EMA, Patrick G. Mulloy, 1994
"TEMA", Triple EMA, Patrick G. Mulloy, 1994
"WMA", Weighted MA, Author and year unknown
"PWMA", Parabolic Weighted MA, Author and year unknown
"VWMA", Volume Weighted MA, Author and year unknown
"HULL", Hull MA, Alan Hull, 2005, year unknown
"TMA", Triangular MA, Author and year unknown
"B2P", Two Pole Ehlers Butterworth, John F. Ehlers, 2004
"S2P", Two Pole Ehlers Smoother, John F. Ehlers, year unknown
"S3P", Three Pole Ehlers Smoother, John F. Ehlers, year unknown
"SINE", Sine Weighted MA, Author and year unknown
"LINREG", Linear Regression Value (LSMA), Author and year unknown
"ILINREG", Integral of Linear Regression Slope, Author and year unknown
"NLMA", Non Lag MA, Author and year unknown
"ZLMA", Zero Lag MA, Author and year unknown
"KIJUN", Kijun-Sen Ichimoku, Goichi Hosoda, late 1930s
"SSM", Super Smoother, John F. Ehlers, year unknown
"ALMA", Arnaud Legoux MA, Arnaud Legoux, year unknown
"KAMA", Kaufman Adaptive MA, Perry J. Kaufman, 1998
"FRAMA", Fractal MA, John F. Ehlers, year unknown
"RMA", Running MA, J. Welles Wilder Jr., 1978
"JMA", Jurik Moving Average, Mark Jurik, year unknown
🚥 Signals
The indicator displays buy/sell signals, Beyond-ATR signals, and recommends when a pullback entry is possible.
Long Signal
Short Signal
📢 Alerts
Each chart signal can trigger an alert with the same name. To avoid multiple alerts being triggered within a single candle, it is recommended to wait for the candle to close and use the 'Once Per Bar Close' setting.
Long Signal
Short Signal
🗃️ About
Name: Uber Didi Index Pro – NNFX Trend Indicator
Created: 2025/06/20
PineScript: v6
Uts

Uber TDFI - Trend Direction & Force Index [UTS]The TDFI indicator is a highly precise and faithful adaptation of Mladen's well-known Trend Direction Force Index (TDFT), originally developed in MQ4 format and published on Forex-Station. This TradingView implementation has been meticulously crafted to mirror the exact behavior and calculation logic of the original, ensuring that users experience the same accuracy and analytical depth that made the MQ4 version widely respected among professional traders.
What sets TDFI apart from other trend indicators is its robust foundation and flexibility:
Authentic Calculation Method: Unlike simplified or reinterpreted versions, this script stays true to Mladen’s original computation method, delivering consistent results aligned with his vision of trend force analysis.
26 Moving Average Options: TDFI incorporates a comprehensive selection of 26 moving average types, allowing traders to tailor the trend detection mechanism to suit various market conditions and personal trading styles. This level of configurability is rarely seen and provides a substantial edge in both backtesting and live decision-making.
Advanced Smoothing Capabilities: The indicator supports quadratic smoothing and includes adjustable phase and smooth parameters, further enhancing signal clarity and responsiveness. These features replicate the full feature set of the original MQ4 version, offering granular control over the indicator’s behavior.
TDFI is designed for traders who prioritize precision, adaptability, and analytical fidelity. Whether you are building a new strategy or enhancing an existing one, this tool offers the depth and reliability required for serious technical analysis.
Trend Methods
Trend-determining method offers 26 high quality Moving averages to choose.
"SMA", Simple Moving Average, R. H. Hooker, 1901
"EMA", Exponential Moving Average, P. N. Haurlan, early 1960s
"MDMA", McGinley Dynamic MA, John R. McGinley, 1990s
"DSEMA", Double Smoothed EMA, William Blau, year unknown
"DEMA", Double EMA, Patrick G. Mulloy, 1994
"TEMA", Triple EMA, Patrick G. Mulloy, 1994
"WMA", Weighted MA, Author and year unknown
"PWMA", Parabolic Weighted MA, Author and year unknown
"VWMA", Volume Weighted MA, Author and year unknown
"HULL", Hull MA, Alan Hull, 2005, year unknown
"TMA", Triangular MA, Author and year unknown
"B2P", Two Pole Ehlers Butterworth, John F. Ehlers, 2004
"S2P", Two Pole Ehlers Smoother, John F. Ehlers, year unknown
"S3P", Three Pole Ehlers Smoother, John F. Ehlers, year unknown
"SINE", Sine Weighted MA, Author and year unknown
"LINREG", Linear Regression Value (LSMA), Author and year unknown
"ILINREG", Integral of Linear Regression Slope, Author and year unknown
"NLMA", Non Lag MA, Author and year unknown
"ZLMA", Zero Lag MA, Author and year unknown
"SMOOTHER", Smoother, Author and year unknown
"SSM", Super Smoother, John F. Ehlers, year unknown
"ALMA", Arnaud Legoux MA, Arnaud Legoux, year unknown
"KAMA", Kaufman Adaptive MA, Perry J. Kaufman, 1998
"FRAMA", Fractal MA, John F. Ehlers, year unknown
"RMA", Running MA, J. Welles Wilder Jr., 1978
"JMA", Jurik Moving Average, Mark Jurik, year unknown
Signals
The indicator displays buy/sell signals on trigger-line cross, optionally on zero line cross.
Long Signal
Short Signal
Alerts
Each chart signal can trigger an alert with the same name. To avoid multiple alerts being triggered within a single candle, it is recommended to wait for the candle to close and use the 'Once Per Bar Close' setting.
Long Signal
Short Signal
About
Name: Uber TDFI - Trend Direction & Force Index
Created: 2025/04/02
PineScript: v6
Uber TDFI - Lite: Trend Direction & Force Index [UTS]The TDFI indicator is a highly precise and faithful adaptation of Mladen's well-known Trend Direction Force Index (TDFT), originally developed in MQ4 format and published on Forex-Station. This TradingView implementation has been meticulously crafted to mirror the exact behavior and calculation logic of the original, ensuring that users experience the same accuracy and analytical depth that made the MQ4 version widely respected among professional traders.
What sets TDFI apart from other trend indicators is its robust foundation and flexibility:
Authentic Calculation Method: Unlike simplified or reinterpreted versions, this script stays true to Mladen’s original computation method, delivering consistent results aligned with his vision of trend force analysis.
26 Moving Average Options: TDFI incorporates a comprehensive selection of 26 moving average types, allowing traders to tailor the trend detection mechanism to suit various market conditions and personal trading styles. This level of configurability is rarely seen and provides a substantial edge in both backtesting and live decision-making.
Advanced Smoothing Capabilities: The indicator supports quadratic smoothing and includes adjustable phase and smooth parameters, further enhancing signal clarity and responsiveness. These features replicate the full feature set of the original MQ4 version, offering granular control over the indicator’s behavior.
TDFI is designed for traders who prioritize precision, adaptability, and analytical fidelity. Whether you are building a new strategy or enhancing an existing one, this tool offers the depth and reliability required for serious technical analysis.
Trend Methods
Trend-determining method offers 26 high quality Moving averages to choose.
"SMA", Simple Moving Average, R. H. Hooker, 1901
"EMA", Exponential Moving Average, P. N. Haurlan, early 1960s
"MDMA", McGinley Dynamic MA, John R. McGinley, 1990s
"DSEMA", Double Smoothed EMA, William Blau, year unknown
"DEMA", Double EMA, Patrick G. Mulloy, 1994
"TEMA", Triple EMA, Patrick G. Mulloy, 1994
"WMA", Weighted MA, Author and year unknown
"PWMA", Parabolic Weighted MA, Author and year unknown
"VWMA", Volume Weighted MA, Author and year unknown
"HULL", Hull MA, Alan Hull, 2005, year unknown
"TMA", Triangular MA, Author and year unknown
"B2P", Two Pole Ehlers Butterworth, John F. Ehlers, 2004
"S2P", Two Pole Ehlers Smoother, John F. Ehlers, year unknown
"S3P", Three Pole Ehlers Smoother, John F. Ehlers, year unknown
"SINE", Sine Weighted MA, Author and year unknown
"LINREG", Linear Regression Value (LSMA), Author and year unknown
"ILINREG", Integral of Linear Regression Slope, Author and year unknown
"NLMA", Non Lag MA, Author and year unknown
"ZLMA", Zero Lag MA, Author and year unknown
"SMOOTHER", Smoother, Author and year unknown
"SSM", Super Smoother, John F. Ehlers, year unknown
"ALMA", Arnaud Legoux MA, Arnaud Legoux, year unknown
"KAMA", Kaufman Adaptive MA, Perry J. Kaufman, 1998
"FRAMA", Fractal MA, John F. Ehlers, year unknown
"RMA", Running MA, J. Welles Wilder Jr., 1978
"JMA", Jurik Moving Average, Mark Jurik, year unknown
Signals
The indicator displays buy/sell signals on trigger-line cross, optionally on zero line cross.
Long Signal
Short Signal
Alerts
Each chart signal can trigger an alert with the same name. To avoid multiple alerts being triggered within a single candle, it is recommended to wait for the candle to close and use the 'Once Per Bar Close' setting.
Long Signal
Short Signal
Lite Version Constraints
The 'Lite' version keeps things easy, focused on forex and EUR/USD.
About
Name: Uber TDFI - Lite: Trend Direction & Force Index
Created: 2025/04/02
PineScript: v6

Uber Baseline V2 - NNFX Edition [UTS]Uber Baseline V2 – NNFX Edition
Uber Baseline V2 – NNFX Edition is a highly customizable baseline component designed for seamless integration into any trading system. Tailored specifically for the No Nonsense Forex (NNFX) methodology, it serves as a powerful trend filter—helping traders stay aligned with the dominant market direction while avoiding low-probability trades during consolidation.
Choose from 26 high-quality moving averages to find the perfect-fitting baseline for your trading style. Whether you're trend-following or building a complete NNFX stack, this tool adapts to your strategy with precision and clarity.
Usage
🧭 Baseline as Trend Filter
Direction: Trade only in the direction of the baseline. A long entry is only valid if the price closes above the baseline; a short entry only if it closes below.
As VP explains, the baseline “is making sure you are getting into trades that are trending, keeping you out of trades that aren’t trending” and signals exits when trends fail.
📈 Entry Rule (Baseline Cross + ATR)
Baseline Cross: An entry occurs only when price crosses and closes on the opposite side of the baseline.
ATR Zone: The close must lie within a ±1×ATR band around the baseline. In other words, price must close within “the 1 ATR zone of the baseline”.
Confirmations: All primary/secondary confirmation indicators and volume must agree with the move.
“An entry should occur when price crosses the baseline and the price is within the 1 ATR zone of the baseline and all of your indicators agreeing.”
🔁 Beyond-ATR & Pullback Rule
No Immediate Entry: If a baseline signal occurs while price is outside the ±1×ATR band, do not enter immediately. Treat this as a pullback scenario.
Wait for Retrace:
“WATCH for next candle” – enter only when the next bar closes back within the 1×ATR band around the baseline.
If price had closed beyond 1×ATR, only enter when a subsequent candle closes within 1×ATR of the baseline, with all indicators still aligned.
“If Price closes within 1×ATR of Baseline you can enter trade.”
⏳ One-Candle Rule
Filter Lag: If the primary confirmation (C1) fires but the secondary or volume indicators have not yet signaled, you may delay entry by one bar.
Second Chance Entry:
“You can wait one more candle after and enter if your secondary indicator and/or volume indicator have caught up and are giving you a signal.”
This delay is allowed only once per signal and all conditions must be met on the second candle.
Moving Averages
Trend-determining method offers 26 high quality Moving averages to choose.
"SMA", Simple Moving Average, R. H. Hooker, 1901
"EMA", Exponential Moving Average, P. N. Haurlan, early 1960s
"MDMA", McGinley Dynamic MA, John R. McGinley, 1990s
"DSEMA", Double Smoothed EMA, William Blau, year unknown
"DEMA", Double EMA, Patrick G. Mulloy, 1994
"TEMA", Triple EMA, Patrick G. Mulloy, 1994
"WMA", Weighted MA, Author and year unknown
"PWMA", Parabolic Weighted MA, Author and year unknown
"VWMA", Volume Weighted MA, Author and year unknown
"HULL", Hull MA, Alan Hull, 2005, year unknown
"TMA", Triangular MA, Author and year unknown
"B2P", Two Pole Ehlers Butterworth, John F. Ehlers, 2004
"S2P", Two Pole Ehlers Smoother, John F. Ehlers, year unknown
"S3P", Three Pole Ehlers Smoother, John F. Ehlers, year unknown
"SINE", Sine Weighted MA, Author and year unknown
"LINREG", Linear Regression Value (LSMA), Author and year unknown
"ILINREG", Integral of Linear Regression Slope, Author and year unknown
"NLMA", Non Lag MA, Author and year unknown
"ZLMA", Zero Lag MA, Author and year unknown
"SMOOTHER", Smoother, Author and year unknown
"SSM", Super Smoother, John F. Ehlers, year unknown
"ALMA", Arnaud Legoux MA, Arnaud Legoux, year unknown
"KAMA", Kaufman Adaptive MA, Perry J. Kaufman, 1998
"FRAMA", Fractal MA, John F. Ehlers, year unknown
"RMA", Running MA, J. Welles Wilder Jr., 1978
"JMA", Jurik Moving Average, Mark Jurik, year unknown
Signals
The indicator displays buy/sell signals, Beyond-ATR signals, and recommends when a pullback entry is possible.
Long Signal
Short Signal
Beyond-ATR: Long Signal
Beyond-ATR: Short Signal
Pullback Possible: Long Signal
Pullback Possible: Short Signal
Alerts
Each chart signal can trigger an alert with the same name. To avoid multiple alerts being triggered within a single candle, it is recommended to wait for the candle to close and use the 'On Bar Close' setting.
Long Signal
Short Signal
Beyond-ATR: Long Signal
Beyond-ATR: Short Signal
Pullback Possible: Long Signal
Pullback Possible: Short Signal
About
Name: Uber Baseline V2 - NNFX Edition
Created: 2025/05/09
PineScript: v6

Uber Baseline V2 - Lite: NNFX Edition [UTS]Uber Baseline V2 – NNFX Edition
Uber Baseline V2 – NNFX Edition is a highly customizable baseline component designed for seamless integration into any trading system. Tailored specifically for the No Nonsense Forex (NNFX) methodology, it serves as a powerful trend filter—helping traders stay aligned with the dominant market direction while avoiding low-probability trades during consolidation.
Choose from 26 high-quality moving averages to find the perfect-fitting baseline for your trading style. Whether you're trend-following or building a complete NNFX stack, this tool adapts to your strategy with precision and clarity.
Usage
🧭 Baseline as Trend Filter
Direction: Trade only in the direction of the baseline. A long entry is only valid if the price closes above the baseline; a short entry only if it closes below.
As VP explains, the baseline “is making sure you are getting into trades that are trending, keeping you out of trades that aren’t trending” and signals exits when trends fail.
📈 Entry Rule (Baseline Cross + ATR)
Baseline Cross: An entry occurs only when price crosses and closes on the opposite side of the baseline.
ATR Zone: The close must lie within a ±1×ATR band around the baseline. In other words, price must close within “the 1 ATR zone of the baseline”.
Confirmations: All primary/secondary confirmation indicators and volume must agree with the move.
“An entry should occur when price crosses the baseline and the price is within the 1 ATR zone of the baseline and all of your indicators agreeing.”
🔁 Beyond-ATR & Pullback Rule
No Immediate Entry: If a baseline signal occurs while price is outside the ±1×ATR band, do not enter immediately. Treat this as a pullback scenario.
Wait for Retrace:
“WATCH for next candle” – enter only when the next bar closes back within the 1×ATR band around the baseline.
If price had closed beyond 1×ATR, only enter when a subsequent candle closes within 1×ATR of the baseline, with all indicators still aligned.
“If Price closes within 1×ATR of Baseline you can enter trade.”
⏳ One-Candle Rule
Filter Lag: If the primary confirmation (C1) fires but the secondary or volume indicators have not yet signaled, you may delay entry by one bar.
Second Chance Entry:
“You can wait one more candle after and enter if your secondary indicator and/or volume indicator have caught up and are giving you a signal.”
This delay is allowed only once per signal and all conditions must be met on the second candle.
Moving Averages
Trend-determining method offers 26 high quality Moving averages to choose.
"SMA", Simple Moving Average, R. H. Hooker, 1901
"EMA", Exponential Moving Average, P. N. Haurlan, early 1960s
"MDMA", McGinley Dynamic MA, John R. McGinley, 1990s
"DSEMA", Double Smoothed EMA, William Blau, year unknown
"DEMA", Double EMA, Patrick G. Mulloy, 1994
"TEMA", Triple EMA, Patrick G. Mulloy, 1994
"WMA", Weighted MA, Author and year unknown
"PWMA", Parabolic Weighted MA, Author and year unknown
"VWMA", Volume Weighted MA, Author and year unknown
"HULL", Hull MA, Alan Hull, 2005, year unknown
"TMA", Triangular MA, Author and year unknown
"B2P", Two Pole Ehlers Butterworth, John F. Ehlers, 2004
"S2P", Two Pole Ehlers Smoother, John F. Ehlers, year unknown
"S3P", Three Pole Ehlers Smoother, John F. Ehlers, year unknown
"SINE", Sine Weighted MA, Author and year unknown
"LINREG", Linear Regression Value (LSMA), Author and year unknown
"ILINREG", Integral of Linear Regression Slope, Author and year unknown
"NLMA", Non Lag MA, Author and year unknown
"ZLMA", Zero Lag MA, Author and year unknown
"SMOOTHER", Smoother, Author and year unknown
"SSM", Super Smoother, John F. Ehlers, year unknown
"ALMA", Arnaud Legoux MA, Arnaud Legoux, year unknown
"KAMA", Kaufman Adaptive MA, Perry J. Kaufman, 1998
"FRAMA", Fractal MA, John F. Ehlers, year unknown
"RMA", Running MA, J. Welles Wilder Jr., 1978
"JMA", Jurik Moving Average, Mark Jurik, year unknown
Signals
The indicator displays buy/sell signals, Beyond-ATR signals, and recommends when a pullback entry is possible.
Long Signal
Short Signal
Beyond-ATR: Long Signal
Beyond-ATR: Short Signal
Pullback Possible: Long Signal
Pullback Possible: Short Signal
Alerts
Each chart signal can trigger an alert with the same name. To avoid multiple alerts being triggered within a single candle, it is recommended to wait for the candle to close and use the 'On Bar Close' setting.
Long Signal
Short Signal
Beyond-ATR: Long Signal
Beyond-ATR: Short Signal
Pullback Possible: Long Signal
Pullback Possible: Short Signal
Lite Version Constraints
The 'Lite' version keeps things easy, focused on forex and EUR/USD.
About
Name: Uber Baseline V2 – Lite: NNFX Edition
Created: 2025/05/09
PineScript: v6
UTSStrategyHelperLibrary "UTSStrategyHelper"
TODO: add library description here
stopLossPrice(sig, atr, factor, isLong)
Calculates the stop loss price using a distance determined by ATR multiplied by a factor. Example for Long trade SL: PRICE - (ATR * factor).
Parameters:
sig (float)
atr (float) : (float): The value of the atr.
factor (float)
isLong (bool) : (bool): The current trade direction.
Returns: (bool): A boolean value.
takeProfitPrice(sig, atr, factor, isLong)
Calculates the take profit price using a distance determined by ATR multiplied by a factor. Example for Long trade TP: PRICE + (ATR * factor). When take profit price is reached usually 50 % of the position is closed and the other 50 % get a trailing stop assigned.
Parameters:
sig (float)
atr (float) : (float): The value of the atr.
factor (float)
isLong (bool) : (bool): The current trade direction.
Returns: (bool): A boolean value.
trailingStopPrice(initialStopPrice, atr, factor, priceSource, isLong)
Calculates a trailing stop price using a distance determined by ATR multiplied by a factor. It takes an initial price and follows the price closely if it changes in a favourable way.
Parameters:
initialStopPrice (float) : (float): The initial stop price which, for consistency also should be ATR * factor behind price: e.g. Long trade: PRICE - (ATR * factor)
atr (float) : (float): The value of the atr. Ideally the ATR value at trade open is taken and used for subsequent calculations.
factor (float)
priceSource (float) : (float): The current price.
isLong (bool) : (bool): The current trade direction.
Returns: (bool): A boolean value.
hasGreaterPositionSize(positionSize)
Determines if the strategy's position size has grown since the last bar.
Parameters:
positionSize (float) : (float): The size of the position.
Returns: (bool): A boolean value.
hasSmallerPositionSize(positionSize)
Determines if the strategy's position size has decreased since the last bar.
Parameters:
positionSize (float) : (float): The size of the position.
Returns: (bool): A boolean value.
hasUnchangedPositionSize(positionSize)
Determines if the strategy's position size has changed since the last bar.
Parameters:
positionSize (float) : (float): The size of the position.
Returns: (bool): A boolean value.
exporthasLongPosition(positionSize)
Determines if the strategy has an open long position.
Parameters:
positionSize (float) : (float): The size of the position.
Returns: (bool): A boolean value.
hasShortPosition(positionSize)
Determines if the strategy has an open short position.
Parameters:
positionSize (float) : (float): The size of the position.
Returns: (bool): A boolean value.
hasAnyPosition(positionSize)
Determines if the strategy has any open position, regardless of short or long.
Parameters:
positionSize (float) : (float): The size of the position.
Returns: (bool): A boolean value.
hasSignal(value)
Determines if the given argument contains a valid value (means not 'na').
Parameters:
value (float) : (float): The actual value.
Returns: (bool): A boolean value.

UTSConvenienceToolsLibrary "UTSConvenienceTools"
Convenience tool library containing helper functions for drawing and charting.
isDarkColor(color)
Determines on base of the luminance of the given color if the color can be considered a 'dark' color. Usefull for determining the readable font color for arbitrary colored backgrounds. Credits out to:
Parameters:
color (color) : (color): The actual color value.
Returns: (bool): A boolean value.
smallLabelLowerRight(txt, yPos, bgColor)
Displays the specified `txt` in a small label at the `yPos` of the current bar. The label points to the lower right.
Parameters:
txt (string)
yPos (float) : (float): The y-position value. To have it positioned above the candle pass 'high'.
bgColor (color) : (color): The background color value.
Returns: (bool): A boolean value.
smallLabelUpperRight(txt, yPos, bgColor)
Displays the specified `txt` in a small label at the `yPos` of the current bar. The label points to the upper right.
Parameters:
txt (string)
yPos (float) : (float): The y-position value. To have it positioned below the candle pass 'low'.
bgColor (color) : (color): The background color value.
Returns: (bool): A boolean value.
smallLabelCenter(txt, yPos, bgColor)
Displays the specified `txt` in a small label at the `yPos` of the current bar. The label points to the center.
Parameters:
txt (string)
yPos (float) : (float): The y-position value. To have it positioned above the candle pass 'high'. To have it positioned below the candle pass 'low'.
bgColor (color) : (color): The background color value.
Returns: (bool): A boolean value.
smallLabelDown(txt, yPos, bgColor)
Displays the specified `txt` in a small label at the `yPos` of the current bar. The label points down.
Parameters:
txt (string)
yPos (float) : (float): The y-position value. To have it positioned above the candle pass 'high'.
bgColor (color) : (color): The background color value.
Returns: (bool): A boolean value.
smallLabelUp(txt, yPos, bgColor)
Displays the specified `txt` in a small label at the `yPos` of the current bar. The label points down.
Parameters:
txt (string)
yPos (float) : (float): The y-position value. To have it positioned below the candle pass 'low'.
bgColor (color) : (color): The background color value.
Returns: (bool): A boolean value.
normalLabelLowerRight(txt, yPos, bgColor)
Displays the specified `txt` in a normal label at the `yPos` of the current bar. The label points to the lower right.
Parameters:
txt (string)
yPos (float) : (float): The y-position value. To have it positioned above the candle pass 'high'.
bgColor (color) : (color): The background color value.
Returns: (bool): A boolean value.
normalLabelUpperRight(txt, yPos, bgColor)
Displays the specified `txt` in a normal label at the `yPos` of the current bar. The label points to the upper right.
Parameters:
txt (string)
yPos (float) : (float): The y-position value. To have it positioned below the candle pass 'low'.
bgColor (color) : (color): The background color value.
Returns: (bool): A boolean value.
normalLabelCenter(txt, yPos, bgColor)
Displays the specified `txt` in a normal label at the `yPos` of the current bar. The label points to the center.
Parameters:
txt (string)
yPos (float) : (float): The y-position value. To have it positioned above the candle pass 'high'. To have it positioned below the candle pass 'low'.
bgColor (color) : (color): The background color value.
Returns: (bool): A boolean value.
normalLabelDown(txt, yPos, bgColor)
Displays the specified `txt` in a normal label at the `yPos` of the current bar. The label points down.
Parameters:
txt (string)
yPos (float) : (float): The y-position value. To have it positioned above the candle pass 'high'.
bgColor (color) : (color): The background color value.
Returns: (bool): A boolean value.
normalLabelUp(txt, yPos, bgColor)
Displays the specified `txt` in a normal label at the `yPos` of the current bar. The label points down.
Parameters:
txt (string)
yPos (float) : (float): The y-position value. To have it positioned below the candle pass 'low'.
bgColor (color) : (color): The background color value.
Returns: (bool): A boolean value.
largeLabelLowerRight(txt, yPos, bgColor)
Displays the specified `txt` in a large label at the `yPos` of the current bar. The label points to the lower right.
Parameters:
txt (string)
yPos (float) : (float): The y-position value. To have it positioned above the candle pass 'high'.
bgColor (color) : (color): The background color value.
Returns: (bool): A boolean value.
largeLabelUpperRight(txt, yPos, bgColor)
Displays the specified `txt` in a large label at the `yPos` of the current bar. The label points to the upper right.
Parameters:
txt (string)
yPos (float) : (float): The y-position value. To have it positioned below the candle pass 'low'.
bgColor (color) : (color): The background color value.
Returns: (bool): A boolean value.
largeLabelCenter(txt, yPos, bgColor)
Displays the specified `txt` in a large label at the `yPos` of the current bar. The label points to the center.
Parameters:
txt (string)
yPos (float) : (float): The y-position value. To have it positioned above the candle pass 'high'. To have it positioned below the candle pass 'low'.
bgColor (color) : (color): The background color value.
Returns: (bool): A boolean value.
largeLabelDown(txt, yPos, bgColor)
Displays the specified `txt` in a large label at the `yPos` of the current bar. The label points down.
Parameters:
txt (string)
yPos (float) : (float): The y-position value. To have it positioned above the candle pass 'high'.
bgColor (color) : (color): The background color value.
Returns: (bool): A boolean value.
largeLabelUp(txt, yPos, bgColor)
Displays the specified `txt` in a large label at the `yPos` of the current bar. The label points down.
Parameters:
txt (string)
yPos (float) : (float): The y-position value. To have it positioned below the candle pass 'low'.
bgColor (color) : (color): The background color value.
Returns: (bool): A boolean value.
autoLabelLowerRight(txt, yPos, bgColor)
Displays the specified `txt` in a auto label at the `yPos` of the current bar. The label points to the lower right.
Parameters:
txt (string)
yPos (float) : (float): The y-position value. To have it positioned above the candle pass 'high'.
bgColor (color) : (color): The background color value.
Returns: (bool): A boolean value.
autoLabelUpperRight(txt, yPos, bgColor)
Displays the specified `txt` in a auto label at the `yPos` of the current bar. The label points to the upper right.
Parameters:
txt (string)
yPos (float) : (float): The y-position value. To have it positioned below the candle pass 'low'.
bgColor (color) : (color): The background color value.
Returns: (bool): A boolean value.
autoLabelCenter(txt, yPos, bgColor)
Displays the specified `txt` in a auto label at the `yPos` of the current bar. The label points to the center.
Parameters:
txt (string)
yPos (float) : (float): The y-position value. To have it positioned above the candle pass 'high'. To have it positioned below the candle pass 'low'.
bgColor (color) : (color): The background color value.
Returns: (bool): A boolean value.
autoLabelDown(txt, yPos, bgColor)
Displays the specified `txt` in a auto label at the `yPos` of the current bar. The label points down.
Parameters:
txt (string)
yPos (float) : (float): The y-position value. To have it positioned above the candle pass 'high'.
bgColor (color) : (color): The background color value.
Returns: (bool): A boolean value.
autoLabelUp(txt, yPos, bgColor)
Displays the specified `txt` in a auto label at the `yPos` of the current bar. The label points down.
Parameters:
txt (string)
yPos (float) : (float): The y-position value. To have it positioned below the candle pass 'low'.
bgColor (color) : (color): The background color value.
Returns: (bool): A boolean value.

Uber VQ - Volatility Quality Index [UTS]Name: Uber VQI - Volatility Quality Index
Created: 2022/11/22
Copyright: © UberTradingSystems
Description:
The volatility quality index was first introduced by Thomas Stridsman in Technical Analysis of Stocks and Commodities magazine in the August 2002 edition.
This powerful indicator points out the difference between bad and good volatility in order to identify better trade opportunities in the market.
It is suggested to use this indicator as a confirmation signal together with the other indicators in your system.
General Usage
Stridsman suggested buying (or "to go long") when VQ has increased in the previous 10 bars and selling (or "to go short") when it has decreased in the previous 10 bars.
This indicator has been updated to reflect its modern iterations. One of the following signals are choosable trading signal generator:
VQ Sum
Short MA
Long MA
All three signal triggering conditions can selectively be drawn on the indicator for study and reference purposes.
In addition, generated buy and sell signals can be drawn on the indicator and are modifiable too.
Alerts
To allow alert notifications, generated signals are connected as selectable "Long Signal" and "Short Signal" to the indicator alerts.
The conditions can be found on the alert sections of the indicator.
In the menu right to the indicator name, press the three dots and select "Add alert on ...".
Under condition options select one of the following:
Long Signal
Short Signal
It is advised to select "Once per bar close" as alert execution option.
Moving Averages
To fine-tune the "Short MA" and "Long MA" calculation, 16 different Moving Averages are available to choose from:
ALMA (Arnaud Legoux Moving Average)
DEMA (Double Exponential Moving Average)
EMA (Exponential Moving Average)
FRAMA (Fractal Adaptive Moving Average)
HMA (Hull Moving Average)
JURIK (Jurik Moving Average)
KAMA (Kaufman Adaptive Moving Average)
Kijun (Kijun-sen / Tenkan-sen of Ichimoku)
LSMA (Least Square Moving Average)
RMA (Running Moving Average)
SMA (Simple Moving Average)
SuperSmoothed (Super Smoothed Moving Average)
TEMA (Triple Exponential Moving Average)
VWMA (Volume Weighted Moving Average)
WMA (Weighted Moving Average)
ZLEMA (Zero Lag Moving Average)
A freely determinable length allows for sensitivity adjustments that fit your own requirements.

Uber VQ (Lite) - Volatility Quality Index [UTS]Name: Uber VQI (Lite) - Volatility Quality Index
Created: 2022/11/22
Copyright: © UberTradingSystems
Description:
The volatility quality index was first introduced by Thomas Stridsman in Technical Analysis of Stocks and Commodities magazine in the August 2002 edition.
This powerful indicator points out the difference between bad and good volatility in order to identify better trade opportunities in the market.
It is suggested to use this indicator as a confirmation signal together with the other indicators in your system.
Lite Version
Please note that this "Lite" version offers full functionality but is constrained to Euro / US-Dollar trading pairs only.
You can find it as "EURUSD" on many providers such as FXCM, Oanda, Capital.com, Currency.com etc.
If you like this indicator, consider checking out the original. More details under "Author's instructions" and "Signature" sections below.
General Usage
Stridsman suggested buying (or "to go long") when VQ has increased in the previous 10 bars and selling (or "to go short") when it has decreased in the previous 10 bars.
This indicator has been updated to reflect its modern iterations. One of the following signals are choosable trading signal generator:
VQ Sum
Short MA
Long MA
All three signal triggering conditions can selectively be drawn on the indicator for study and reference purposes.
In addition, generated buy and sell signals can be drawn on the indicator and are modifiable too.
Alerts
To allow alert notifications, generated signals are connected as selectable "Long Signal" and "Short Signal" to the indicator alerts.
The conditions can be found on the alert sections of the indicator.
In the menu right to the indicator name, press the three dots and select "Add alert on ...".
Under condition options select one of the following:
Long Signal
Short Signal
It is advised to select "Once per bar close" as alert execution option.
Moving Averages
To fine-tune the "Short MA" and "Long MA" calculation, 16 different Moving Averages are available to choose from:
ALMA (Arnaud Legoux Moving Average)
DEMA (Double Exponential Moving Average)
EMA (Exponential Moving Average)
FRAMA (Fractal Adaptive Moving Average)
HMA (Hull Moving Average)
JURIK (Jurik Moving Average)
KAMA (Kaufman Adaptive Moving Average)
Kijun (Kijun-sen / Tenkan-sen of Ichimoku)
LSMA (Least Square Moving Average)
RMA (Running Moving Average)
SMA (Simple Moving Average)
SuperSmoothed (Super Smoothed Moving Average)
TEMA (Triple Exponential Moving Average)
VWMA (Volume Weighted Moving Average)
WMA (Weighted Moving Average)
ZLEMA (Zero Lag Moving Average)
A freely determinable length allows for sensitivity adjustments that fit your own requirements.
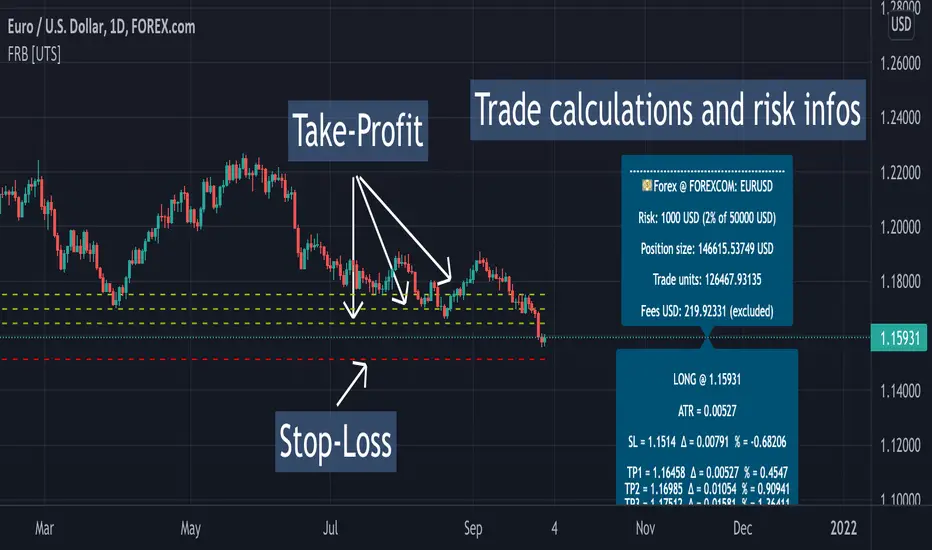
Forex Risk Buddy - Lite: Position Size, SL & TP System [UTS]Forex Risk Buddy - Lite
Position Size, Stop Loss & Take Profit System
The ultimate system to calculate trading risk on forex markets.
The 'Lite' version is limited to the EUR/USD forex trading pair.
💵 Forex
Position Sizing
De-risk possible drawdown by calculating a proper position size.
Define your risk percent based on your net value
Freely define your account currency
Trade any asset by the customizable Base / Quote currency factor
Calculate trading fees
Show all information on a customizable data screen
Stop Loss
Minimize trade risk by calculating your stop-loss.
Percent, Value and Delta display from current price
ATR based (Average True Range, modifiable)
Custom SL value possible
Adjustable
Two visual representations on chart
Automatically and real-time calculated on screen
Take Profit
Multiple take-profit levels to ensure not giving back to the market.
Up to 3 take profit levels to define
ATR based (Average True Range, modifiable)
Custom TP values possible
Easily customizable
Two visual representations on chart
Automatically and real-time calculated on screen
Currencies
Choose an account currency and calculate your risk for every trading pair.
USD
EUR
GBP
AUD
CAD
CHF
HKD
JPY
NOK
NZD
RUB
SEK
SGD
TRY
ZAR
BTC (crypto)
ETH (crypto)
USDT (crypto)
BUSD (crypto)
USDC (crypto)
Forex Risk Buddy: Position Size, SL & TP System [UTS]Forex Risk Buddy
Position Size, Stop Loss & Take Profit System
The ultimate system to calculate trading risk on forex markets.
💵 Forex
Position Sizing
De-risk possible drawdown by calculating a proper position size.
Define your risk percent based on your net value
Freely define your account currency
Trade any asset by the customizable Base / Quote currency factor
Calculate trading fees
Show all information on a customizable data screen
Stop Loss
Minimize trade risk by calculating your stop-loss.
Percent, Value and Delta display from current price
ATR based (Average True Range, modifiable)
Custom SL value possible
Adjustable
Two visual representations on chart
Automatically and real-time calculated on screen
Take Profit
Multiple take-profit levels to ensure not giving back to the market.
Up to 3 take profit levels to define
ATR based (Average True Range, modifiable)
Custom TP values possible
Easily customizable
Two visual representations on chart
Automatically and real-time calculated on screen
Currencies
Choose an account currency and calculate your risk for every trading pair.
USD
EUR
GBP
AUD
CAD
CHF
HKD
JPY
NOK
NZD
RUB
SEK
SGD
TRY
ZAR
BTC (crypto)
ETH (crypto)
USDT (crypto)
BUSD (crypto)
USDC (crypto)
Crypto Risk Buddy - Lite: Position Size, SL & TP System [UTS]
Crypto Risk Buddy - Lite
Position Size, Stop Loss & Take Profit System
The ultimate system to calculate trading risk on crypto assets.
The 'Lite' version is limited to BTC as base currency.
₿ Cyptocurrencies
Position Sizing
De-risk possible drawdown by calculating a proper position size.
Define your risk percent based on your net value
Freely define your account currency
Trade any asset by the customizable Base / Quote currency factor
Calculate trading fees
Show all information on a customizable data screen
Stop Loss
Minimize trade risk by calculating your stop-loss.
Percent, Value and Delta display from current price
ATR based (Average True Range, modifiable)
Custom SL value possible
Adjustable
Two visual representations on chart
Automatically and real-time calculated on screen
Take Profit
Multiple take-profit levels to ensure not giving back to the market.
Up to 3 take profit levels to define
ATR based (Average True Range, modifiable)
Custom TP values possible
Easily customizable
Two visual representations on chart
Automatically and real-time calculated on screen
Currencies
Choose an account currency and calculate your risk for every trading pair.
USD
EUR
GBP
AUD
CAD
CHF
HKD
JPY
NOK
NZD
RUB
SEK
SGD
TRY
ZAR
BTC (crypto)
ETH (crypto)
USDT (crypto)
BUSD (crypto)
USDC (crypto)
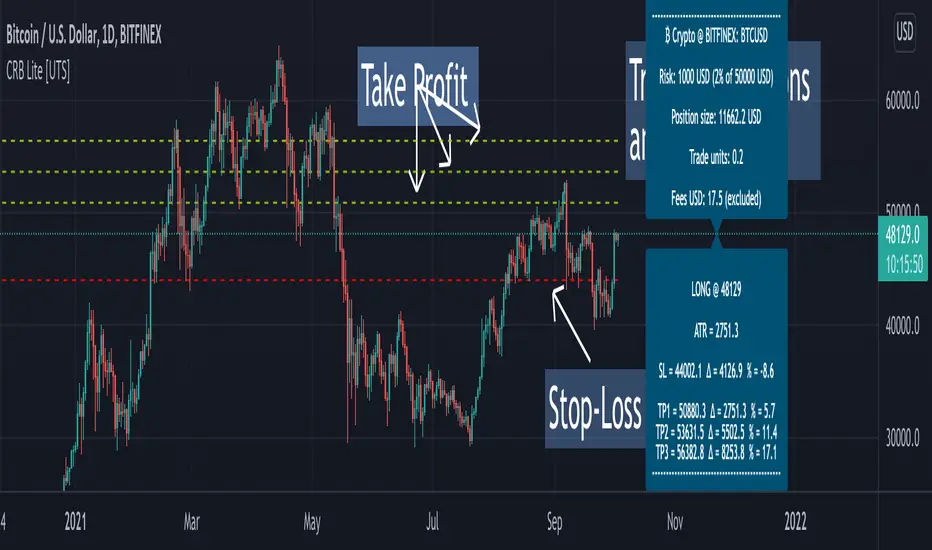
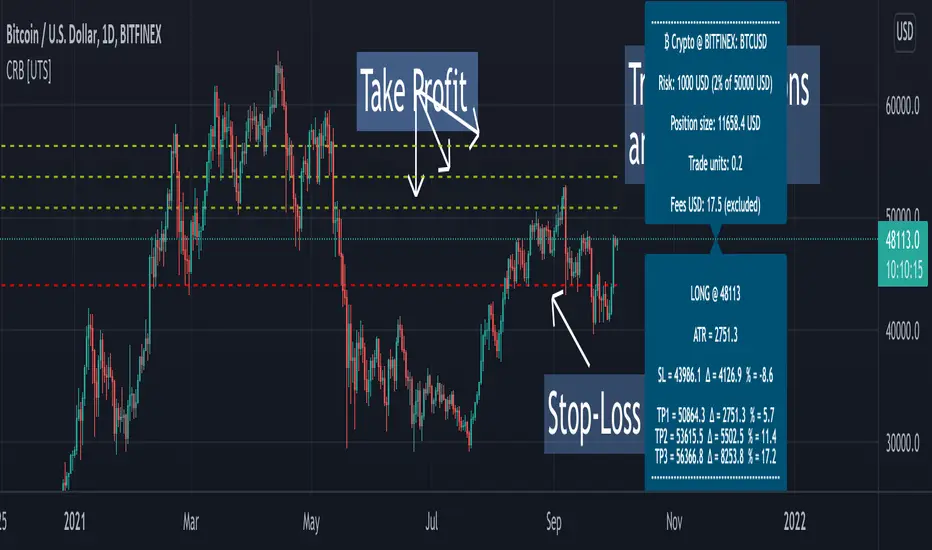
Crypto Risk Buddy: Position Size, SL & TP System [UTS]
Crypto Risk Buddy
Position Size, Stop Loss & Take Profit System
The ultimate system to calculate trading risk on crypto assets.
₿ Cyptocurrencies
Position Sizing
De-risk possible drawdown by calculating a proper position size.
Define your risk percent based on your net value
Freely define your account currency
Trade any asset by the customizable Base / Quote currency factor
Calculate trading fees
Show all information on a customizable data screen
Stop Loss
Minimize trade risk by calculatig your stop-loss.
Percent, Value and Delta display from current price
ATR based (Average True Range, modifiable)
Custom SL value possible
Adjustable
Two visual representations on chart
Automatically and real-time calculated on screen
Take Profit
Multiple take-profit levels to ensure not giving back to the market.
Up to 3 take profit levels to define
ATR based (Average True Range, modifiable)
Custom TP values possible
Easily customizable
Two visual representations on chart
Automatically and real-time calculated on screen
Currencies
Choose an account currency and calculate your risk for every trading pair.
USD
EUR
GBP
AUD
CAD
CHF
HKD
JPY
NOK
NZD
RUB
SEK
SGD
TRY
ZAR
BTC (crypto)
ETH (crypto)
USDT (crypto)
BUSD (crypto)
USDC (crypto)
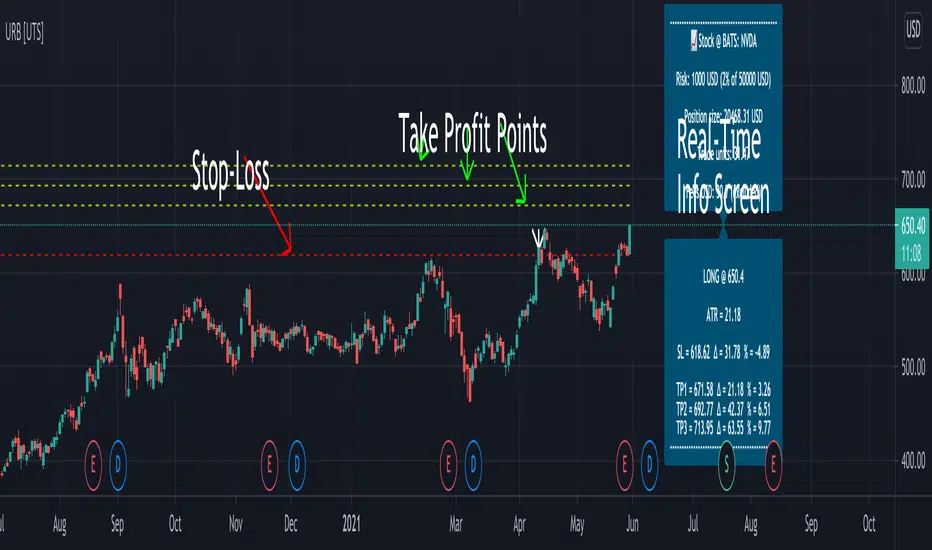
Uber Risk Buddy: Position Size, SL & TP System [UTS]
Uber Risk Buddy
Position Size, Stop Loss & Take Profit System
The ultimate system to calculate trading risk on any asset e.g.:
💰 Futures
₿ Cyptocurrencies
💵 Forex
📈 Stocks
📉 Fund
🗂️ Indices
Position Sizing
De-risk possible drawdown by calculating a proper position size:
Define your risk percent based on your net value
Freely define your account currency (Base currency)
Trade any asset by the customisable Base/ Quote currency factor
Optional trading fee calculation
Show all information on a customisable data screen
Stop Loss
Minimise trade risk by calculating your stop-loss:
Percent, Value and Delta display from current price
ATR based (Average True Range, modifiable)
Adjustable
Two visual representations on chart
Automatically and real-time calculated on screen
Take Profit
Multiple take-profit levels to ensure not giving back to the market.
Up to 3 take profit levels to define
ATR based (Average True Range, modifiable)
Easily customisable
Two visual representations on chart
Automatically and real-time calculated on screen
Indicator Access: 1 week trial available (DM for access)
Volume Treshold [UTS]Volume Treshold
Helps to identify periods of high and low volume.
This information can be used to evaluate market trends and to determine trade entries and exits.
Note: this only works on charts with volume information available
Treshold line changes color if a candle is more than x percent of the average volume of the last n candles
Treshold line changes color back to gray again if volume falls below the treshold
A lookback period defines how many bars should be taken into consideration
% that causes it to be triggered settable in decimals up to 3.5 where 1.0 equals to 100%
Colour to change the volume bar to can be set via menu
Ability to show the treshold as visualized drawing over the histogram as line or area
Ability to choose smoothing method for treshold calculation (SMA | EMA)
An optional Simple Moving Average of the volume data can be added to the chart.

Volume Treshold [UTS]Volume Treshold
If volume of a candle is more than x percent of the average volume of the last n candles, it changes colour.
Can be shown on the candles themselves and could be set to independent figures vs the volume bars
Both elements of this, the volume bars and candles could be edited independently with the following values;
- Lookback period how many bars should be taken into consideration
- % that causes it to be triggered settable in decimals up to 3.5 where 1.0 equals to 100%
- Colour to change the volume bar to can be set via menu
- Colour to change the candle to can be set via menu
- Ability to show the treshold as visualized drawing over the histogram
- Ability to choose smoothing method SMA | EMA
- Optional: to add a moving average to the volume bars
Note: only works on charts with volume information
Strategy - Uber STC - Schaff Trend Cycle [UTS]Backtesting of Uber STC - Schaff Trend Cycle
Backtest with focus win/loss profitability.
Formula: profitability = win / (win+loss)
Default equity 100k USD
Default 2% Risk per trade
Default currency USD
Define backtest interval precisely by month, year, day
LONG and SHORT positions
Visualize SL and TP on chart
ATR (len: 14, smooth: SMA)
ATR based Stop-Loss, if hit trade will be closed and considered as loss
ATR based Take-Profit, if hit trade will be closed and considered as win
On TP or SL hit the trade is closed and marked as win/loss
Uber STC - Schaff Trend Cycle [UTS]Desc:
The Schaff Trend Cycle (STC) is a charting indicator that is commonly used to identify market trends and provide
buy and sell signals to traders.
Developed in 1999 by noted currency trader Doug Schaff, STC is a type of oscillator and is based on the assumption that,
regardless of time frame, currency trends accelerate and decelerate in cyclical patterns.
This indicators source code is based on Releasing the Code to the Schaff Trend Cycle.pdf
Executive Summary
Schaff Trend Cycle is a charting indicator used to help spot buy and sell points in the markets.
Compared to the popular MACD indicator, STC will react faster to changing market conditions.
A drawback to STC is that it can stay in overbought or oversold territory for long stretches of time.
General Usage
There are two lines indicating overbought and oversold conditions, default at 75 and 25 which is customizable of course.
Signals are created on line crosses. They that can be used to enter LONG/SHORT or EXIT a trade.
If the STC crosses the lower line upwards a LONG signal is triggered and if it crosses the upper line a SHORT signal is triggered.
Line crosses in the other direction than the current trade also work as EXIT signal.
Alerts
Traders can easily use the reversal signal to trigger alerts from:
Cross Up
Cross Down
Those values are > zero if a condition is triggered.
Alert condition example: "Cross Up" - "Greater Than" - "0"
Moving Averages
16 different Moving Averages are available:
ALMA (Arnaud Legoux Moving Average)
DEMA (Double Exponential Moving Average)
EMA (Exponential Moving Average)
FRAMA (Fractal Adaptive Moving Average)
HMA (Hull Moving Average)
JURIK (Jurik Moving Average)
KAMA (Kaufman Adaptive Moving Average)
Kijun (Kijun-sen / Tenkan-sen of Ichimoku)
LSMA (Least Square Moving Average)
RMA (Running Moving Average)
SMA (Simple Moving Average)
SuperSmoothed (Super Smoothed Moving Average)
TEMA (Triple Exponential Moving Average)
VWMA (Volume Weighted Moving Average)
WMA (Weighted Moving Average)
ZLEMA (Zero Lag Moving Average)
A freely determinable length allows for sensitivity adjustments that fits your own requirements.
Uber WAE - Waddah Attar Explosion [UTS]The Waddah Attar explosion indicator is a well known indicator in the forex community all over the web. It builds on MACD together with Bollinger Bands and measures the current direction and strength in market.
This indicator can act as a scalper on lower timeframes e.g. 30M - 4H but also does a pretty decent job as volatility filter to determine strong trending movements on higher timeframes like 1D.
Example code can be found at www.prorealcode.com .
General Usage
The colored histogram visualizes the strength of the trend (green = bullish, red = bearish).
A buy/sell signal is triggered when the (green/red) histogram bars rise above the explosion line.
An exit signal is triggered if the bar falls below the explosion line.
Alerts
Traders can easily use the reversal signal to trigger alerts from:
Enter Long
Enter Short
Exit Long
Exit Short
Maintain Long
Maintain Short
Those values are > zero if a condition is triggered.
Alert condition example: "Enter Long" - "Greater Than" - "0"
Moving Averages
16 different Moving Averages are available for calculation of both MACD and BB components:
ALMA (Arnaud Legoux Moving Average)
DEMA (Double Exponential Moving Average)
EMA (Exponential Moving Average)
FRAMA (Fractal Adaptive Moving Average)
HMA (Hull Moving Average)
JURIK (Jurik Moving Average)
KAMA (Kaufman Adaptive Moving Average)
Kijun (Kijun-sen / Tenkan-sen of Ichimoku)
LSMA (Least Square Moving Average)
RMA (Running Moving Average)
SMA (Simple Moving Average)
SuperSmoothed (Super Smoothed Moving Average)
TEMA (Triple Exponential Moving Average)
VWMA (Volume Weighted Moving Average)
WMA (Weighted Moving Average)
ZLEMA (Zero Lag Moving Average)
A freely determinable length allows for sensitivity adjustments that fits your own requirements.

Strategy - Backtest Uber Kuskus Starlight [UTS]Backtest of Uber Kuskus Starlight
Backtest with focus win/loss profitability.
Formula: profitability = win / (win+loss)
Default equity 100k USD
Default 2% Risk per trade
Default currency USD
Define backtest interval precisely by month, year, day
LONG and SHORT positions
Visualize SL and TP on chart
ATR (len: 14, smooth: SMA)
ATR based Stop-Loss, if hit trade will be closed and considered as loss
ATR based Take-Profit, if hit trade will be closed and considered as win
On TP or SL hit the trade is closed and marked as win/loss
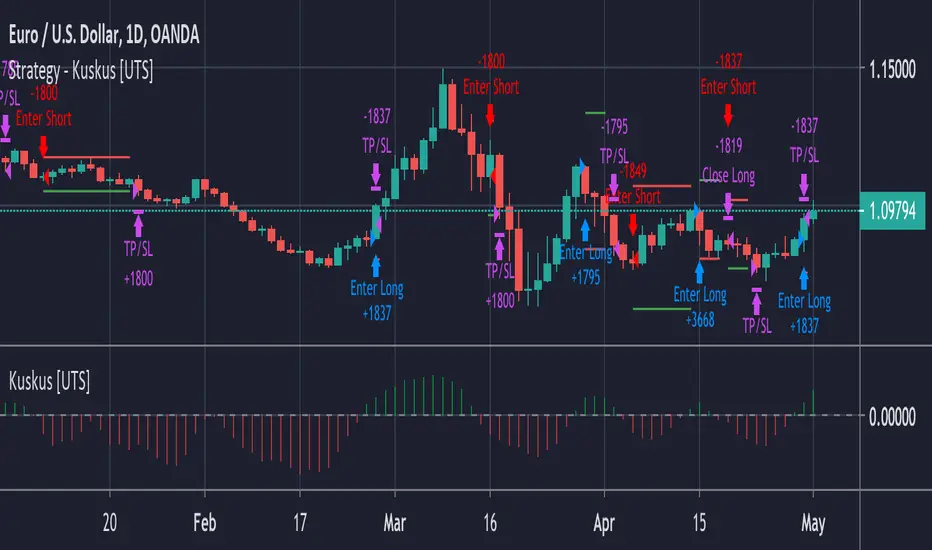
Uber Kuskus Starlight [UTS]General Usage
The Kuskus Starlight is a Zero-Line Indicator that produces signals based on zero line cross.
It is designed to offer traders the much needed information on trend direction. Just like the name suggests, the indicator produces starlight shaped bodies to form a slope that runs above or below the zero reference level.
Interestingly, the starlight shaped bodies are seen to alter their color between blue (when the starlight shaped bodies are above the zero reference level) and red (when the starlight shaped bodies are below the zero signal level).
Buy Signal
Buy Signal
Go long when the blue starlights get above the zero signal level.
Sell Signal
Go short when the red starlights go below the zero signal level.
Exit buy trade
Close all buy orders if while a bullish trend is ongoing, the Kuskus Starlight Indicator pops up a red starlight slightly below the zero level.
Exit sell trade
Close all sell orders if while a bearish trend is running, the Kuskus Starlight Indicator displays a blue starlight somewhat above the zero level.
Styles
Four different styles are available:
Original Starlight
Area Chart
Histograms
Line Chart
Line Chart
Signals
The (alert-) signal generating line crosses can optionally be shown.
Alerts
Traders can easily use the trend change signals to trigger alerts from:
Up Signal
Down Signal
Those values are > zero if a condition is triggered.
Alert condition example: "Up Signal" - "GreaterThan" - "0"

Uber M-Oscillator (M. Fawzy, 2018) [UTS]General Usage
The M-Oscillator analyses the price change rather than the price level. It draws the difference between prices at two time intervals.
It is a leading indicator of price direction. It can identify when the current trend is no longer maintaining its same level of strength or is losing
momentum. The importance of the momentum is when its value reaches to extreme levels either up or down.
Interpretation
M-Oscillator reading for default period of 14.
M-Oscillator is plotted along the bottom of the price chart; it
fluctuates between positive and negative 14.
Movement above 10 is considered overbought, and movement
below -10 is oversold.
In sharp moves to the upside, the M-Oscillator fluctuates
between 5 and 14, while in down side it fluctuates between -5
and -14.
In an uptrend, the M-Oscillator fluctuates between zero and
14 and vice versa.
The advantage
The momentum line leads the price action (it leads the
advance or decline in prices).
The crossing of the zero line is considered as a trading signal.
The disadvantage
The need for an upper and lower boundary.
If recent price gains are the same as older price gains, the
momentum line will be fl at even though the market is still
going up.
If recent price gains are less than those of before, even if
prices are still rising, the rate of change will have slowed
further, and the momentum line will actually drop.
Using price differences in the erratic movements often caused
by sharp changes in the value.
The "Uber" M-Oscillator
The Uber version of M-Oscillator provides the following improvements:
Period is not fixed to 14 anymore, can be determined freely
Overbought and oversold conditions are automatically adjusted to the chosen period
Ability to draw oscillator crosses on the signal line
For both oscillator and signal line smoothing 16 moving averages are available
Available Moving Averages
16 different moving averages are available for oscillator and signal line:
ALMA (Arnaud Legoux Moving Average)
DEMA (Double Exponential Moving Average)
EMA (Exponential Moving Average)
FRAMA (Fractal Adaptive Moving Average)
HMA (Hull Moving Average)
JURIK (Jurik Moving Average)
KAMA (Kaufman Adaptive Moving Average)
Kijun (Kijun-sen / Tenkan-sen of Ichimoku)
LSMA (Least Square Moving Average)
RMA (Running Moving Average)
SMA (Simple Moving Average)
SuperSmoothed (Super Smoothed Moving Average)
TEMA (Triple Exponential Moving Average)
VWMA (Volume Weighted Moving Average)
WMA (Weighted Moving Average)
ZLEMA (Zero Lag Moving Average)
Alerts
Traders can easily use the trend change signals to trigger alerts from:
Cross Up
Cross Down
Those values are > zero if a condition is triggered.
Alert condition example: "Cross Up" - "GreaterThan" - "0"
Trading tactics
Overbought/Oversold:
We define the overbought area as anywhere above the 10
level. The oversold area is below -10. When the M-Oscillator goes
above 10 (overbought) and then re-crosses it to the downside,
a sell signal is triggered. When the M-Oscillator surpasses -10
to the downside and then re-crosses back above this level, a
buy signal is triggered. This tactic is only successful during
sideways markets; during an uptrend, the oscillator will remain
in its overbought territory for long period of times. During a
downtrend, it will remain in oversold for a long time.
Overbought/Oversold rule:
Buy when the M-Oscillator violates the (-10) level to the
downside and crosses back to the upside
Sell when the M-Oscillator crosses above the (+10) level and
crosses back to the downside
Divergence:
Divergence is one of the most striking features of the
M-Oscillator. It is a very important aspect of technical analysis
that enhances trading tactics enormously; it shows hidden
weakness or strength in the market, which is not apparent in
the price action. A positive divergence occurs when the price is
declining and makes a lower low, while M-Oscillator witnesses
a higher low. A negative divergence occurs when the price is
rising and makes a higher High, while the M-Oscillator makes
a lower high, which indicates hidden weakness in the market.
Divergences are very important as they give us early hints of
trend reversal.
Divergence rule:
Buy when the M-Oscillator witnesses a positive divergence
with prices followed by a rise above (-10)
Sell when the M-Oscillator witnesses a negative divergence
with prices followed by a decline below (+10)
Support and Resistance
During an uptrend, the M-Oscillator moves between (0) and
(+10). During a downtrend, most of the time the M-Oscillator
will move between (0) and (-10). Sometimes the (0) level acts
as support (in the case of uptrends) and resistance (during
downtrends). We can buy during an uptrend when the
M-Oscillator reaches its midrange (0) and begins to move to the
upside from there. During downtrends, an upward move to (0)
might be a selling opportunity.
It is also used as exit signal (when the M-Oscillator acts as a
resistance) as well as indication of a re-entry level (when the
M-Oscillator acts as a support)
Exit signal:
When the M-Oscillator crosses above the (-10), giving
a buy signal, but it doesn’t retrace further than the zero
line, the M-Oscillator drops towards the lower boundary.
This is considered as weakness and an exit signal when the
M-Oscillator drops from the zero line toward the (-10). (To avoid
whipsaws, filters can be used.)
Re-entry:
When the M-Oscillator breaks the (+10), giving a sell signal,
but it doesn’t retrace further than the zero line, the M-Oscillator
rebounds toward the upper boundary. This is considered as
strength and a re-entry point when the M-Oscillator rebounds
from zero line to upside. (To avoid whipsaws, filters can be used.)
Using M-Oscillator as a Trend Identifier on LongTerm Scale
During downtrends, the M-Oscillator does not reach
overbought zone. A move toward the overbought area is a sign of
strength when it occurs for the first time in a while. On the other
hand, during uptrend, the M-Oscillator does not reach oversold
areas easily. Going into oversold and staying there after a long
time is a signal that the uptrend is reversing. (As Constance
Brown explained in her book Technical Analysis for the Trading
Professional, chapter 1, “oscillators do not travel between 0 and
100”.)
Crossover on Extreme Levels
Sell signals are triggered when the M-Oscillator crosses
its signal line above (13), which indicates an extreme market
condition, and buy signals are triggered when the M-Oscillator
crosses its signal line below (- 13).

Strategy - Backtest Uber SSL Channel / SSL Indicator [UTS]Backtesting of Uber SSL Channel / SSL Indicator
Backtest with focus win/loss profitability. Formula: profitability = win / (win+loss)
Do not put too much weight on trade PNL as the value is not necessary correct.
For example: on SL or TP hit an open position is marked as to be closed but executed on the open a new candle, thus leads to incorrect PNL.
Default equity 50k
Default 2% Risk per trade
Default currency USD
Define backtest interval precisely by month, year, day
ATR (len: 14, smooth: SMA)
ATR based Stop-Loss, if hit trade will be closed and considered as loss
ATR based Take-Profit, if hit trade will be closed and considered as win
If TP or SL is hit trade is closed and of course considered as win/loss
---
DM me / Tip (see Signature) or Subscribe for access
