Maximized Scalping On Trend (by Coinrule)" The trend is your friend. " This is one of the most famous and valuable teachings that experienced traders can give to newbies. There is a reason for that.
No matter your views about where the price moves, what matters is where the price heads to . The market is always right, and ultimately it decides who gets the profit and who has to take a loss.
The purpose of this strategy is to spot when it's the most suitable time to buy an asset profiting from a potential short-term price increase. The strategy tends to open trades frequently, closing them on average in one and a half days.
ENTRY
The buy order is placed on assets that present strong momentum when it's more likely that it is about to increase further in the short term.
To capture momentum on the asset, the rule strategy requires:
the MA50 greater than the MA100
the RSI greater than 50
The rule, then, places the order when
The price crosses above the MA9.
EXIT
This strategy comes with a stop loss and a take profit which adapt dynamically to market conditions.
The trade is closed in profit when the RSI is greater than 70 , as the trend could experience a pull-back.
Alternatively, the trade is closed when the RSI is lower than 30 , being this a sign of weakening of the trend.
Pro tip : The 1-hour time frame has proven to return the best results on average. The strategy can also work well in the 15-min time frame if you want to increase the trades' frequency.
The strategy assumes each order to trade 30% of the available capital and opens a trade at a time. A trading fee of 0.1% is taken into account.
Trendfollowing

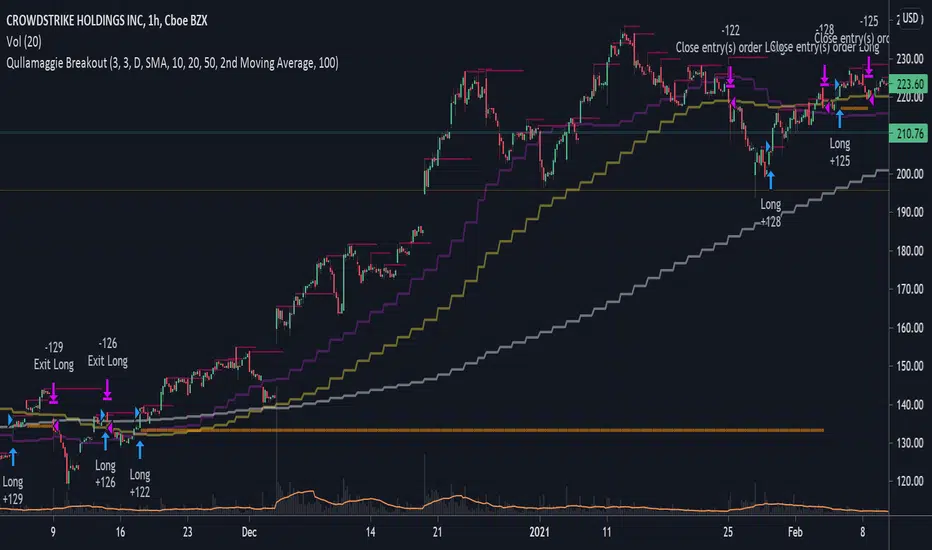
Qullamaggie BreakoutThe intent of this strategy is to buy breakouts with a tight stop on smaller timeframes in the direction of the longer term trend. Default longer term trend is the daily, but the user can choose any timeframe to use for the SMAs (which act as filters and trailing stops).
Exit the trade using a trailing stop of a close below either the 10 MA or 20 MA (user choice) on that larger timeframe as the position moves in your favor (i.e. whenever position price rises above the MA). This is one area where this script could use a little work or some human intervention - when the trade is entered right in the vicinity of the moving averages, you get some whipsaw. Not sure how to avoid that at this point though if you want to look at those longer term moving averages as your exit criteria.
Option of using daily ATR as a measure of finding contracting ranges and ensuring a decent risk/reward. (If the difference between the breakout point and your stop level is below a certain % of ATR, it could possibly find those consolidating periods.)
Trend Surfers - Premium Breakout + AlertsTrend Surfers - Premium Breakout Strategy with Alerts
I am happy today to release the first free Trend Surfers complete Breakout Strategy!
The strategy includes:
Entry for Long and Short
Stoploss
Position Size
Exit Signal
Risk Management Feature
How the strategy works
This is a Trend Following strategy. The strategy will have drawdowns, but they will be way smaller than what you would go through with buy and old.
As a Trend Following strategy, we will buy on strength, when a breakout occurs. And sell on weakness.
The strategy includes a FIX Stoploss determined by an ATR multiple and a trailing Stoploss/Takeprofit also determined by an ATR multiple.
You can also manage your risk by entering the maximum % you are willing to risk on every trade. Additionally, there is an option to enter how many pairs you will be trading with the strategy. This will change your position size in order to make sure that you have enough funds to trade all your favorite pairs.
Use the strategy with alerts
This strategy is alert-ready. All you have to do is:
Go on a pair you would like to trade
Create an alert
Select the strategy as a Trigger
Wait for new orders to be sent to you
Every Entry (Long/Short) will include:
Market Entry (Enter position NOW!)
Stoploss price
Position Size
Leverage
* If you do not wish to use leverage, you can multiply the Position Size by the Leverage. But doing that, you might end up with a position greater than your equity. Trading on Futures is better in order to have accurate risk management.
Exit signals:
When you receive an exit signal, you need to close the position ASAP. If you want to keep your results as close as possible to the backtest results, you need to execute quickly and follow what the strategy is telling you.
Do not try to outsmart the strategy
Leave your emotion out of trading! If you trust the strategy, you will have way better returns than if you try to outsmart it. Follow each signal you receive even if it doesn't seem logical at the moment.
Become a machine that executes. Don't look at fundamentals. Follow the trend! Trust the strategy!
I hope you enjoy it!

Bollinger Band with RSI
Using combination bollinger band and RSI indicator as guide to predict price volatility and the best entry point. The strategy logic is pretty straightforward where we're interested with close price that touches the lower bollinger band ; there are only two scenarios that will happened after the price reaches the lower band; the price might rebound from the lower bollinger band or drop lower and continue downtrend. To confirm the price movement, we use a second indicator which is the RSI to further investigate the price trend. For example, if the price reaches the lower bollinger band but the RSI value is not in the oversold region, we can conclude that the price will go lower and continue downtrend. If the RSI value is in the oversold region, we can use this price area as our entry point.
Stop loss is necessary to avoid losing too much capital if the RSI value lingers too long in the oversold region.
Best take profit area is when the price rebound above the middle bollinger band area/upper bollinger band or when the RSI reaches overbought region; whichever comes first.
Long entry:
RSI < 30 & close price < lower bollinger band
Exit entry:
RSI > 70
Default stop loss: -25%

Multi Moving Average Crossing (by Coinrule)Moving Averages are among the most common trading indicators. They are straightforward to interpret and effective to use.
One of the limitations of using moving averages is they can provide buy and sell signals with a relatively high lag , making it very difficult to spot the lows and tops of the trend.
Moving averages calculated with a low number of periods like the MA9 (the average of the previous nine price periods) react very fast to price moves providing prompt signals. On the other side, more signals may end up with more false-signals and more trades in a loss.
On the contrary, moving averages calculated with a higher number of periods like the MA100 (which considers the previous one hundred price periods) give more reliable signals, but with a delay.
A system catching the crossing of the MA50 over the MA100 is a good compromise for successful long-term strategies. It provides, on average, reliable buy signals.
The Multi Moving Average Crossing Strategy tries to optimize the exit without waiting for the same opposite crossing (MA50 below MA100). It uses the MA9 crossing below the MA50, instead, to spot a better time for selling.
The setup is as follows.
BUY when the Moving Average 50 crosses above the Moving Average 100
SELL when the Moving Average 9 crosses below the Moving Average 50
The higher is the time frame to calculate the Moving Averages, the better is the overall performance of the strategy. The 4-hour (or 6-hour) time frame seems to be the best, even if it results in fewer trades. If you want to trade more still with good results, the 1-hour time is a good compromise.
Advantages of the strategy
This strategy seeks to catch those that are more likely relevant uptrends and close the trade relatively quickly. More trades mean more opportunities. This is especially effective if you run the strategy on all the available coins on the market, as you could do with Coinrule.
Generally, a Multi Moving Averages approach beats the classic crossing strategy involving only two Moving Averages. We backtested a sample of twenty trading pairs to assess the benefits empirically.
The results show that the Multi Moving Average Strategy
outperforms 13 out of 20 times
has 95% higher average return
has 67% higher median return
The strategy assumes each order to trade 30% of the available capital and opens a trade at a time. A trading fee of 0.1% is taken into account.

Donchian Channels Strategy by KrisWatersDoncian Channels is a trend tracking indicator developed by Richard Doncian. The upper line of the channel is determined by the highest value seen by the price in the defined period, the lower line of the channel is determined by the lowest value seen by the price in the defined period. The middle line takes the average value of the lower and upper channels.
Strategy Settings:
- Can apply only LONG positions.
- Can apply only SHORT positions.
- Use LONG/SHORT both.
- You can use ATR as a second exit condition. If ATR stop disabled, Donchian upper or lower channel value is use for the exit rule to long and short positions.
Strategy can be able to optimize by changing channel lengths and timeframe.

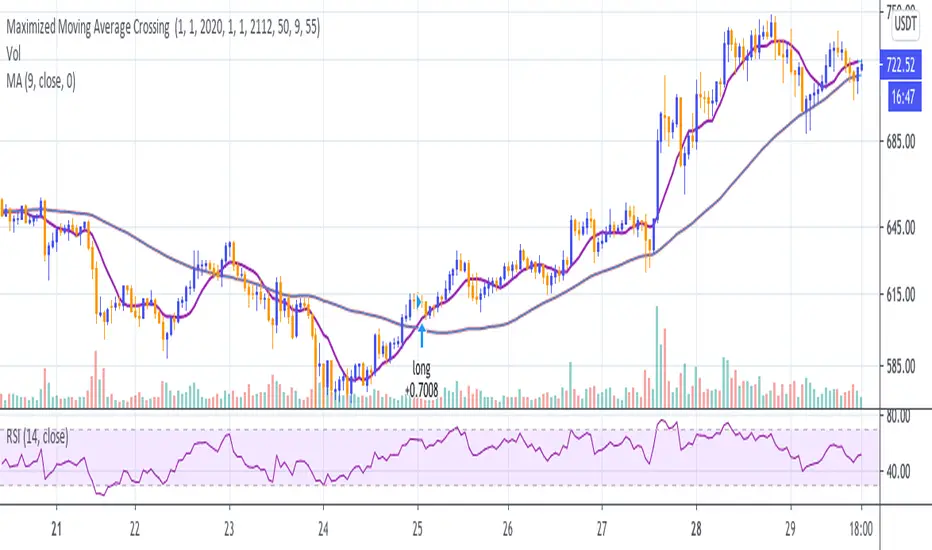
Maximized Moving Average Crossing (by Coinrule)Using the crossings of two Moving Averages to trade in a trading strategy is a Trend-Following approach. As the name would suggest, to be successful, it requires the asset to be on-trend.
The general limit of a common strategy based on Moving Averages is that they underperform when the market is less volatile or trading sideways. When volatility compresses, the indicators get very close one to another, crossing each other very often. That's exactly the condition when trend-following strategies underperform.
To improve this strategy, it's useful to filter the buy signal using the RSI. When the RSI is close to overbought conditions, that means that the coin is likely trading in an uptrend. Strong uptrends usually come with RSI values that stay overbought for long periods, creating interesting opportunities.
Setup
Buy condition: the MA9 crosses above the MA50, and at the same time, the RSI has a value greater than 55.
Sell condition: the MA9 crosses below the MA50.
The strategy is optimized to provide better results on the 1-hr time frame, but it could work well also on higher time frames, such as the 4-hrs.
The strategy assumes each order to trade 30% of the available capital and opens a trade at a time. A trading fee of 0.1% is taken into account.
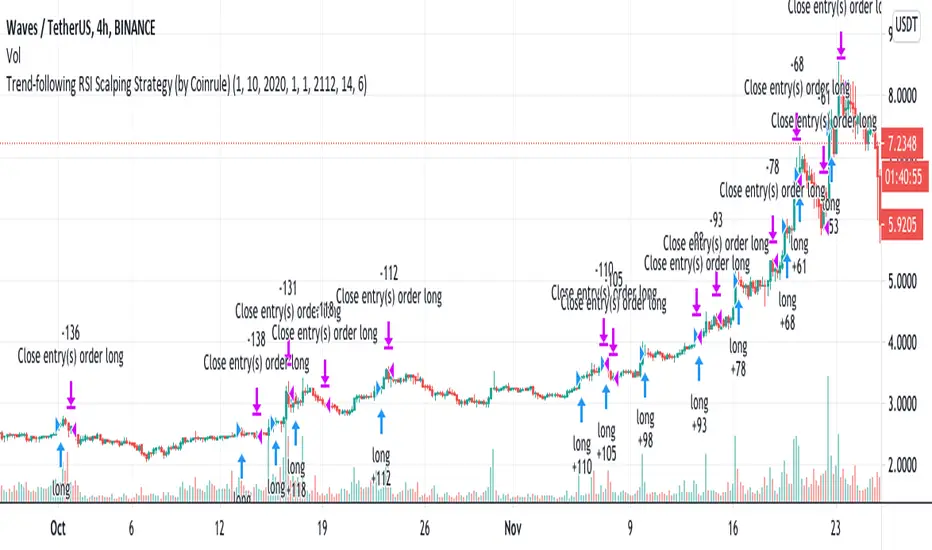
Trend-following RSI Strategy According to classical technical analysis, an RSI above 70 should signal overbought conditions and, thus, a sell-signal. Cryptocurrencies represent a whole new asset class, and they reshape the classical concepts of technical analysis. FOMO-buying can be very powerful, and coins can remain in overbought conditions enough to provide excellent opportunities for scalping trades on the upside.
Building a trend-following trading strategy based on the RSI, which is generally considered a contrarian indicator, may sound counter-intuitive. Over 200 backtests prove that this is a very interesting long-term setup.
The setup is optimized on a 4-hours time frame and trading cryptocurrencies versus USD or stable coins.
The strategy tries to catch coins on sustained uptrends to take advantage of further upside.
The strategy's buy-signal triggers when a coin has an RSI above 70 on a 4-hours time frame.
The strategy sells the coin if a profit of 6% is achieved. Alternatively, it closes the position if the RSI drops below 55, indicating a possible weakening of the trend.
The strategy assumes each order to trade 30% of the available capital. A trading fee of 0.1% is taken into account. The fee is aligned to the base fee applied on Binance, which is the largest cryptocurrency exchange.
BuyHighSellLow - Pivot pointsAnother version of buy-high sell-low strategy. This time using pivot points.
Strategy is simple:
Buy when price closes above R1 of pivot point level
Sell when price closes below S2 of pivot point level.
Use Resolution parameter to define pivot points. Higher the resolution, longer the trade time will be. If resolution is set to same as symbol, strategy will consider Higher Timeframe Multiplier to derive pivot point resolution.
Uncheck HideBands to see bands created from pivot points.
Another Buy-High Sell-Low strategy published is using donchian channel (Link below)

BB21_MA200_StrategyThis strategy follows the trend and keeps you in the trend until it breaks SMA 200
SMA setting is 200
BB setting is 21
BUY
====
when BB is (lower band and upper band) above SMA 200 and price crossing above BB middle line
Partial Exit
==========
When Lower BB crossing down SMA200 , exit 30%
Total Exit
=========
When BB middle band crosses down SMA200 , exit ALL
Stop Loss
======
default is set to 5%
Risk Management
================
This is new parameter I have introduced in my strategies. Default value is 10% . That means , if your capital is 10000 , you are willing to risk 10% of it ... i.e 1000.
It doesnot mean that you are buying shares/units for 1000 only. It is different ...see below
Your trade size is calculated based on Risk% .... capital x risk 5 / stop Loss units
for further explanation you can check Alexander Elder's risk management rule. He mentioned 2% rule for 100K account. But most of us dont have 100K accounts .. . so I have defaulted 10% on 10K account. You can change this values and see the results. It wont change the number of trades or profit factor. It will increase the net profit.
Warning
=======
For educational purposes only

Aroon Oscillator StrategyThis is simple strategy based on Aroon Oscillator. I have found that using length 144 or 169 on hourly chart shows excellent results.
Tested on SPY , QQQ and AAPL. Especially when you look at AAPL results , it has 60% profitable in recent trades. ( Dont assume this will be same for other stocks or ETFs)
Aroon Oscillator setting : 169 ( 169 is square root of 13 ... you can also use fib level 144 , which is square root of 12 )
BUY
When Aroon Oscillator crosses above zero line
Add
if Long position is already opened, and current close is less than BUY price and RSI 13 crossing above 30 line
Exit
when Aroon Oscialltor crosses below zero line
Stop Loss
default stop loss has been set to 5%
Note: I have not plotted RSI to the chart. Please include RSI 13 to see how position gets added ... Also add ema 169 to see how the price is aligned with the Aroon Oscillator
Warning
For the educational purposes only

Donchian Channels Strategy - Long Term TrendFor Educational Purposes. Results can differ on different markets and can fail at any time. Profit is not guaranteed.
This only works in a few markets and in certain situations. Changing the settings can give better or worse results for other markets. This is a longer term trend following strategy that uses Donchian Channels for trend following and uses the upper and lower bands to find price breakouts to enter the market and then uses the middle band as a trailing stop to exit. DCs are known as the original trend following strategy made by Richard Donchian.
Usually the middle band uses the same length of the upper and lower bands in its calculation but I included the default option of using a middle band that is double the length of the other bands, but also an option to use the regular input length that most Donchian strategies use if needed. If long term trends are somehow found, this longer middle band lets the profits run longer and lets you see where the long trends were at if the market had any. The double lengthed middle band looks surprisingly very similar to a 3x ATR trailing stop, which is the recommended setting Wilder suggested for trend following. If a good ATR stop or other trailing stop can't be found, this longer middle band can act as a substitute for it.
For some reason I can't seem to find anything related to Donchian strategies on here despite the popularity and simplicity of it, not even a single working one to my liking, so I made my own. It seems this strategy only works in trending markets. I intentionally handpicked a market that the backtest does well on to illustrate the potential it might have for other markets where trending following strategies might work on and what to expect the results in those might be. Trend following strategies are said to have high profits but at the same time lower accuracy due to the failure rate of being able to catch the right trend. If you all got any suggestions or feedback please let me.

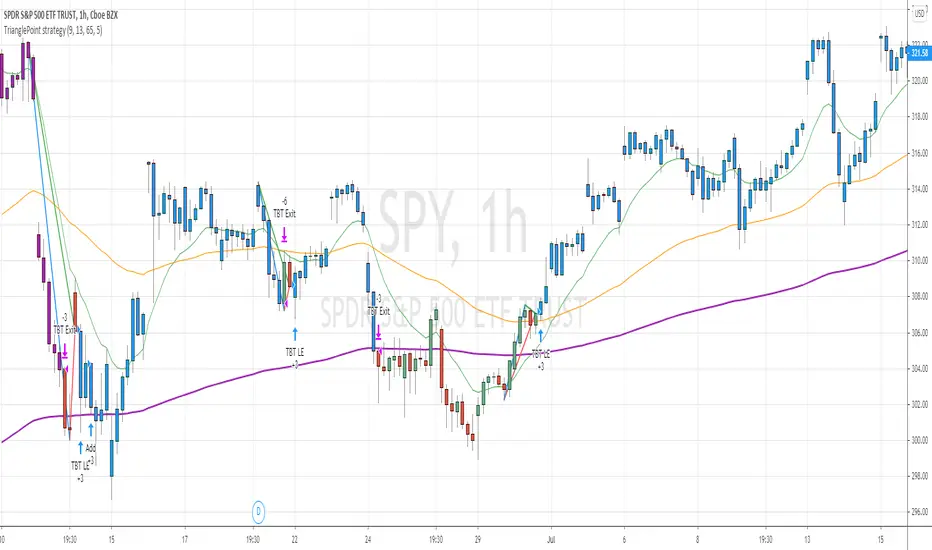
TrianglePoint strategyThis is trend following strategy ... when price is trading well above 200 ema and forms a triangle (based on number of bars defined)
BUY
====
when fast ema > 200 ema
check for triangle of last N bars (default set to 9)
EXIT
======
when fast ema crosses down middle term ema
if price reaches above 5% of buy , it changes the color to purple. You can close any time or wait for above signal.
STOP LOSS
=======
stop loss default value set to 5%
Note: No triangle shown on the chart. I will find out how to add the lines to the chart.
Warning
=========
For the use of educational purposes only
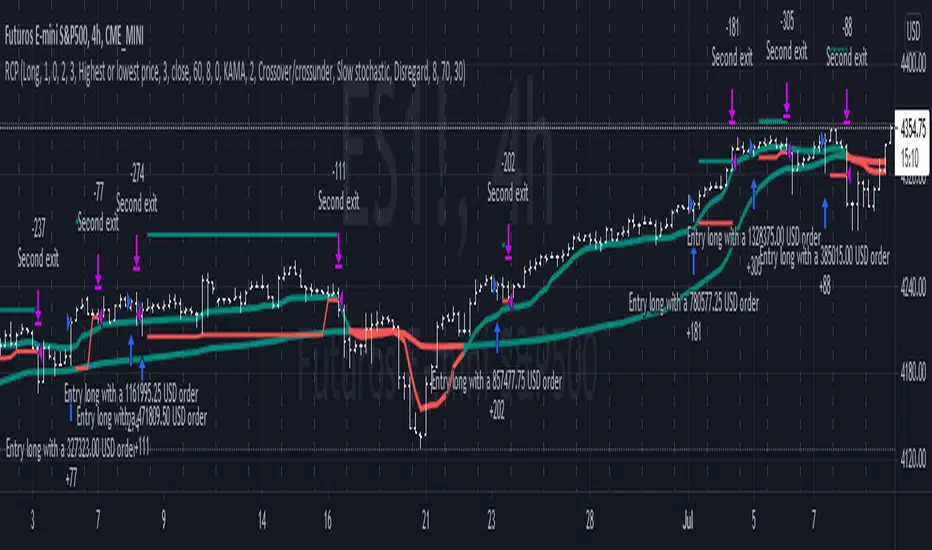
Reversal closing priceThe reversal closing price (RCP) is a candlestick pattern which follows two simples rules:
the low price of current candle needs to be lower than the low price of the last 2 candles
the closing price of current candle needes to be higher than the closing price of the last candle
This generates a signal for a long position. For a short position, the conditions are inverted:
the high price of current candle needs to be higher than the high price of the last 2 candles
the closing price of current candle needes to be lower than the closing price of the last candle
Since RCP is a trend follower indicator, the strategy is programmed in such a way that long positions are only placed if the short period EMA is above the long period EMA, and short positions are only placed if the short EMA is bellow the long EMA. Both periods are configurable, and should be ajusted for each asset.
This strategy uses a fixed stop loss and take profit, and the it's ratio is configurable. The stop price is one tick lower than the lowest price of X candles prior to the order execution for long positions, while in short positions it's one tick higher than the higher price. The amount of candles to lookback (X) is configurable. Both stop and take profit prices are displayed, the first as a red line, and the second as a green line.
This is the setting that I've found to work best with TVC:SPX , but you may find a better setting. While the RCP is universal, it's placement depends on the trend and it's strenght, something that is very heterogeneous among assets.
I really wish that I was able to place images, but I don't have PRO, so text will have to do.
This strategy was designed by Alexandre Wolwacz, a.k.a. Stormer.
MACD Trend Following Strategy How it work ?
Work like normal MACD because this is MACD without any modify but i add color of candlestick and strategy.
The color meaning :
Green= macd > signal and macd>0 (Buy)
Red= macd < signal and macd<0 (Sell)
Yellow= macd > signal and macd<0 (Maybe reversal point)
Blue= macd < signal and macd>0 (Maybe reversal point)
Feature
- Back test range
- Long/Short option
- Modifiable MACD Setting

Breakout Trend Follower StrategyThis strategy goes long when highs are broken and uses a trailing stop that follows swing lows. User can configure a back test date range and choose whether or not to only take trades above a selected moving average.
The desire for me to make this script was to try to capture those extreme breakouts that can occur after a consolidation/equilibrium pattern. This catches those using stop-buys as the entry. Out of all the scripts I have made thus far, this one is the one that has the best results. Time frames might vary due to commission structures, etc. I currently use this strategy on stocks on the 30-min time frame and crypto (with Coinbase's high fees) on the 2-hr time frame.

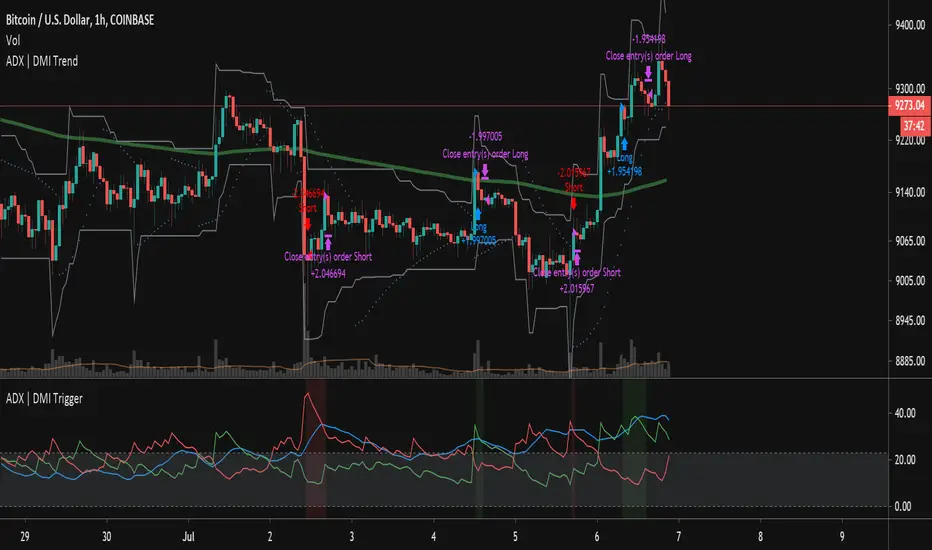
ADX | DMI Trend StrategyThis strategy takes the ADX Indicator I wrote and applies it to a strategy for back testing purposes.
I've also applied a date filter so you can back test specific date ranges and a moving average filter so you can choose whether to filter your longs/shorts based on a moving average.
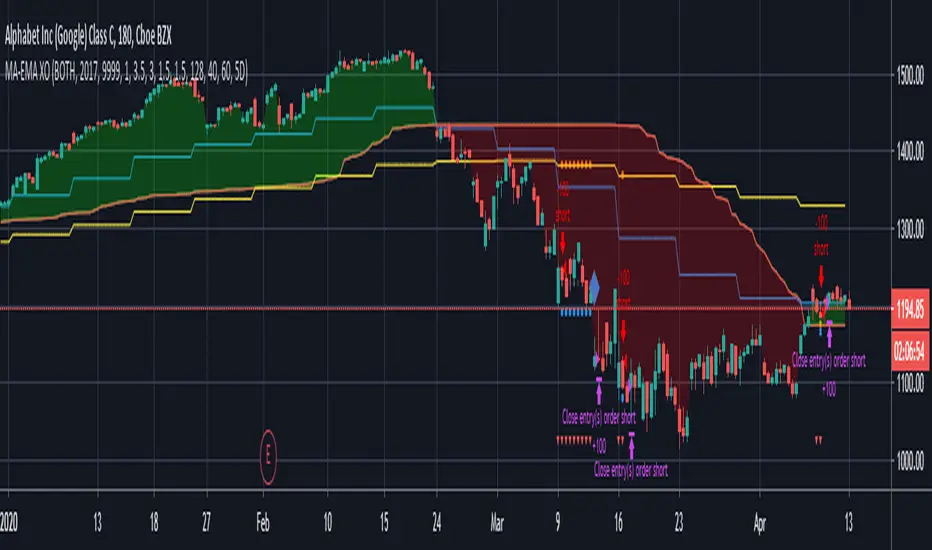
MA-EMA Crossover LTJust a simple strategy based on dynamic zones by Allenster. Still a work in progress.
Trend Following BreakoutEasy Trend Following Strategy using Highs and Lows breakout of the last X candles to enter and exit trades.
You can easily change the ENTRY and EXIT value in order to find the best settings.
This strategy seems to be working well for $BTC and $ETH on the 4H and 1D.
I didn't play with it too much as I am testing script to trade on the 15 minutes chart with margin. This script can't do this successfully but I hope it can be helpful for what you want to achieve.

Trend Following or Mean RevertingThe strategy checks nature of the instruments. It Buys if the close is greater than yesterday's high, reverse the position if the close is lower than yesterday's low and repeat the process.
1. If it is trend following then the equity curve will be in uptrend
2. If it is mean reverting then the equity curve will be downtrend
Thanks to Rayner Teo.

Donchian Breakout StrategyThis strategy buys when the Donchian Channel is broken to the upside and uses the lower Donchian Channel line as a trailing stop. You can also choose to use a moving average as a filter to keep you out of trades that are counter trend.
You can also configure which dates you want to backtest, so you can see how this behaves over specific time frames and market cycles.

Estamina Trend Strategy By KrisWatersTrend following strategy based on moving avarage crossovers. Strategy provides only long signals. Use only for BTCUSDT pair on 4H timeframe.

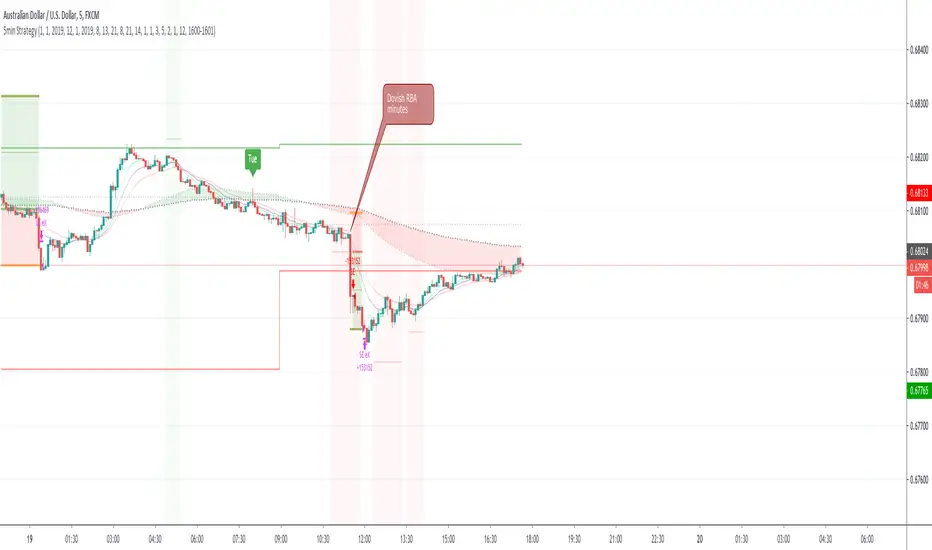
First time coding - a 5min forex Scalping strategy This is my first attempt at producing a strategy in Pine Script.
I am NOT a professional coder. I'm not even a good coder at that. I've only started Pine Script coding since September 2019. I am teaching myself.
This script is far from finished. I need to tweak a number of things about this script. Namely:
Add a validity window to the 'trigger bar' condition. Ie, I want to shut down the condition when the price closes above EMA21
Change the order entry so they are stop orders, using the stop entry price derived from the signals
Make changes to lot sizing
Add a trailing stop condition
Comments welcome, but do not expect me to reply to any questions or requests. In fact, don't expect any replies from me. I consider myself notoriously bad at replies.
I do welcome any feedback from any seasoned coders out there, as I am still a novice coder, and have so much to learn!
As to anyone who wants to criticise me - constructive and helpful criticism are most welcome, criticism to make yourself feel superior to me - you kind can eat a dk.
For the strategy rules, google the user ForexSignals TV account and look for the video "SIMPLE and PROFITABLE Forex Scalping Strategy".
Share, learn, prosper
Peace to y'all
Serialhenry
6/11/19