Trend Oscillator (Expo)Trend Oscillator (Expo) measures the overall trend strength and how strong the current price move/momentum is. The indicator is leading since it can signal a possible trend change that is yet to start. The color of the histogram and its value helps to gauge the strength and momentum of the trend.
The user can enable Bar Color that coloring the candlesticks based on the trend strength.
The user can choose between different trend calculations, such as smoothed trend, volume-weighted trend, a non-lagging trend, to mentions a few.
DIVERGENCES
All types of oscillators produce divergences and so does Trend Oscillator (Expo). Divergences occur when the oscillator deviates from the trending price action. Bullish divergence is then when the trending price makes a lower low but the oscillator makes a higher low. Bearish divergence is then when the trending price makes a higher high but the oscillator makes a lower high.
HOW TO USE
Identify the trend strength and direction
Identify current momentum
Identify potential trend reversals
Identify Overbought and Oversold areas
INDICATOR IN ACTION
1 min chart
I hope you find this indicator useful , and please comment or contact me if you like the script or have any questions/suggestions for future improvements. Thanks!
I will continually work on this indicator, so please share your experience and feedback as it will enable me to make even better improvements. Thanks to everyone that has already contacted me regarding my scripts. Your feedback is valuable for future developments!
-----------------
Disclaimer
Copyright by Zeiierman.
The information contained in my scripts/indicators/ideas does not constitute financial advice or a solicitation to buy or sell any securities of any type. I will not accept liability for any loss or damage, including without limitation any loss of profit, which may arise directly or indirectly from the use of or reliance on such information.
All investments involve risk, and the past performance of a security, industry, sector, market, financial product, trading strategy, or individual’s trading does not guarantee future results or returns. Investors are fully responsible for any investment decisions they make. Such decisions should be based solely on an evaluation of their financial circumstances, investment objectives, risk tolerance, and liquidity needs.
My scripts/indicators/strategies/ideas are only for educational purposes!
ACCESS THE INDICATOR
• Contact me on TradingView or use the links below
Trenddirection

Candle checker for long/short for scalping/day tradingHey.
This strategy is still in working.
For it I check a x amount of candles in the past if they been for example all red/green in row, and based on that I enter. For example candle 7 < candle 6 .... candle 3 < candle 2 .... candle 1 < candle current for long and viceversa for short.
After that,once the trade is initiated, I exit based on 2 possibilities : candle color is different than the color of candle when entry, or based tp/sl.
Let me know what you think of it.
I will try to make the process to calculate automatically and input the number of candles to check like 5-10-15 and so on.

Buying/Selling Pressure & Trend Strength/Direction (Zeiierman)█ Overview
Buying/Selling Pressure & Trend Strength/Direction (Zeiierman) transforms price behavior into a continuous, evolving map of bullish and bearish pressure. The system breaks every candle into internal buying pressure, selling pressure, net dominance, and the broader structural trend environment. These elements combine into a unified visual structure that reveals how actively each side participates and how organized or fragmented the underlying trend has become.
Long/Short Covered visualization adds an additional layer of insight by highlighting moments when traders unwind positions, often exposing squeeze conditions, exhaustion zones, or developing turning points before they appear in price alone.
⚪ Why This One Is Unique
This system stands out because it reconstructs market pressure from multiple directional components rather than relying on a single trend or momentum source. Instead of treating bullish and bearish movement as a simple up/down outcome, it forms a dual-sided pressure environment that adapts to how each side is behaving relative to its own historical structure. This produces a fluid, context-aware representation of participation that moves with the market instead of fighting it.
The anomaly-based Long/Short Covered component adds another layer of uniqueness. Rather than flagging spikes mechanically, it evaluates how current pressure behavior deviates from expected balance and highlights when traders are being forced out of positions. This produces a highly intuitive map of squeeze events, capitulation, and exhaustion dynamics.
█ Main Features
⚪ Buying/Selling Pressure Candles
Visualize the balance between bullish and bearish pressure as oscillator-style candles. Traders use these to quickly see whether current bars are dominated by buying or selling aggression and how strong that pressure is relative to recent history.
Fast Trend: A highly responsive trend layer that reflects short-term pressure shifts. Use it as the earliest indication of changing momentum and as a guide for deciding whether to participate in the developing pressure move or wait for stronger confirmation.
Core Trend: The underlying long-term pressure trend that reveals the broader market direction. Values above zero indicate a bullish regime, while values below zero indicate a bearish regime. Use the Core Trend to align your trades in the same direction as the dominant market trend.
Strong Trend: Strong Trend highlights periods of unusually intense and extended trend movement. These moves can continue for a while, but they often signal that the trend is becoming stretched. Extended Strong Trend conditions can precede exhaustion, deeper pullbacks, or even full reversals, so traders should remain cautious when these appear.
Established Trend: Identifies areas where market pressure has matured into a well-developed directional trend. Use this as a high-confidence confirmation layer. If the Established Trend begins to fade or stop printing while the price weakens, it can be an early sign that a pullback or reversal is approaching.
⚪ Long/Short Covered
Highlights candles where the pressure structure suggests aggressive unwinding of existing positions (longs or shorts). These zones often align with sharp spikes, squeezes, or capitulation and can be used to time reversals, profit-taking, or fade extreme moves.
⚪ Pressure Changes
Pressure Cross
Pressure Cross events show clear shifts where one side’s pressure overtakes the other. They signal that the balance of force is changing, but they still require confirmation from the Fast or Established Trend before being used as entry triggers or position add-ons.
Pre Signals
Pre Signals appear even earlier and highlight the first hints of pressure building in the opposite direction. They act as early heads-up alerts that may reflect short-term fluctuations, so traders should wait for additional confirmation before treating them as meaningful trend movement.
█ How to Use
⚪ Breakout/Momentum Trading (Buying and Selling Pressure)
Buying and selling pressure is displayed directly through the pressure candlesticks. The stronger the coloring, the stronger the force behind the move. This makes it easy to see which side is in control and whether the market is building enough pressure for a breakout or continuation. Traders can use this to gauge the strength of a move and align their entries with the dominant side of the market.
Breakout Trading
When strong green pressure candles appear as the price approaches resistance, it shows that buyers are actively pushing the breakout. Likewise, strong red pressure candles during a breakdown indicate decisive selling pressure. These surges help confirm whether a breakout has real strength behind it and reduce the chances of entering weak or false moves.
Bullish Breakout
Bearish Breakout
Momentum Trading
The deeper the candle coloration, the stronger the underlying momentum. Intense green candles reflect an accelerating bullish drive, while intense red candles reflect an accelerating bearish drive. Traders can use these moments to enter in the direction of momentum, focusing on strong moves that are more likely to continue.
Note: To capture longer and more sustained momentum moves, increase the candle length above 30.
⚪ Trend Trading
The indicator provides several components to evaluate trend direction and trend maturity. The pressure candlesticks and the Core Trend form the foundation of trend detection, while the Established Trend and Strong Trend features help confirm when a trend has developed into a mature, sustained phase. These layers together help identify trends with a higher likelihood of continuation or potential exhaustion when the move becomes extended.
Note: To capture longer and more sustained trend moves, increase the candle length above 30. You can also raise the Smoothed value into the 10–30 range for additional stability.
Candlesticks or Fast Trend
The pressure candlesticks and the Fast Trend can both be used to read trend direction. When green candles dominate and extend above the +200 region, and the Fast Trend is rising while red candles stay above the −200 region, the market is operating in a bullish environment. When red candles dominate below the −200 region, and the Fast Trend is falling while green candles stay below the +200 region, the environment is bearish. Stronger candle coloration and a firmly aligned Fast Trend both signal stronger trend behavior.
Core Trend
The Core Trend complements the candlesticks by offering a clear background bias. Green histogram bars indicate bullish conditions, while red histogram bars indicate bearish conditions. Traders can use the Core Trend to validate whether the pressure structure aligns with the broader directional bias.
⚪ Pressure Changes
Pressure Changes highlight moments where buying and selling pressure begin shifting from one side to the other. These movements often appear before trend transitions, but they are not trend reversals by default. Instead, they reveal temporary or emerging changes in pressure that may or may not develop into a lasting move. Traders should treat these signals as early information that needs further confirmation.
Pressure Cross events mark clear shifts where one side’s pressure overtakes the other. These events show that the balance of force is changing, but they do not guarantee a sustained trend reversal. Traders should confirm the shift by checking alignment with the Fast Trend, Core Trend, or Established Trend before acting on the signal.
Pre Signals appear even earlier than Pressure Cross events and highlight the first hints of pressure building in the opposite direction. These signals offer early awareness but can represent short-term fluctuations rather than meaningful shifts. Traders should use them as heads-up alerts and rely on additional confirmation tools to determine whether the pressure change will evolve into a genuine trend movement.
⚪ Reversal/Pullback Trading (Long/Short Covered)
Long traders eventually need to sell, and short traders eventually need to buy back. These actions can create meaningful pressure spikes that often appear near reversal zones or trend pullback areas.
Long Covered events tend to occur when long positions are being unwound, often marking potential reversal points or areas where price may find support within an existing uptrend. This can provide early clues that the current move is losing steam or preparing to reset.
Short Covered events tend to occur when short positions are being closed, often appearing near resistance zones or within strong downtrends where the market temporarily retraces. These signals can act as early warnings of pullbacks or exhaustion within broader bearish flows.
⚪ Overbought/Oversold
When the pressure candles reach the upper or lower limits, the market may be entering an extended condition. These zones often precede pauses, pullbacks, or full reversals, depending on the broader context. Traders can treat these boundaries as early caution areas where strong moves may temporarily lose strength.
⚪ Divergence Trading
The pressure candles naturally highlight divergences. When price makes a new high or low but the pressure candles fail to confirm with equally strong activity, it suggests that buying or selling pressure is fading. These divergence patterns can help traders identify potential reversal points or weakening momentum in ongoing trends.
█ How It Works
⚪ Buying/Selling Pressure
The indicator reframes each bar through a two-channel transformation that separately models bullish and bearish pressure. Instead of interpreting movement as a single directional value, the system generates a pair of opposing pressure streams that evolve against each other. This creates a dynamic field where dominance, imbalance, acceleration, and exhaustion can be observed simultaneously.
Calculation: Constructs a bi-directional pressure surface using normalized displacement relationships, volatility-adjusted scaling, and directional competition modeling.
⚪ Adaptive Strength Normalization
To avoid flat readings, each side’s pressure is evaluated relative to its own historical envelope, producing a normalized strength scale. This allows the model to interpret current motion in the context of what has recently been “strong” or “weak,” rather than relying on static reference levels.
Calculation: Applies rolling extremum mapping and nonlinear rescaling, converting raw directional activity into a bounded strength metric that reflects real-time contextual significance.
⚪ Geometric Trend Core Engine
Trend state is derived by combining directional pressure into a geometrically structured core. This core reacts not only to direction but to symmetry, dispersion, and slope of the pressure environment. When the core flattens while pressure expands, the system recognizes structural organization, flagging strong trends.
Calculation: Uses geometric mean transformations and smoothed envelope interactions to build a stable trend backbone that identifies when movement transitions from noise into coordinated directional behavior.
⚪ Long/Short Covered Anomaly
Long/Short Covered events emerge from a comparison of expected vs. actual pressure symmetry. When bullish and bearish gradients diverge beyond a context-defined limit, the system interprets it as forced unwinding or aggressive covering. These anomalies often signal structural stress, squeezes, or capitulation.
Calculation: Implements a bidirectional gradient comparison model, where deviation from the neutral equilibrium curve produces a significance score. If this score exceeds its adaptive threshold, an anomaly event is triggered.
-----------------
Disclaimer
The content provided in my scripts, indicators, ideas, algorithms, and systems is for educational and informational purposes only. It does not constitute financial advice, investment recommendations, or a solicitation to buy or sell any financial instruments. I will not accept liability for any loss or damage, including without limitation any loss of profit, which may arise directly or indirectly from the use of or reliance on such information.
All investments involve risk, and the past performance of a security, industry, sector, market, financial product, trading strategy, backtest, or individual's trading does not guarantee future results or returns. Investors are fully responsible for any investment decisions they make. Such decisions should be based solely on an evaluation of their financial circumstances, investment objectives, risk tolerance, and liquidity needs.
Ücretli komut dosyası

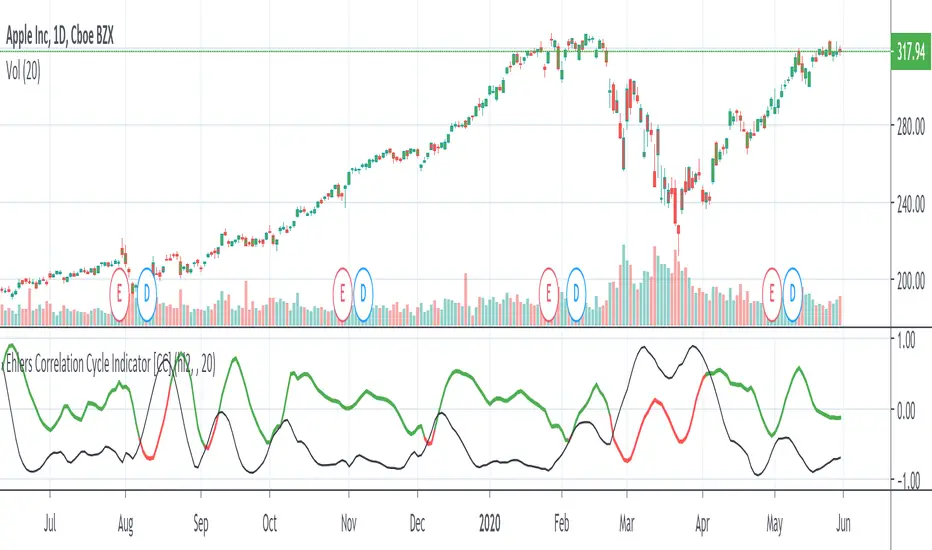
Ehlers Correlation Cycle IndicatorThe Correlation Cycle Indicator was created by John Ehlers (Stocks & Commodities V. 38:06 (8–15)) and this is technically part of three indicators in one so I'm splitting each one to a separate script. This particular indicator was designed for trend direction and trend strength and simply buy when it is green and sell when it turns red. Also keep in mind that the higher the indicator is above the signal then the stronger the trend and when they are close together, conditions get choppy.
Let me know if you would like to see me publish other scripts or if you want something custom done!
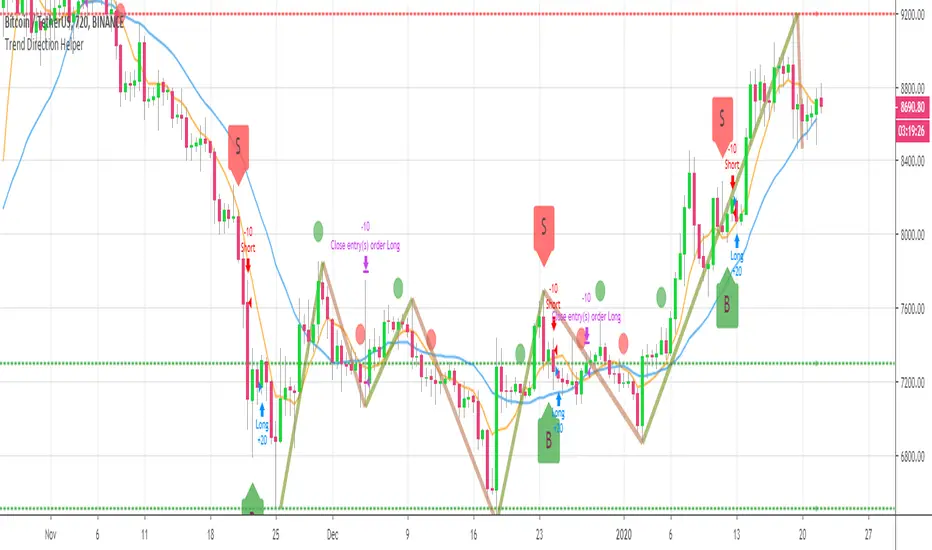
BEST Trend Direction Helper (Strategy Edition)Hello traders
A follower asked me to convert my Trend Direction Helper into a strategy
So blessed this indicator reached the 1400+ likes milestone - I can't believe how many people are trading with it
I based the setup as follow:
- Entries on those green/red labels
- exit whenever a Simple Moving Averages cross in the opposite direction happen
- possibility to filter only Longs/Shorts or both
Also...
The strategy includes the Zig Zag/Pivots high/low and other options from the indicator version. I only added a quick strategy component with a hard exit concept based on SMA cross
All the best fam and... HAPPY NEW YEAR !!!!!!!!!!!
Dave
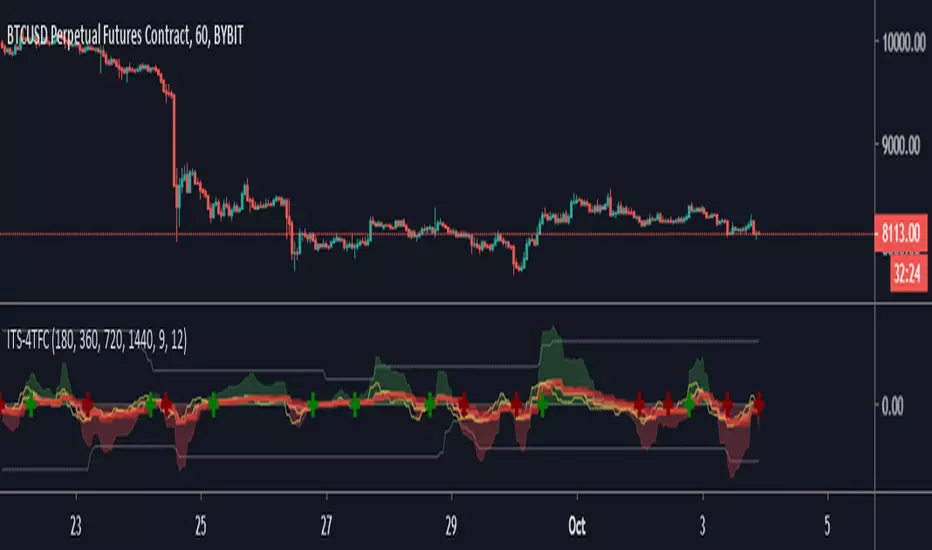
Iconik Trading Suite: 4 Time Frame ConfirmationThis indicator displays Iconik MACD bullish crosses (crossing above the 0-line) and bearish crosses (crossing below the 0-line) for 4 higher time frames. This provides a nice confirmation of time frames for a prevailing trend.
DM for a PowerPoint describing this indicator and the rest of Iconik in detail.
Iconik Trading Suite Indicator List:
ITS-OSC: Oscillators (v2)
ITS-PAA: Price Action Alerts (v2)
ITS-ASR: Auto Support/Resistance
-> Daily (v2)
-> 3 Day (v2)
-> Weekly (v2)
ITS-4TFC: 4 Time Frame Confirmation (v1)
ITS-DIV: Divergence Seeker (v1)
Trend Direction Helper (ZigZag and S/R and HH/LL labels)Hey everyone
First of all, I'd like to thank Ricardo Santos, Backtest Rookies for the inspiration for this script.
Actually, most of it is coming from them and I only mixed them up (and added my secret sauce ^^). If some of you are not thinking about a trading secret sauce, please get serious for a moment :)
Some of you asked me how I do to set the trend direction. You all understood that if you get an UP label, then the price should go up and vice-versa for down.
But it's not so easy to define the good signals for each asset and each timeframe. I'm going to repeat what I said yesterday because ... well... that's what trading is about
So quoting myself here "The inputs set by default will have to be changed for your asset/timeframe and can't be generic for everything. You have to play with the inputs until the signals will make sense to you
The indicator/strategy with a unique configuration that you'll never check or update according to the market condition DOES NOT exit. "
BUT... a bit of patience and practice and you might do wonders.
The Method
I never realized until now but by connecting the higher highs/lower lows, I was drawing zigzag lines.
The Zig Zag Master is Ricardo Santos . Please give him a follow, he's awesome
For those who don't want to draw on the chart or (my preferred choice) need some inspiration to define your trend directions, this script is for YOU (and your family, your pet, your girlfriend/boyfriend, ...)
I think that each asset/timeframe chart has its own history. What worked in a post could work in the future.
In that regard, if a trend direction worked in the past, that's the parameter that I'll use to trade with it in a demo account and make sure it's relevant. If not then I will adjust
If you're trading with new indicators or a new method right away on your real trading account, you're gonna have a bad time imgflip.com
Lines EVERYWHERE
The script draws the classical horizontal pivots + the zig zag lines + the Higher Highs/Lower Lows label in just 1 script. I'm very excited to share a script (on which I coded 100 lines out of 500) but no one else did it
The horizontal pivots part are coming from Backtest Rookies
For more security, you can add a pullback on a moving average after getting a signal. Pullbacks are necessary to limit any eventual loss or maximize your gains by getting in the trend sooner.
I really give you a solid method and a great script in my opinion. 6 years of experience given away for FREE :p (when Dave will start thinking as a business man instead :O)
Does it repaint ?
Getting this question twice a day. You guys are obsessed with the repainting :)
Short answer, yes because it will calculate the pivots and zig zags whenever new higher highs/lower lows will be formed.
However, the trend direction code is based on the candle close so it shouldn't repaint. If it does, please let me know
See you all on Monday
Love you all
Dave
____________________________________________________________
Be sure to hit the thumbs up. Building those indicators take a lot of time and likes are always rewarding for me :) (tips are accepted too)
- If you want to suggest some indicators that I can develop and share with the community, please use my personal TRELLO board
- I'm an officially approved PineEditor/LUA/MT4 approved mentor on codementor. You can request a coaching with me if you want and I'll teach you how to build kick-ass indicators and strategies
Jump on a 1 to 1 coaching with me
- You can also hire for a custom dev of your indicator/strategy/bot/chrome extension/python
Disclaimer:
Trading involves a high level of financial risk, and may not be appropriate because you may experience losses greater than your deposit. Leverage can be against you.
Do not trade with capital that you can not afford to lose. You must be aware and have a complete understanding of all the risks associated with the market and trading. We can not be held responsible for any loss you incur.
Trading also involves risks of gambling addiction.
Please notice I do not provide financial advice - my indicators, strategies, educational ideas are intended to provide only some source code for anyone interested in improving their trading
The proprietary indicators and strategies developed by Best Trading Indicator, the object of intellectual property rights are and remain the exclusive property of Best Trading Indicator, at the exclusion of images and videos and texts free of rights or provided by the Company or external legal or physical person.
No assignment of intellectual property rights is carried out through these Terms and Conditions.
Any total or partial reproduction, modification or use of these properties for any reason whatsoever is strictly prohibited without the express written authorization of the Company.

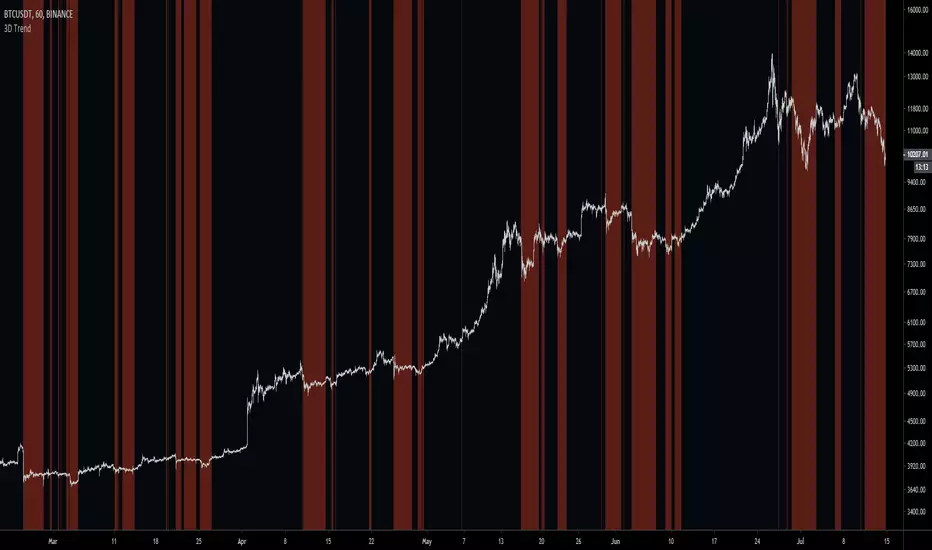
3D Trend Identification [MaliciousUpload]The trend is your friend. :)
Comparison of the previous 3 day's data.
This is used for directional confirmation of trend.
Not a "BUY/SELL NOW 100x NO SL" type of indicator.
Dark Blue = Long opportunity
Orange = Short opportunity
Hit me up on Discord, always looking for experienced traders to chat with
MaliciousUpload#1637
The source code of this study is protected. Everyone can add it to favorites and use it, but only you can see the source code of this script.
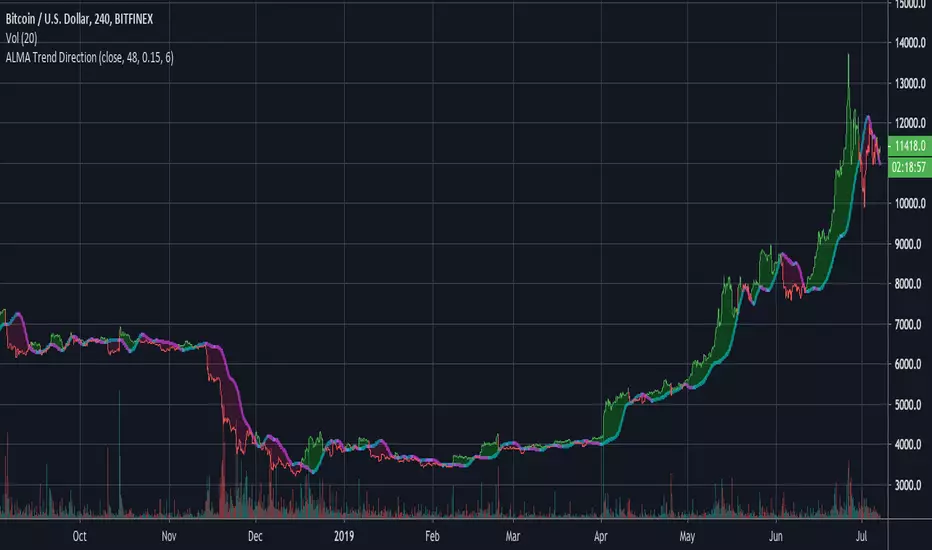
ALMA Trend DirectionHere is a very simple tool that uses the Arnaud Legoux Moving Average(ALMA). The ALMA is based on a normal distribution and is a reliable moving average due to its ability to reduce lag while still keeping a high degree of smoothness.
Input Options:
-Offset : Value in range {0,1} that adjusts the curve of the Gaussian Distribution. A higher value will result in higher responsiveness but lower smoothness. A lower value will mean higher smoothness but less responsiveness.
-Length : The lookback window for the ALMA calculation.
-Sigma : Defines the sharpe of the curve coefficients.
I find that this indicator is best used with a longer length and a 4 Hour timeframe. Overall, its purpose is to help identify the direction of a trend and determine whether a security is in an uptrend or a downtrend. For this purpose, it is best to use a lower offset value since we are looking to identify long-term, significant price movement rather than small fluctuations.
The Chart:
The ALMA is plotted as the aqua and pink alternating line. It is aqua when bullish and pink when bearish.
The low price for each candle is then compared to the ALMA. If the low is greater than the ALMA, then there is a bullish trend and the area between the candles and ALMA is filled green. The area between the ALMA and candles is filled red when the low price is less than the ALMA.
The difference between the slow ALMA and candles can reveal a lot about the current market state. If there is a significant green gap between the two, then we know that there is a significant uptrend taking place. On the other hand, a large red gap would indicate a significant downtrend. Similarly, if the gap between the two is narrowing and the ALMA line switches from aqua to pink, then we know that a reversal could be coming shortly.
~Happy Trading~
Reverse Engineered RSI - Key Levels + MTFThis indicator overlays 5 Reverse Engineered RSI (RERSI) levels on your main chart window.
The RERSI was first developed by Giorgos Siligardos in the June 2003 issue of Stocks and Commodities Magazine. HPotter provided the initial implementation - from which this script is derived - so all credit to them (see: ).
In simple terms, RERSI plots lines on the price chart that reflect levels of the RSI . E.g. if you set up a RERSI line at a level of 50, then price will touch that line when the standard RSI indicator reads 50. Hopefully that makes sense, but compare the two if it doesn't.
Why is the RERSI useful if it's just plotting RSI values? Well, it simplifies things, and enables you to get a clearer picture of trend direction, RSI support and resistance levels, RSI trading signals, and it keeps your chart window uncluttered.
I've set up 5 RERSI lines to be plotted: Overbought and Oversold Levels, a Middle Level (generally leave this at 50), and then Down/Up Trend Lines. The latter two are loosely based on the work of Constance Brown (and they in turn were influenced by Andrew Brown), who posited that RSI doesn't breach certain levels during trends (e.g. 40-50 is often a support level during an uptrend).
Play around with the levels, and the RSI Length, to see how your particular market reacts, and where key levels may lie. Remember, this isn't meant as a stand-alone system (although I think there's potential to use it as such, especially with price action trading - which I guess wouldn't make it stand-alone then!!), and works best with confirmation from other sources.
Oh, and there's MTF capability, because I think that's useful for all indicators.
Any queries, please let me know.
Cheers,
RJR


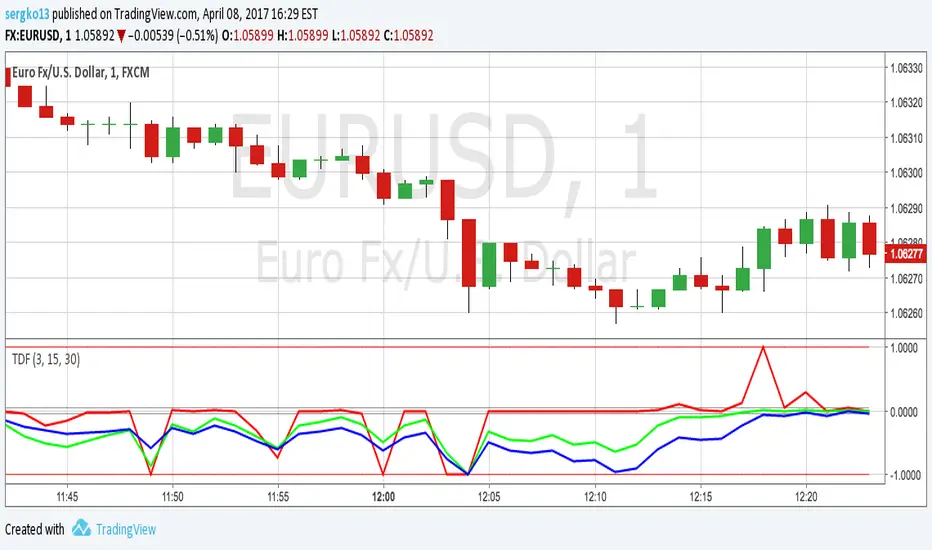
TDF UNITrend Direction and Force Index. I'm really fascinated by this indicator and decided to modify the original version by adding different averaging methods. New variable averaging period for extremums analysis is also added

Trend Direction and Force IndexTrend direction and force index for binary options. Minor corrections to code. All invite-only scripts have been disabled