Orderblock Footprints [AlgoAlpha]🟠 OVERVIEW
This script highlights orderblocks and then drills into what actually trades inside them. Zones are created only after an abnormal directional impulse, measured with a z-score on consecutive candle bodies, so the orderblocks are tied to real expansion rather than simple pivots. Once a zone exists, the script overlays lower-timeframe volume footprints inside the candle when price trades back into that zone. The goal is to show not just where an orderblock sits, but whether price is being accepted or absorbed when it is revisited.
🟠 CONCEPTS
Orderblocks are detected after extreme bullish or bearish impulses. The script tracks consecutive body movement up or down, normalizes that distance with a rolling z-score, and only triggers when the move is statistically large. The last opposite candle before that impulse defines the orderblock range. These zones then extend forward until they are either mitigated by price closing through them or they expire by age.
Inside an active zone, the script switches to a lower timeframe and builds a footprint-style profile for each bar. Each candle is split into price rows, counting time-at-price and volume delta. Positive and negative delta are colored separately. Absorption is flagged when opposing delta prints appear in the wick that rejects the zone. In practice: the impulse defines context ; the footprint shows interaction .
🟠 FEATURES
Separate bullish and bearish zones with automatic extension
Volume split inside each zone candle (up vs down volume)
Lower-timeframe footprint with TPO-style rows and delta gradient
Absorption detection using opposing delta in rejection wicks
Alerts for zone creation and absorption events
🟠 USAGE
Setup : Add the script to your chart. It works on any market and timeframe. The lower timeframe for footprints is fixed at 5 minutes, so higher chart timeframes show clearer structure. Use the Z-Score Window to control how strict impulse detection is and Max Box Age to limit how long old zones stay on the chart.
Read the chart : Bullish orderblocks are created after strong upward impulses and are invalidated when price closes below them. Bearish orderblocks are created after strong downward impulses and are invalidated when price closes above them. When price trades inside a zone, footprint rows appear. Green-tinted rows show positive delta; red-tinted rows show negative delta. Absorption labels appear when opposing delta prints into a rejecting wick.
Settings that matter : Increasing the Z-Score Window makes orderblocks rarer but more significant. Disabling Prevent Overlap allows stacked zones if you want to study clustering. Adjusting Rows per bar changes footprint resolution—lower values are cleaner, higher values show more detail but use more objects.
Trend Analizi

Tomb Reversal Signal Engulfing + RSI Momentum DetectorTomb is a fast and minimalistic reversal-detection indicator built to capture high-probability turning points in the market.
It combines engulfing candlestick patterns, a strong candle body filter, and RSI momentum analysis to generate precise BUY and SELL signals with minimal noise.
🔍 How it Works
The indicator triggers:
✅ BUY Signal
Bullish engulfing pattern appears
Candle body strength > 50% of total range (real momentum)
RSI below 50 (bearish momentum weakening)
Price decreasing over the last 5 bars (down-trend exhaustion)
✅ SELL Signal
Bearish engulfing pattern
Candle body shows strength
RSI above 50 (bullish momentum weakening)
Price increasing over the last 5 bars (up-trend exhaustion)
⚡ Why Tomb Works
Filters out weak signals using candle structure
Detects momentum shifts early
Works on all markets: Crypto, Forex, Indices, Stocks
Ideal for scalping, day trading, or swing trading
🎯 Purpose
To highlight the exact moments where the market shows exhaustion and is ready to reverse—before most traders see it.
📌 Recommended Use
For best performance:
Combine with trend tools such as EMA 200 or market structure
Look for signals at support/resistance or liquidity zones

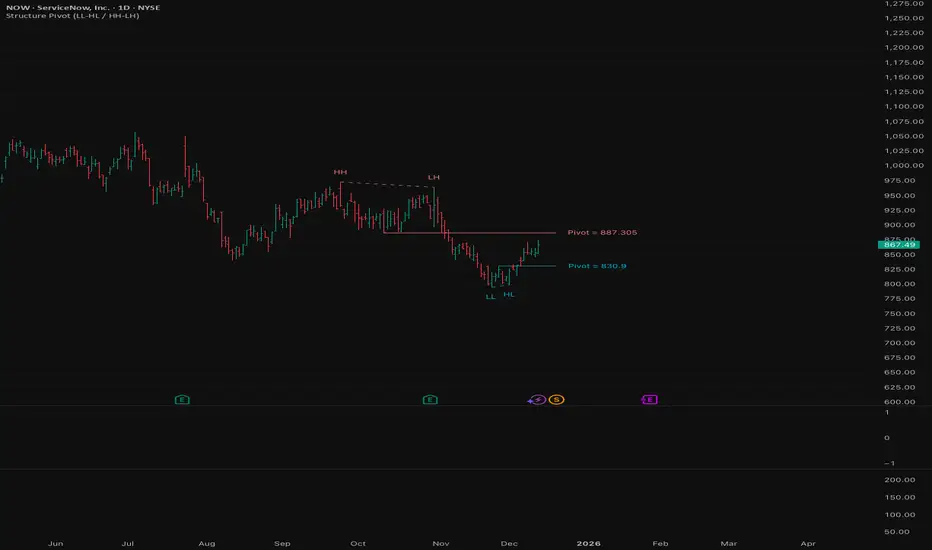
Structure Pivot (LL-HL / HH-LH)Structure Pivot (LL-HL / HH-LH) - Indicator Guide
This indicator scans for market structure pivot patterns—specifically the bullish Higher Low (LL–HL) and the bearish Lower High (HH–LH) —across multiple lengths simultaneously.
It automatically selects the most optimal pattern based on a "Priority Mode" and plots the structure and breakout/breakdown levels on the chart.
1. Basic Calculation Method
The indicator builds upon TradingView’s ta.pivotlow and ta.pivothigh functions to identify structural points.
Bullish Structure (LL–HL)
1.LL (Lowest Low): A standard Pivot Low is identified.
2.HL (Higher Low): A subsequent Pivot Low forms higher than the previous LL. This completes the setup.
3.Pivot Line (Resistance): The indicator finds the highest price (High) that occurred between the LL and the HL. This level becomes the breakout trigger.
Bearish Structure (HH–LH)
1.HH (Highest High): A standard Pivot High is identified.
2.LH (Lower High): A subsequent Pivot High forms lower than the previous HH. This completes the setup.
3.Pivot Line (Support): The indicator finds the lowest price (Low) that occurred between the HH and the LH. This level becomes the breakdown trigger.
2. Multi-Length Scanning
Unlike standard indicators that use a single fixed length (e.g., Length = 5), this indicator scans a range of lengths simultaneously.
・Settings: Defined by Min Length and Max Length.
・Mechanism: If set to Min=2 and Max=10, the indicator internally runs 9 separate calculations (Length 2 through 10) in parallel.
This allows it to capture everything from small, short-term pullbacks to larger, significant structural pivots without manual adjustment.
3. Priority Mode System
Since multiple lengths are scanned, multiple valid patterns may appear at the same time. The Priority Mode determines which single pattern is the "winner" and gets displayed.
A. Tightest Structure (Default)
・For Bullish (Long): Selects the pattern with the lowest Pivot Line (Resistance).
・For Bearish (Short): Selects the pattern with the highest Pivot Line (Support).
・Advantage: It finds the "tightest" contraction (like a VCP). This offers the entry point closest to the stop-loss level, providing the best Risk/Reward ratio.
B. Longest Length
・Selects the pattern detected by the longest length setting.
・Advantage: Focuses on major structural points, filtering out short-term noise. Best for trend confirmation.
C. Shortest Length
・Selects the pattern detected by the shortest length setting.
・Advantage: Extremely sensitive. Best for scalping or catching immediate micro-pullbacks.
4. Real-Time Logic & Features
Structure Invalidation (Failure)
・Bullish: If the current price drops below the HL (the support of the structure), the setup is considered failed.
・Bearish: If the current price rises above the LH (the resistance of the structure), the setup is considered failed.
・Result: All lines and labels for that structure are immediately deleted to keep the chart clean.
Pivot Line Extension
・As long as the structure remains valid (price hasn't violated the HL or LH), the Pivot Line extends to the right, acting as a live reference for breakouts or breakdowns.
Alerts
・Bullish Breakout: Triggered when the Close price crosses over the Pivot Line.
・Bearish Breakdown: Triggered when the Close price crosses under the Pivot Line.
LL-HL PivotThis indicator scans for the bullish structure known as a Higher Low (HL) across multiple lengths simultaneously, automatically selects the most suitable pattern, and plots it on the chart.
Below is a detailed explanation of how it works.
1. Basic Calculation Method (Definition of LL and HL)
This indicator is built on TradingView’s ta.pivotlow function.
Detecting Pivot Lows
For a given length, a Pivot Low is identified as the lowest point among the candles within the specified range to the left and right.
LL and HL Determination
LL (Lowest Low): The most recent Pivot Low is treated as the previous low.
HL (Higher Low): When a new Pivot Low forms above the previous LL, it is recognized as an HL, and the setup is considered “complete.”
Identifying the Pivot Line
During the LL–HL structure, the highest high between them is identified and used as the breakout level (Pivot Line / resistance), where a horizontal line is drawn.
2. Multi-Length Scanning
Unlike standard indicators that use only one length (e.g., Length = 5), this indicator evaluates a full range of lengths.
Min Length to Max Length
Example: Min = 2, Max = 10
Internally, it functions as if nine separate indicators (Length 2, 3, 4 … 10) are running simultaneously.
This allows the indicator to capture:
Small waves (short-term pullbacks)
Larger waves (broader structural moves)
3. Priority Mode System
Because multiple lengths are calculated at the same time, different LL–HL patterns may appear simultaneously.Priority Mode determines which setup is selected and displayed.
A. Lowest LH
Selects the pattern with the lowest pivot line (intermediate high).
Advantages:
Produces the lowest possible entry price
B. Longest Length
Selects the pattern with the longest length.
Advantages:
Focuses on larger structures and broader waves
Filters out noise
C. Shortest Length
Selects the pattern with the shortest length.
Advantages:
Reacts quickly to small moves
Useful for scalping or fast trend-following
Captures very short-term pullbacks
4. Additional Behavior and Features
Real-Time Invalidation
If price breaks below the confirmed HL, the structure is immediately considered invalid.
All previously drawn lines and labels are removed instantly, preventing outdated structures from remaining on the chart.
Pivot Line Extension
As long as the HL remains intact, the Pivot Line (breakout level) continues extending to the right.
Alerts
An alert can be triggered the moment price breaks above the Pivot Line on a closing basis.

Order Block Finder [MHA Finverse]Order Block Finder is a sophisticated Smart Money Concepts (SMC) tool designed to identify and visualize institutional order blocks on your charts. This indicator helps traders spot key areas where smart money has placed their orders, providing valuable insights for potential support and resistance zones.
What are Order Blocks?
Order blocks are price zones where institutional traders have placed significant orders. This indicator identifies these zones by detecting pivot points in price action and tracking structural breaks in both internal (short-term) and swing (long-term) timeframes.
Key Features:
• Dual Structure Analysis
- Internal Order Blocks: Fast-moving blocks based on 5-bar pivots for short-term trading
- Swing Order Blocks: Slower blocks based on 50-bar pivots for position trading
- Display up to 20 order blocks per type
• Volume Metrics
Each order block displays two important metrics:
- Volume value: The total volume of the candle that formed the order block
- Percentage: Relative volume compared to all visible order blocks (always totals 100%)
Higher percentages indicate stronger institutional activity and more significant zones
• Smart Filtering System
- ATR Filter: Filters out high-volatility candles (>2x ATR) to focus on genuine order blocks
- CMR Filter: Uses Cumulative Mean Range for adaptive filtering across different market conditions
• Flexible Mitigation Options
Choose how order blocks are considered broken:
- High/Low: Order block breaks when price touches its boundary
- Close: Order block breaks only when candle closes through it
• Visual Customization
- Colored or Monochrome themes
- Adjustable text size for volume metrics
- Customizable colors for bullish and bearish blocks
- Historical or Present mode for clean chart analysis
• Built-in Alert System
- Real-time alerts when order blocks are mitigated
- Individual toggles for each alert type
- Clear emoji indicators (🔵 Bullish, 🔴 Bearish)
- Compatible with TradingView's alert system
How It Works:
The indicator identifies order blocks by:
1. Detecting pivot highs and lows in price structure
2. Monitoring when price crosses these pivots (structure breaks)
3. Finding the highest/lowest volatility-filtered candle in the pivot zone
4. Marking this candle as an order block with its volume data
5. Removing blocks when the price mitigates them
Order blocks with higher volume percentages represent stronger institutional interest and are typically more reliable for trading decisions.
Best Practices:
- Use Internal OBs for day trading and scalping
- Use Swing OBs for swing trading and position entries
- Pay attention to blocks with higher volume percentages
- Combine with other SMC concepts for confirmation
Perfect for traders who follow Smart Money Concepts, ICT methodology, and institutional trading analysis.
Disclaimer:
This indicator is provided for educational and informational purposes only. It should not be considered as financial advice or a recommendation to buy or sell any financial instrument. Trading involves substantial risk of loss and is not suitable for all investors. Past performance does not guarantee future results. Always conduct your own research and consult with a qualified financial advisor before making any trading decisions. The creator of this indicator assumes no responsibility for any losses incurred from its use.

Momentum Candle V3 by Sekolah TradingMomentum Candle v3 by Sekolah Trading
Description:
Momentum Candle v3 is a technical indicator designed to identify market momentum signals based on price movement within a single candle. The indicator measures the size of the candle's body and wick to determine if the market is showing strong bullish or bearish momentum.
Key Features:
Candle Size: Measures price movement within a single candle to assess market momentum.
Short Wick: Focuses on wick length, with short wicks indicating that the closing price is more significant than the opening price.
Bullish/Bearish Momentum: Provides bullish signals when the closing price is higher than the open, and bearish signals when the closing price is lower than the open.
Customizable Minimum Body: Users can adjust the minimum body size for XAUUSD and USDJPY pairs according to their trading preferences.
Timeframe: Works on M5 and M15 timeframes for XAUUSD and USDJPY currency pairs.
How to Use:
Bullish Signal: The indicator signals bullish momentum when the candle body is sufficiently large and the wick is short, with the closing price higher than the open.
Bearish Signal: The indicator signals bearish momentum when the candle body is sufficiently large and the wick is short, with the closing price lower than the open.
Pip Parameters: Adjust the pip values for XAUUSD and USDJPY according to market conditions or your trading preferences.
Note: This indicator is a tool for technical analysis and does not guarantee specific trading results. It is recommended to use it alongside other strategies and analyses for better accuracy.
Realistic Backtest Results:
To ensure transparency and honesty in the backtest, here are some key factors to consider:
Position Size: The backtest uses a realistic position size of about 5-10% of the account equity per trade.
Commission & Slippage: A commission of 0.1% per trade and slippage of 1 pip were used in the backtest simulation to reflect real market conditions.
Number of Trades: The backtest sample includes more than 100 trades for a representative result.
Example of Backtest Results:
Profitability: The backtest results on XAUUSD and USDJPY show consistent performance with this strategy on the M5 and M15 timeframes.
Commission and Slippage: Adjusting for commission and slippage showed better accuracy under more realistic market scenarios.
How to Use the Indicator:
Signals from this indicator can be used to confirm market momentum in trending conditions. However, it is highly recommended to combine this indicator with other technical analysis tools to minimize the risk of false signals.
Important Notes:
Honesty & Transparency: This indicator is designed to provide signals based on technical analysis and does not guarantee specific trading results.
No Over-Claims: The backtest results displayed represent realistic scenarios and are not intended to promise certain profits.
Original Content: The code for this indicator is original and does not violate any copyrights.
Tagging:
Smart Tags: Momentum, Candle, XAUUSD, USDJPY, Bullish, Bearish, M5, M15, Technical Indicator, Market Momentum.

VWAP Flow ParmezanThe "Official Bank Flow VWAP" is a comprehensive trading suite designed for institutional Forex traders.
This indicator solves the problem of chart clutter by combining two critical components of liquidity: Price (Value) and Time (Sessions). It is specifically optimized for EUR/USD and GBP/USD on intraday timeframes (M5, M15), helping you identify high-probability setups where "Fair Value" meets "Volatility."
Key Features
1. Multi-Timeframe VWAP Hierarchy Unlike standard indicators, this tool visualizes the interaction between three distinct timeframes:
Daily VWAP (Dynamic Color): Your primary trend filter. Green when Bullish (Price > VWAP), Red when Bearish (Price < VWAP).
Weekly VWAP (Orange Dots): Represents the medium-term balance. Acts as a magnet for mean reversion mid-week.
Monthly VWAP (Purple Line): The institutional "line in the sand." Major support/resistance level.
2. Standard Deviation Bands (Market Balance) The indicator plots SD1 and SD2 bands around the Daily VWAP:
Inner Zone (SD1): Represents the "Fair Value" area.
Outer Bands (SD2): Represents overbought/oversold conditions. Useful for identifying mean reversion plays back to the center.
3. Official Exchange Sessions (Time) Forget confusing "killzones." This tool highlights the Official Open times for major exchanges, adjusted for Daylight Savings via New York time:
London Open (08:00 LDN): The start of European volume.
New York Open (08:00 NY): The injection of US liquidity.
London Close/Fix: The daily overlap close, often marking trend reversals.
Note: Sessions are visualized with non-intrusive black "shadow" backgrounds to keep your chart clean.
4. "Ghost" Levels (Previous VWAP) A unique feature that plots the closing VWAP level of the previous day. Institutional algorithms often target these "untested" levels as Take Profit targets or liquidity pools.
How to Use
Trend Following: If Price is above the Daily VWAP (Green) during the London Open, look for Long entries targeting the SD1/SD2 upper bands.
Mean Reversion: If Price hits the SD2 Band while far away from the Weekly VWAP, look for a reversal back to the mean.
Confluence: The strongest signals occur when price touches a key VWAP level (e.g., Weekly VWAP) specifically during the highlighted Session Start times.
Settings
Timezone: Defaults to America/New_York to automatically handle DST shifts for London/NY opens.
Visuals: Fully customizable colors and transparency. Default is set to a "Dark Mode" friendly professional palette.

Fractal Fade Pro IndicatorA revolutionary contrarian trading indicator that applies chaos theory, fractal mathematics, and market entropy to generate high-probability reverse signals. This indicator fades traditional technical signals, providing BUY signals when conventional indicators say SELL, and SELL signals when they say BUY.
Full Description:
Most traders follow the herd. QFCI does the opposite. It identifies when conventional technical analysis is about to fail by detecting mathematical patterns of exhaustion in market structure.
How It Works (Technical Overview):
The indicator combines three sophisticated mathematical approaches:
Fractal Dimension Analysis: Measures the "roughness" of price movements using fractal mathematics
Market Entropy Calculation: Quantifies the randomness and disorder in price returns using information theory
Phase Space Reconstruction: Analyzes price evolution in multi-dimensional state space from chaos theory
Signal Generation Process:
Step 1: Market Regime Detection
Chaotic Regime: High fractal complexity + rising entropy (avoid trading)
Trending Regime: Low fractal complexity + high phase space distance (fade breakouts)
Mean-Reverting Regime: Very low fractal complexity (fade extremes)
Step 2: Reverse Signal Logic
When traditional indicators would give:
BUY signal (breakout, oversold bounce, volatility spike) → QFCI shows SELL
SELL signal (breakdown, overbought rejection, volatility crash) → QFCI shows BUY
Step 3: Smart Signal Filtering
No consecutive same-direction signals
Adjustable minimum bars between signals
Multiple confirmation layers required
Unique Features:
1. Mathematical Innovation:
Original fractal dimension algorithm (not standard indicators)
Market entropy calculation from information theory
Phase space reconstruction from chaos theory
Multi-regime adaptive logic
2. Trading Psychology Advantage:
Contrarian by design - profits from market overreactions
Fades retail trader mistakes - enters when others are exiting
Reduces overtrading - strict signal frequency controls
3. Clean Visual Interface:
Only BUY/SELL labels - no chart clutter
Clear directional arrows - immediate signal recognition
Built-in alerts - never miss a trade
Recommended Settings:
Default (Balanced Approach):
Fractal Depth: 20
Entropy Period: 200
Min Bars Between Signals: 100
Aggressive Trading:
Fractal Depth: 10-15
Entropy Period: 100-150
Min Bars Between Signals: 50-75
Conservative Trading:
Fractal Depth: 30-40
Entropy Period: 300-400
Min Bars Between Signals: 150-200
Optimal Timeframes:
Primary: Daily, Weekly (best performance)
Secondary: 4-Hour, 12-Hour
Can work on: 1-Hour (with adjusted parameters)
How to Use:
For Beginners:
Apply indicator to chart
Use default settings
Wait for BUY/SELL labels
Enter on next candle open
Use 2:1 risk/reward ratio
Always use stop losses
For Advanced Traders:
Adjust parameters for your trading style
Combine with support/resistance levels
Use volume confirmation
Scale in/out of positions
Track performance by regime
Risk Management Guidelines:
Position Sizing:
Conservative: 1-2% risk per trade
Moderate: 2-3% risk per trade
Aggressive: 3-5% risk per trade (not recommended)
Stop Loss Placement:
BUY signals: Below recent swing low or -2x ATR
SELL signals: Above recent swing high or +2x ATR
Take Profit Targets:
Primary: 2x risk (minimum)
Secondary: Previous support/resistance
Tertiary: Trailing stops after 1.5x risk
IMPORTANT RISK DISCLOSURE
This indicator is for educational and informational purposes only. It is not financial advice. Past performance does not guarantee future results. Trading involves substantial risk of loss and is not suitable for every investor. The risk of loss in trading can be substantial. You should therefore carefully consider whether such trading is suitable for you in light of your financial condition.

Dragon Flow Arrows (Smoothed LITE)🚀 DRAGON FLOW ARROWS — LITE | Smart Trend Engine + Clean Reversal Arrows
A lightweight but highly-optimized trend system designed for clean charts, powerful visual signals, and no-noise directional flow.
Built for traders who want simplicity, clarity, and professional-level momentum-filtered signals without over-complication.
🔥 Dragon Channel (Clean 3-Line Ribbon)
A smooth adaptive channel formed from ATR + EMA, giving you structural trend zones without clutter. No double bands, no messy overlaps just a clear upper/lower boundary.
✅ Dragon Flow Gradient
A horizontal, color-shifted flow:
🟢 Bull flow → green glow
🔴 Bear flow → red glow
Automatic blend based on trend direction
Smooth visual transitions (no vertical stripes)
✅ Momentum-Filtered Arrows (No Spam)
BUY/SELL arrows only print when:
Price breaks outside the Dragon Channel
Momentum confirms (RSI + MACD filters)
Trend flips → one clean arrow per direction
Text labels sit outside the channel for better readability.
✅ Smart Header Panel
At the top of your chart:
📌 Trend: Uptrend / Downtrend / Neutral
⚡ Impulse Strength: Weak / Normal / Strong
© FxShareRobots.com brand bar
Everything compact. Everything professional.
📊 How to Use
BUY Setup
Price moving above baseline
Dragon Flow turns bullish (cyan side)
Arrow appears below channel
SELL Setup
Price breaks below baseline
Dragon Flow turns bearish (magenta side)
Arrow pops above channel
Exit / Filter
Opposite arrow
Flow color shift
Trend panel flips
Works on Forex, Crypto, Stocks, Indices — all timeframes.
🆚 LITE vs PRO
Feature LITE PRO
Dragon Channel ✔ ✔ +Enhanced
Trend Panel ✔ ✔ +Multi-TF
Reversal Arrows ✔ ✔ + Confirmation
Momentum Filter ✔ ✔ +Expanded
Alerts ✖ ✔ +Full Suite
Reversal Zones ✖ ✔ +Predictive Map
Trade Strategy ✖ ✔ +Included + PDF
🔓 Upgrade to DRAGON FLOW — PRO
Unlock alerts, HTF confirmation, advanced momentum engine, and predictive reversal zones:
👉 fxsharerobots.com/itp/
❤️ If this helped your trading — please Like & Follow!
This supports future updates and keeps the LITE version source code free for the community.
Happy trading,
FxShareRobots Team

TRI - Layered Multi-Timeframe Support & ResistanceTRI - LAYERED MULTI-TIMEFRAME SUPPORT & RESISTANCE v1.0.0
DESCRIPTION:
Advanced multi-timeframe Support & Resistance indicator using ta.pivothigh/ta.pivotlow
to display pivot-based S/R levels from MULTIPLE timeframes simultaneously on your chart.
Each timeframe has its own configurable color and line width for easy visual distinction.
Features smart pivot positioning, dynamic level merging, retest detection, and comprehensive alert system.
KEY FEATURES:
Display S/R from multiple timeframes at once (15m, 1h, 4h, D, W, M)
Each timeframe has independent toggle, color, and line width
Smart timeframe filtering - never shows TFs lower than current chart
Current chart TF is always visible (cannot be disabled)
Configurable max number of higher timeframes to display
Multi-timeframe pivot detection using ta.pivothigh/ta.pivotlow on candle body
Smart pivot positioning - pivots placed on correct candle type (bullish for highs, bearish for lows)
Dynamic level merging - nearby levels merged based on ATR tolerance (newer wins)
Mitigated level tracking - broken levels shown with dashed style and configurable transparency
Price scale display - levels shown on price scale with their colors
Retest detection - identifies bounces off S/R levels (current TF only)
Comprehensive alert system with 12 alert types (current TF only)
Significant breakout detection with configurable parameters
Memory efficient - automatic cleanup of expired levels
HOW IT WORKS:
The indicator uses ta.pivothigh() and ta.pivotlow() on each enabled timeframe.
Pivot highs are positioned on bullish candles (using close price).
Pivot lows are positioned on bearish candles (using close price).
If the pivot candle is not the correct type, it searches back up to 5 candles.
Only unbreached levels are displayed as active support/resistance.
When a level is breached, it becomes a "mitigated level" with dashed styling and transparency.
Mitigation is checked only after the first candle following the pivot (to avoid false triggers).
TIMEFRAME FILTERING:
Timeframes LOWER than current chart are NEVER shown
Current chart timeframe is ALWAYS shown (cannot be disabled)
Higher timeframes respect user toggle settings
Max higher TFs setting limits how many higher TFs are displayed (default 3)
Example on 1h chart: 15m hidden, 1h always shown, 4h/D/W/M per user settings (max 3)
LEVEL MERGING:
Nearby levels of the same type AND same timeframe are automatically merged.
The newer pivot always wins, replacing older levels within the tolerance range.
Tolerance = TF ATR × Merge Tolerance setting (default 0.5 ATR).
VISUALIZATION:
Each timeframe has its own color and line width for easy distinction:
15m - Cyan, width 1
1h - Blue, width 1
4h - Orange/Gold, width 2
Daily - Green, width 2
Weekly - Purple, width 3
Monthly - Red, width 4
Active levels show as solid lines, mitigated levels as dashed lines with transparency.
Price scale shows level prices with their respective colors.
RETEST DETECTION (Current TF Only):
Detects when price tests a S/R level and bounces back. Two patterns are recognized:
Pattern 1: Single candle with long wick touching level and body moving away
Pattern 2: Previous candle touches level, current candle is reaction candle
Parameters:
ATR Tolerance - How close price must be to level (default 0.15 ATR)
Min Wick % - Minimum wick size to confirm rejection (default 30%)
ALERT SYSTEM (Current TF Only):
All alerts trigger only for levels of the current chart timeframe:
New Pivot (any/Support/Resistance) - when new pivot is detected
Breakout (any/Support/Resistance) - when level is broken with coherent candle
Significant Breakout (any/Support/Resistance) - high-quality breakouts
Retest (any/Support/Resistance) - when level is retested with bounce
SIGNIFICANT BREAKOUT CRITERIA:
A breakout is considered "significant" when:
Candle direction is coherent (bearish for support, bullish for resistance)
At least X% of the candle body crosses the level (configurable, default 50%)
Opposite wick is limited to Y% of candle range (configurable, default 30%)
SETTINGS OVERVIEW:
Global Settings - Max levels per TF, max higher TFs, pivot bars, merge tolerance
Mitigation Settings - Visibility duration, transparency
Visual Settings - Circles, labels, price scale
Timeframe Configuration - Enable/disable, color, line width for each TF
Significant Breakout - Min body cross %, max opposite wick %
Retest Detection - ATR tolerance, min wick %
Debug - Show pivot detection markers

AlgoZ Smart Divergence [Trend Filtered]AlgoZ Smart Divergence is a precision entry tool designed to catch market reversals by analyzing Volume Divergence combined with Multi-Timeframe Trend Filtering. Unlike standard divergence indicators that signal on every minor price fluctuation, this script uses a strict set of filters to only present high-probability trade setups that align with the broader market trend.
This is the Free Edition of the AlgoZ Suite, focused on providing clean, non-repainting Buy and Sell signals based on institutional volume flow.
How It Works The script operates on a 3-step validation process:
Volume Divergence:
It detects anomalies where volume spikes relative to price action (e.g., Price makes a Lower Low, but Volume hits a Higher High).
HTF Trend Painting:
It analyzes a Higher Timeframe (Default: 3 Hours) to determine the macro trend. If the 3H trend is Bullish, the candles turn Green. If Bearish, they turn Red.
Color Match Filtering:
The script includes a smart filter that blocks signals that go against the trend. You will only see BUY signals when the candles are Green (Uptrend) and SELL signals when the candles are Red (Downtrend).
Key Features
Volume Divergence Engine:
Identifies hidden accumulation and distribution zones.
HTF Trend Coloring:
Automatically paints your chart based on Higher Timeframe breakouts (Default: 3-Hour Trend).
Smart Signal Filtering:
Toggles are available to "Only Show Signals Matching Candle Color," ensuring you never trade against the momentum.
EMA Trend Filter:
Includes a built-in 10-period EMA filter to further refine entries.
Volatility Filters:
Optional RSI and ADX filters are included to avoid trading during low-volatility "chop."
How to Use
For Longs (Buys):
Wait for the candles to turn Green (indicating the 3-Hour trend is up) and look for a BUY label. The price must also be above the 10 EMA (if enabled).
For Shorts (Sells):
Wait for the candles to turn Red (indicating the 3-Hour trend is down) and look for a SELL label.
Risk Management:
This script is designed to catch reversals. Always place your Stop Loss below the recent swing low (for buys) or above the swing high (for sells).
Settings
Higher Timeframe:
Default is set to 3 Hours (180 minutes). You can adjust this to 1 Day or 4 Hours depending on your trading style.
EMA Length:
Default is 10.
Color Match Filter:
On by default.

Trendlines & SR ZonesIt's a comprehensive indicator (Pine Script v6) that represents two powerful technical analysis tools: automatic trendline detection based on pivot points and volume delta analysis with support/resistance zone identification. This overlay indicator helps traders identify potential trend directions and key price levels where significant buying or selling pressure has occurred.
Features: =
1. Price Trendlines
The indicator automatically identifies and draws trendlines based on pivot points, creating dynamic support and resistance levels.
Key Components:
Pivot Detection: Uses configurable left and right bars to identify significant pivot highs and lows
Trendline Filtering: Only draws downward-sloping resistance trendlines and upward-sloping support trendlines
Zone Creation: Creates filled zones around trendlines based on average price volatility
Automatic Management: Maintains only the 3 most recent significant trendlines to avoid chart clutter
Customization Options:
Left/Right Bars for Pivot: Adjust sensitivity of pivot detection (default: 10 bars each side)
Extension Length: Control how far trendlines extend past the second pivot (default: 50 bars)
Average Body Periods: Set the lookback period for volatility calculation (default: 100)
Tolerance Multiplier: Adjust the width of the trendline zones (default: 1.0)
Color Customization: Separate colors for high (resistance) and low (support) trendlines and their fills
2. Volume Delta % Bars
The indicator analyzes volume distribution across price levels to identify significant supply and demand zones.
Key Components:
Volume Profile Analysis: Divides the price range into rows and calculates volume delta at each level
Delta Visualization: Displays horizontal bars showing the percentage difference between buying and selling volume
Zone Identification: Automatically identifies the most significant supply and demand zones
Visual Integration: Connects volume delta bars with corresponding support/resistance zones on the price chart
Customization Options:
Lookback Period: Set the number of bars to analyze for volume (default: 200)
Price Rows: Control the granularity of the volume analysis (default: 50 rows)
Delta Sections: Adjust the number of horizontal delta bars displayed (default: 20)
Panel Appearance: Customize width, position, and direction of the delta panel
Zone Settings: Control the number of supply/demand zones and their extension (default: 3 zones)
How It Works-
Trendline Logic:
The script continuously scans for pivot highs and lows based on the specified left and right bars
When a pivot is detected, it creates a horizontal line at that price level
The script then looks for the previous pivot of the same type (high or low)
It connects these pivots with a trendline, extending it based on the user-specified setting
A parallel line is created to form a zone, with the distance based on average price volatility
The script filters out invalid trendlines (upward-sloping resistance and downward-sloping support). Only the 3 most recent trendlines are maintained to prevent chart clutter
Volume Delta Logic:
The script divides the price range over the lookback period into the specified number of rows
For each bar in the lookback period, it categorizes volume as bullish (close > open) or bearish (close < open). This volume is assigned to the appropriate price level based on the HLC3 price.
The price levels are grouped into sections, and the net delta (bullish - bearish volume) is calculated for each Horizontal bars are drawn to represent these delta percentages.
The most significant positive and negative deltas are identified and displayed as support and resistance zones. These zones are extended to the left on the price chart and connected to the delta panel with dotted lines.
Ideal Timeframes:
The indicator is versatile and can be used across multiple timeframes, but it performs optimally on specific timeframes depending on your trading style:
For Day Trading:
Optimal Timeframes: 15-minute to 1-hour charts
Why: These timeframes provide a good balance between noise reduction and sufficient volume data. The volume delta analysis is particularly effective on these timeframes as it captures intraday accumulation/distribution patterns while the trendlines remain reliable enough for intraday trading decisions.
For Swing Trading:
Optimal Timeframes: 1-hour to 4-hour charts
Why: These timeframes offer the best combination of reliable trendline formation and meaningful volume analysis. The trendlines on these timeframes are less prone to whipsaws, while the volume delta analysis captures multi-day trading sessions and institutional activity.
For Position Trading:
Optimal Timeframes: Daily and weekly charts
Why: On these higher timeframes, trendlines become extremely reliable as they represent significant market structure points. The volume delta analysis reveals longer-term accumulation and distribution patterns that can define major support and resistance zones for weeks or months.
Timeframe-Specific Adjustments:
Lower Timeframes (1-15 minutes):
Reduce left/right bars for pivots (5-8 bars)
Decrease lookback period for volume delta (50-100 bars)
Increase tolerance multiplier (1.2-1.5) to account for higher volatility
Higher Timeframes (Daily+):
Increase left/right bars for pivots (15-20 bars)
Extend lookback period for volume delta (300-500 bars)
Consider increasing the number of price rows (70-100) for more detailed volume analysis
Usage Guidelines-
For Trendline Analysis:
Use the trendlines as dynamic support and resistance levels
Price reactions at these levels can indicate potential trend continuation or reversal points
The filled zones around trendlines represent areas of price volatility or uncertainty
Consider the slope of the trendline as an indication of trend strength
For Volume Delta Analysis:
The horizontal delta bars show where buying or selling pressure has been concentrated
Green bars indicate areas where buying volume exceeded selling volume (demand)
Red bars indicate areas where selling volume exceeded buying volume (supply)
The highlighted supply and demand zones on the price chart represent significant price levels
These zones can act as future support or resistance areas as price revisits them
Customization Tips:
Trendline Sensitivity: Decrease left/right bars values to detect more pivots (more sensitive) or increase them for fewer, more significant pivots
Zone Width: Adjust the tolerance multiplier to make trendline zones wider or narrower based on your trading style
Volume Analysis: Increase the lookback period for a longer-term volume profile or decrease it for more recent activity
Visual Clarity: Adjust colors and transparency settings to match your chart theme and preferences
Conclusion:
This indicator provides traders with a comprehensive view of both trend dynamics and volume-based support/resistance levels. With these two analytical approaches, the indicator offers valuable insights for identifying potential entry and exit points, trend strength, and key price levels where significant market activity has occurred. The extensive customization options allow traders to adapt the indicator to various trading styles and timeframes, with optimal performance on 15-minute to daily charts depending on their trading horizon.
Chart Attached: NSE HINDZINC, EoD 12/12/25
DISCLAIMER: This information is provided for educational purposes only and should not be considered financial, investment, or trading advice. Please do boost if you like it. Happy Trading.

Zaka Pro: Clear Structure (HH/LL) + MSS ZonesCertainly! Here is a description of the Pine Script indicator you provided, focusing on its main functions and trading strategy, written in English.
---
## Zaka Pro: Clear Structure (HH/LL) + MSS Zones
This is a technical analysis indicator developed in Pine Script (`//@version=5`) designed to automatically identify and plot key price action structural elements based on the **Zig Zag** method, while incorporating a simplified **Market Structure Shift (MSS)** concept, often used in Smart Money Concepts (SMC) or Wyckoff trading.
### Key Features:
1. **Pivot-Based Structure Identification:**
* The indicator uses the standard **`ta.pivothigh`** and **`ta.pivotlow`** functions, determined by the user-defined `Pivot Length` (`prd`). This forms the foundation of the price "swing" structure.
2. **Structural Labeling (HH/LL/LH/HL):**
* It automatically labels the resulting swing points to clearly show the prevailing trend:
* **HH (Higher High):** Continuation of an uptrend.
* **LL (Lower Low):** Continuation of a downtrend.
* **LH (Lower High):** A potential reversal or weakening of an uptrend.
* **HL (Higher Low):** A potential reversal or weakening of a downtrend.
3. **Zig Zag Plotting:**
* The indicator connects the identified pivot points with a **gray line** to visually represent the market swings.
4. **Market Structure Shift (MSS) Strategy:**
* The core strategy detects a potential **trend reversal** when the price breaks the most recent structural pivot:
* **Buy MSS Trigger:** Detected when the price breaks **above the last High** (`last_high`) while the market was in a confirmed **downtrend** (forming Lower Lows).
* **Sell MSS Trigger:** Detected when the price breaks **below the last Low** (`last_low`) while the market was in a confirmed **uptrend** (forming Higher Highs).
5. **Order Block / Entry Zone Plotting:**
* Upon detection of a confirmed MSS (reversal), the indicator plots a colored **Box** representing a potential re-entry zone:
* **BUY ZONE (Green Box):** Plotted after a Buy MSS (breakout to the upside). The zone is defined by the **High and Low of the two candles preceding the last swing Low** (`ob_low_top`, `ob_low_btm`). This acts as a simplified "Order Block" for potential long entries.
* **SELL ZONE (Red Box):** Plotted after a Sell MSS (breakout to the downside). The zone is defined by the **High and Low of the two candles preceding the last swing High** (`ob_high_top`, `ob_high_btm`). This acts as a simplified "Order Block" for potential short entries.
6. **Alerts:**
* Custom alerts are included to notify the user immediately when a Buy or Sell MSS (Market Structure Shift) is detected.
In summary, the indicator is a visual tool that simplifies price action analysis by drawing structure and highlights potential reversal points (MSS) by painting corresponding re-entry zones (Order Blocks) on the chart.

USOIL BOS Retest Overlay (HTF + Blocks + Profit Zone + Lot Size)This is a test overlay that should show entry positions and lot sizes to take based on R20 000 account. This was made purely for USOIL

TRI - Multi-Timeframe Support and ResistanceTRI - MULTI-TIMEFRAME SUPPORT & RESISTANCE v3.0.0
DESCRIPTION:
Advanced multi-timeframe Support & Resistance indicator using ta.pivothigh/ta.pivotlow
to display pivot-based S/R levels from higher timeframes on your current chart.
Features smart pivot positioning, dynamic level merging, and comprehensive alert system.
KEY FEATURES:
Multi-timeframe pivot detection using ta.pivothigh/ta.pivotlow on candle body
Smart pivot positioning - pivots are placed on the correct candle type (bullish for highs, bearish for lows)
Automatic timeframe selection - configure different S/R timeframes for each chart timeframe
Dynamic level merging - nearby levels are merged based on ATR tolerance (newer wins)
Mitigated level tracking - shows recently broken levels with distinct styling
Smart visualization - always shows N closest levels above and below current price
Comprehensive alert system with 9 different alert types
Significant breakout detection with configurable parameters
Memory efficient - automatic cleanup of expired levels
HOW IT WORKS:
The indicator uses ta.pivothigh() and ta.pivotlow() on the selected higher timeframe.
Pivot highs are positioned on bullish candles (using close price).
Pivot lows are positioned on bearish candles (using close price).
If the pivot candle is not the correct type, it searches back up to 5 candles.
Only unbreached levels are displayed as active support/resistance.
When a level is breached, it becomes a "mitigated level" with distinct styling.
Mitigation is checked only after the first candle following the pivot (to avoid false triggers).
LEVEL MERGING:
Nearby levels of the same type are automatically merged based on ATR tolerance.
The newer pivot always wins, replacing older levels within the tolerance range.
Tolerance = HTF ATR × Merge Tolerance setting (default 0.5 ATR).
VISUALIZATION:
The indicator always displays the N closest levels above and below the current price.
Levels are sorted by distance, ensuring the most relevant S/R are always visible.
Active levels show as solid lines, mitigated levels as dashed lines.
ALERT SYSTEM:
Breakout (any level) - triggers when any level is broken with coherent candle
Breakout Support - triggers when a support level is broken by bearish candle
Breakout Resistance - triggers when a resistance level is broken by bullish candle
New Pivot (any) - triggers when a new pivot is detected
New Pivot Support - triggers when a new support pivot is detected
New Pivot Resistance - triggers when a new resistance pivot is detected
Significant Breakout (any) - triggers on high-quality breakouts
Significant Breakout Support - high-quality support breakout
Significant Breakout Resistance - high-quality resistance breakout
SIGNIFICANT BREAKOUT CRITERIA:
A breakout is considered "significant" when:
Candle direction is coherent (bearish for support, bullish for resistance)
At least X% of the candle body crosses the level (configurable, default 50%)
Opposite wick is limited to Y% of candle range (configurable, default 30%)
Example: For a bearish candle breaking support, the upper wick must be small.
TIMEFRAME CONFIGURATION:
Configure different S/R timeframes based on current chart timeframe:
1m-5m charts → Default 4h S/R
15m charts → Default 4h S/R
30m-1h charts → Default 4h S/R
4h charts → Default 4h S/R
Daily charts → Default Daily S/R
Weekly charts → Default Weekly S/R
Monthly charts → Default Monthly S/R
All timeframes are configurable via input settings.
SETTINGS OVERVIEW:
Timeframe Configuration - Set S/R timeframe for each chart timeframe
Pivot Detection - Max levels, left/right bars, merge tolerance, level extension
Mitigation Settings - How long mitigated levels remain visible
Visual Settings - Colors, line width, price scale display
Significant Breakout - Min body cross %, max opposite wick %
Debug - Show pivot detection markers

Jurik Angle Flow [Kodexius]Jurik Angle Flow is a Jurik based momentum and trend strength oscillator that converts Jurik Moving Average behavior into an intuitive angle based flow gauge. Instead of showing a simple moving average line, this tool measures the angular slope of a smoothed Jurik curve, normalizes it and presents it as a bounded oscillator between plus ninety and minus ninety degrees.
The script uses two Jurik engines with different responsiveness, then blends their information into a single power score that drives both the oscillator display and the on chart gauge. This makes it suitable for identifying trend direction, trend strength, exhaustion conditions and early shifts in market structure. Built in divergence detection between price and the Jurik angle slope helps highlight potential reversal zones while bar coloring and a configurable no trade zone assist with visual filtering of choppy conditions.
🔹 Features
🔸 Dual Jurik slope engine
The indicator internally runs two Jurik Moving Average calculations on the selected source price. A slower Jurik stream models the primary trend while a faster Jurik stream reacts more quickly to recent changes. Their slopes are measured as angles in degrees, scaled by Average True Range so that the slope is comparable across different instruments and timeframes.
🔸 Angle based oscillator output
Both Jurik streams are converted into angle values by comparing the current value to a lookback value and normalizing by ATR. The result is passed through the arctangent function and expressed in degrees. This creates a smooth oscillator that directly represents steepness and direction of the Jurik curve instead of raw price distance.
🔸 Normalized power score
The angle values are transformed into a normalized score between zero and one hundred based on their absolute magnitude, then the sign of the angle is reapplied. This yields a symmetric score where extreme positive values represent strong bullish pressure and extreme negative values represent strong bearish pressure. The final power score is a weighted blend of the slow and fast Jurik scores.
🔸 Adaptive color gradients
The main oscillator area and the fast slope line use gradient colors that react to the angle strength and direction. Rising green tones reflect bullish angular momentum while red tones reflect bearish pressure. Neutral or shallow slopes remain visually softer to indicate indecision or consolidation.
🔸 Trend flip markers
Whenever the primary Jurik slope crosses through zero from negative to positive, an up marker is printed at the bottom of the oscillator panel. Whenever it crosses from positive to negative, a down marker is drawn at the top. These flips act as clean visual signals of potential trend initiation or termination.
🔸 Divergence detection on Jurik slope
The script optionally scans the fast Jurik slope for pivot highs and lows. It then compares those oscillator pivots against corresponding price pivots.
Regular bullish divergence is detected when the oscillator prints a higher low while price prints a lower low.
Regular bearish divergence is detected when the oscillator prints a lower high while price prints a higher high.
When detected, the tool draws matching divergence lines both on the oscillator and on the chart itself, making divergence zones easy to notice at a glance.
🔸 Bar coloring and no trade filter
Bars can be colored according to the primary Jurik slope gradient so that price bars reflect the same directional information as the oscillator. Additionally a configurable no trade threshold can visually mute bars when the absolute angle is small. This highlights trending sequences and visually suppresses noisy sideways stretches.
🔸 On chart power gauge
A creative on chart gauge displays the composite power score beside the current price action. It shows a vertical range from plus ninety to minus ninety with a filled block that grows proportionally to the normalized score. Color and label updates occur in real time and provide a quick visual summary of current Jurik flow strength without needing to read exact oscillator levels.
🔹 Calculations
Below are the main calculation blocks that drive the core logic of Jurik Angle Flow.
Jurik core update
method update(JMA self, float _src) =>
self.src := _src
float phaseRatio = self.phase < -100 ? 0.5 : self.phase > 100 ? 2.5 : self.phase / 100.0 + 1.5
float beta = 0.45 * (self.length - 1) / (0.45 * (self.length - 1) + 2)
float alpha = math.pow(beta, self.power)
if na(self.e0)
self.e0 := _src
self.e1 := 0.0
self.e2 := 0.0
self.jma := 0.0
self.e0 := (1 - alpha) * _src + alpha * self.e0
self.e1 := (_src - self.e0) * (1 - beta) + beta * self.e1
float prevJma = self.jma
self.e2 := (self.e0 + phaseRatio * self.e1 - prevJma) * math.pow(1 - alpha, 2) + math.pow(alpha, 2) * self.e2
self.jma := self.e2 + prevJma
self.jma
This method implements the Jurik Moving Average engine with internal state and phase control, producing a smooth adaptive value stored in self.jma.
Angle calculation in degrees
method getAngle(float src, int lookback=1) =>
float rad2degree = 180 / math.pi
float slope = (src - src ) / ta.atr(14)
float ang = rad2degree * math.atan(slope)
ang
The slope between the current value and a lookback value is divided by ATR, then converted from radians to degrees through the arctangent. This creates a volatility normalized angle oscillator.
Normalized score from angle
method normScore(float ang) =>
float s = math.abs(ang)
float p = s / 60.0 * 100.0
if p > 100
p := 100
p
The absolute angle is scaled so that sixty degrees corresponds to a score of one hundred. Values above that are capped, which keeps the final score within a fixed range. The sign is later reapplied to restore direction.
Slow and fast Jurik streams and power score
var JMA jmaSlow = JMA.new(jmaLen, jmaPhase, jmaPower, na, na, na, na, na)
var JMA jmaFast = JMA.new(jmaLen, jmaPhase, 2.0, na, na, na, na, na)
float jmaValue = jmaSlow.update(src)
float jmaFastValue = jmaFast.update(src)
float jmaSlope = jmaValue.getAngle()
float jmaFastSlope = jmaFastValue.getAngle()
float scoreJma = normScore(jmaSlope) * math.sign(jmaSlope)
float scoreJmaFast = normScore(jmaFastSlope) * math.sign(jmaFastSlope)
float totalScore = (scoreJma * 0.6 + scoreJmaFast * 0.4)
A slower Jurik and a faster Jurik are updated on each bar, each converted to an angle and then to a signed normalized score. The final composite power score is a weighted blend of the slow and fast scores, where the slow score has slightly more influence. This composite drives the on chart gauge and summarizes the overall Jurik flow.

MoneyLine CipherMoneyLine Cipher
Overview
MoneyLine Cipher is a trend-following indicator designed to identify high-probability entry and exit points by combining multiple technical analysis methods into a unified signal system. The indicator adapts its behavior based on current market conditions, becoming more aggressive in strong trends and more conservative in choppy or uncertain markets.
Core Concept: The Money Line
At the heart of this indicator is the Money Line, a linear regression line that acts as a dynamic center of price action. Unlike a simple moving average, linear regression fits a straight line through recent prices using least-squares methodology, providing a smoother representation of the underlying trend direction. The slope of this line determines whether the market is in a bullish, bearish, or neutral state.
Dynamic Envelope Bands
The indicator plots upper and lower bands around the Money Line using Average True Range (ATR) as the volatility measure. What makes these bands unique is their adaptive multiplier system. When the ADX (Average Directional Index) indicates a strong trend, the bands automatically widen to accommodate larger price swings and avoid premature exits. In ranging or weak trend conditions, the bands contract to provide tighter entry and exit zones. This dynamic adjustment helps the indicator perform consistently across different market environments.
Trend State Detection
The indicator classifies market conditions into five distinct states: Strong Uptrend, Uptrend, Neutral, Downtrend, and Strong Downtrend. This classification uses three complementary methods working together.
First, the Directional Movement Index (DMI) measures the spread between positive and negative directional indicators. A large positive spread suggests bullish momentum, while a large negative spread indicates bearish pressure.
Second, On-Balance Volume (OBV) confirms whether volume supports the indicated trend direction. For a Strong Uptrend classification, OBV must be rising above its moving average, confirming that buying pressure backs the price movement.
Third, ADX must exceed a minimum threshold for Strong trend classifications, ensuring that only genuinely trending markets receive the Strong designation.
Signal Generation
Buy and sell signals are generated using Fisher Transform and Aroon indicators, but with a crucial enhancement: the trigger thresholds adjust dynamically based on the current trend state.
The Fisher Transform converts price data into a Gaussian normal distribution, making turning points easier to identify. In a Strong Uptrend, the buy threshold relaxes (making buys easier to trigger) while the sell threshold tightens (making sells harder to trigger). This allows traders to stay in winning positions longer during favorable conditions. The opposite applies in downtrends, where the system becomes quick to exit and reluctant to enter long positions.
The Aroon indicator measures how recently price made a new high or low within the lookback period. Combined with Fisher Transform, this dual-confirmation approach reduces false signals that might occur when using either indicator alone.
Band touches also generate signals. When price reaches the lower band, a potential buy zone is identified. When price reaches the upper band, a potential sell zone is flagged.
Cascade Protection System
A key feature is the built-in protection against averaging down into a losing position. The system tracks consecutive buy signals and limits them to a configurable maximum (default: 3). After reaching this limit, no additional buy signals are generated until a sell signal resets the counter. This prevents the common mistake of repeatedly buying during a sustained decline.
Additionally, the indicator monitors Bollinger Band Width Percentile (BBWP), which measures current volatility relative to historical volatility. When BBWP exceeds a threshold (indicating a volatility spike often associated with sharp moves), buy signals are temporarily frozen. This protects against entering during panic selloffs or blow-off tops.
Extreme Move Detection
Sometimes price moves so aggressively that it penetrates the bands by an unusual amount. The indicator detects these extreme moves and can generate signals even during normal cooldown periods. The logic is that an extreme band penetration represents a significant overextension that warrants attention regardless of recent signal history. These extreme signals are visually distinguished from regular signals.
RSI Divergence
The indicator includes RSI divergence detection as an additional confirmation tool. When price makes a lower low but RSI makes a higher low (bullish divergence), it suggests weakening downside momentum and a potential reversal. Bearish divergence (price higher high, RSI lower high) warns of potential tops. Both regular and hidden divergences are detected and marked on the chart.
Signal Cooldown
To prevent overtrading and signal clustering, a configurable cooldown period prevents new signals for a set number of bars after each signal. This spacing ensures that each signal represents a distinct trading opportunity rather than repeated triggers on the same price movement.
Visual Display
The indicator provides a comprehensive information panel showing current trend state, BBWP status, consecutive buy count, ADX reading, Fisher and Aroon values, cooldown status, and current dynamic thresholds. An ADX bar at the bottom of the chart provides quick visual reference for trend strength and direction using color coding.
Signal labels display the entry or exit price along with the current buy count (for buy signals), helping traders track their position sizing.
How to Use
In uptrending markets, look for buy signals near the lower band, particularly when the trend state shows Uptrend or Strong Uptrend. These represent pullback opportunities within an established trend.
In downtrending markets, the indicator naturally reduces buy signals and increases sell sensitivity, helping traders avoid catching falling knives.
In neutral or ranging conditions, signals from both directions are generated with moderate thresholds, suitable for mean-reversion trading within the bands.
Monitor the BBWP and consecutive buy counter in the info panel. If BBWP shows "FROZEN" or the buy counter approaches the maximum, exercise additional caution with new long entries.
Settings Guidance
The default settings are optimized for 5-minute cryptocurrency charts but can be adjusted for other timeframes and assets. Key parameters to consider adjusting include the Money Line length (shorter for more responsive, longer for smoother), ATR multiplier range (wider bands reduce signals but improve accuracy), and the various threshold values for trend classification.

Regime EngineRegime Engine
Overview
Regime Engine is a market regime detection system that classifies price action into bullish, bearish, or neutral states using weighted exponential moving average analysis. Once the regime is identified, the indicator generates buy and sell signals based on Donchian channel breakouts, filtered by ADX trend strength and RSI momentum conditions.
The Money Line
The core of regime detection is the Money Line, a weighted combination of two exponential moving averages. By default, the short EMA (8 periods) receives 60% weight while the long EMA (24 periods) receives 40% weight. This weighting allows the Money Line to be more responsive than a simple long-period average while remaining smoother than a short-period average alone.
The Money Line changes color based on the current regime: green for bullish, red for bearish, and yellow for neutral. This provides immediate visual feedback about the market state.
Regime Classification
The indicator determines market regime by comparing the relative positions of the short and long EMAs while also considering RSI levels to avoid classifying overbought or oversold conditions as trend states.
Bullish regime is identified when the short EMA is above the long EMA and RSI is not in overbought territory. This combination suggests upward momentum that is not yet exhausted.
Bearish regime is identified when the short EMA is below the long EMA and RSI is not in oversold territory. This indicates downward momentum with room to continue.
Neutral regime applies when the EMAs are close together or RSI conditions prevent trend classification. The indicator provides two optional methods for enhanced neutral detection.
Neutral Zone Detection
Markets often transition through periods where trend direction is unclear. The indicator offers two complementary methods for detecting these neutral zones.
The slope method examines the rate of change of the Money Line relative to ATR. When the Money Line is moving slowly (slope below a tolerance threshold), the market is classified as neutral regardless of EMA positioning.
The EMA distance method calculates the percentage distance between the short and long EMAs. When they are within a specified percentage of each other, the EMAs are considered too close to reliably indicate direction.
Either or both methods can be enabled, and if either triggers, the regime is classified as neutral.
Donchian Channel Signals
Buy and sell signals are generated when price interacts with the Donchian channel boundaries. The Donchian channel plots the highest high and lowest low over a lookback period (default 20 bars), offset by one bar to prevent repainting.
Buy signals trigger when price touches or breaks below the lower Donchian band, indicating a potential support level. Sell signals trigger when price touches or breaks above the upper Donchian band, indicating potential resistance.
An optional setting requires the close to confirm the break rather than just the wick, providing more conservative signal generation.
ADX Trend Strength Filter
The Average Directional Index filters signals to ensure they occur during trending conditions. When enabled, signals only fire if ADX exceeds the threshold (default 24), confirming that the market has sufficient directional momentum for breakout trades to succeed.
The indicator uses Wilder's original smoothing method for ADX calculation, providing the traditional interpretation of trend strength values.
RSI Momentum Filter
RSI provides additional signal filtering to ensure entries occur at favorable momentum levels. Buy signals require RSI to be at or below the oversold threshold (default 30), indicating potential exhaustion of selling pressure. Sell signals require RSI to be at or above the overbought threshold (default 70), suggesting exhaustion of buying pressure.
These filters can be disabled for traders who prefer unfiltered Donchian breakout signals.
BBWP Volatility Monitoring
Bollinger Band Width Percentile measures current volatility relative to its historical range. The indicator calculates BB width and ranks it against the specified lookback period (default 252 bars, approximately one trading year).
BBWP above 70% indicates elevated volatility, which may signal trend acceleration or potential reversals. BBWP below 30% indicates compressed volatility, often preceding significant moves. The information panel displays the current BBWP reading with color coding to highlight these conditions.
Signal Cooldown
To prevent signal clustering during extended breakout periods, a configurable cooldown prevents new signals of the same type for a specified number of bars after each signal. This ensures each signal represents a distinct trading opportunity.
Visual Components
The Donchian channel can display shaded bands between the upper and lower boundaries. The shading color reflects the current regime: green for bullish, magenta for bearish, and blue for neutral. This provides at-a-glance context for where price is trading within its recent range.
An ADX strength bar at the bottom of the chart uses color coding: white for weak trend (ADX below 15), orange for ranging (ADX 15-24), and blue for trending (ADX above 24). This matches the trend strength display in the information panel.
Price labels appear at signal locations showing the signal type and entry price. Labels are automatically cleaned up after reaching a configurable history limit to maintain chart performance.
Signal candles are highlighted in blue, making it easy to identify exactly which bars generated signals when reviewing historical performance.
Information Panel
A compact table displays key metrics: current regime bias, trend strength classification, BBWP volatility reading, RSI level, and ADX value. Each metric is color-coded to highlight favorable or unfavorable conditions.
The panel can be positioned at any corner or middle edge of the chart. An alternative label-based display anchored to the chart is also available for those who prefer that format.
Trend Persistence Option
By default, the regime is recalculated on every bar. An optional persistence mode changes this behavior so that the regime only changes on EMA crossovers. This reduces regime flipping during choppy conditions but may delay regime recognition during gradual trend changes.
How to Use
Monitor the Money Line color and information panel for current regime. In bullish regimes, focus on buy signals at the lower Donchian band as potential pullback entries. In bearish regimes, focus on sell signals at the upper band as potential short entries or exit points.
Use the ADX strength indicator to gauge signal reliability. Signals during trending conditions (blue ADX bar) have historically higher success rates than signals during ranging conditions (orange bar) or weak trends (white bar).
Watch BBWP for volatility context. Low BBWP readings suggest a significant move may be developing, while high readings indicate the current move may be overextended.
The combination of regime awareness, Donchian breakout signals, and ADX/RSI filtering provides a structured approach to identifying trading opportunities across different market conditions.
Settings Guidance
The default settings work well for cryptocurrency and forex markets on intraday timeframes. For stocks or longer timeframes, consider increasing the EMA periods and Donchian lookback. The ADX threshold can be adjusted based on the typical ADX range for the traded instrument.
The RSI filter levels can be relaxed (higher oversold, lower overbought) for more signals or tightened for higher-quality but less frequent signals. The cooldown period should be adjusted based on timeframe, with shorter timeframes typically requiring longer cooldown periods.

FxAST Trend Force [ALLDYN]Attribution
This indicator is based on the original Trend Speed Analyzer created by Zeiierman .
FxAST Trend Force is a modified and simplified derivative that preserves the core methodology while focusing on clarity, usability, and practical trend interpretation .
This indicator is intended for educational and analytical use. Derivative works must retain attribution and license terms.
__________________________________________________________________________________
FxAST Trend Force
Overview
FxAST Trend Force is a directional pressure indicator designed to show who is in control of the market and how strong that control is, in real time.
Instead of measuring raw price speed or traditional momentum, this tool focuses on trend force — the sustained push of price relative to a dynamic trend baseline. The result is a clean, intuitive view of trend direction, strength, and condition without complex math or hard-to-interpret ratios.
This indicator is best used as a trend confirmation and trade management tool , not a standalone signal generator.
_________________________________________________________________________________
How It Works
FxAST Trend Force uses a Dynamic Moving Average (DMA) that adapts to changing market conditions. Price behavior relative to this adaptive trend line determines the current trend regime.
While price remains on one side of the trend:
Directional pressure accumulates
Strength builds or weakens
The regime resets only when price decisively crosses the trend
This creates a clear visual representation of trend persistence vs exhaustion , rather than short-term noise.
__________________________________________________________________________________
Core Concepts (Plain English)
Trend
Shows the current directional bias:
Bull → price above the dynamic trend
Bear → price below the dynamic trend
This answers: “Which side is currently in control?”
__________________________________________________________________________________
Strength
Displays how strong the current trend pressure is on a 0–100 scale , normalized to recent market conditions.
Strength is shown both as:
A simple label: Weak / Normal / Strong
A visual meter for quick interpretation
This answers: “Is this move weak, average, or meaningful?”
__________________________________________________________________________________
State
Indicates whether trend force is:
Building → pressure increasing
Fading → pressure weakening
This answers: “Is the trend gaining energy or losing it?”
__________________________________________________________________________________
Visual Meter
A compact bar at the bottom of the table represents trend force intensity at a glance.
Longer bar → stronger sustained pressure
Shorter bar → weaker or stalling trend
No ratios. No multipliers. Just visual clarity.
__________________________________________________________________________________
How to Use
Trend Confirmation
Favor longs when Trend = Bull and Strength = Normal/Strong
Favor shorts when Trend = Bear and Strength = Normal/Strong
__________________________________________________________________________________
Trade Management
Building state supports continuation
Fading state warns of exhaustion, consolidation, or potential reversal
__________________________________________________________________________________
Filtering Noise
Weak strength often signals chop or low-quality conditions
Strong force helps filter false breakouts
__________________________________________________________________________________
Settings (Simplified)
Maximum Length
Controls how smooth or responsive the dynamic trend is.
Accelerator Multiplier
Adjusts how quickly the trend adapts to price changes.
Lookback Period
Defines the window used to normalize trend force.
Enable Candles
Colors price candles by trend force for visual clarity.
Show Simple Table
Toggles the Trend / Strength / State display.
__________________________________________________________________________________
Philosophy
FxAST Trend Force is intentionally not a signal-spamming indicator.
It is designed to reduce cognitive load , not increase it.
If you need:
exact entries → use price action
exact exits → use structure
context and confirmation → use Trend Force
__________________________________________________________________________________
Disclaimer
This indicator is provided for educational purposes only and does not constitute financial advice. Trading involves risk, and users are responsible for their own decisions.

NeoChartLabs POCOne of our Favorite Indicators - the High Time Frame Point of Control with a Volume Profile.
Shout out to p2pasta for the original script, we updated to v6.
Currently included: Monthly, 3 months and 6 months.
/* DEFINITION */
Point Of Control (= POC) is a price level at which the heaviest volumes were traded.
Value Area High/Low (=VAH/VAL) is a range of prices where the majority of trading volume took place. Naturally, Value Area High being the top price level and Value Area Low being the lowest. POC always is between the two.
/* HOW TO TRADE WITH THIS INDICATOR */
The basis for POC is determining bias on whichever timeframe you choose.
1. Identify a POC on the timeframe of your choosing.
/* If you choose a "low" timeframe (monthly here) then make sure to look at the higher timeframes to see how it is playing against a higher timeframe POC.
2. When the price is moving away from the POC (either to the upside or downside) this will confirm or invalidate the trade.
3. You can now enter the trade on bias or wait for a retest of the same POC.


Neural Fusion ProNeural Fusion Pro
Overview
Neural Fusion Pro is a multi-factor scoring system that combines numerous technical analysis methods into a single unified score. Rather than requiring traders to monitor multiple indicators separately, this system synthesizes trend strength, momentum oscillators, volume confirmation, price structure, and price action quality into one composite reading that adapts to current market conditions.
The Scoring System
At the heart of this indicator is a weighted scoring algorithm that produces a value between -1.0 and +1.0. Positive scores indicate bullish conditions across the measured factors, while negative scores suggest bearish conditions. The magnitude of the score reflects the strength of conviction across indicators.
The score is calculated from five distinct components, each capturing a different aspect of market behavior. Users can adjust the weight given to each component based on their trading style and market preferences.
Component 1: Trend Strength and Direction
This component uses the Average Directional Index to measure trend strength and the Directional Movement indicators to determine trend direction. When ADX exceeds the trending threshold, indicating a directional market, the component contributes a positive score if the positive directional indicator leads, or a negative score if the negative directional indicator leads. In ranging markets where ADX is low, this component contributes minimally to avoid false trend signals.
Component 2: Multi-Factor Momentum
Rather than relying on a single oscillator, this component synthesizes readings from RSI, MACD histogram, Stochastic, CCI, and Rate of Change. Each oscillator is normalized to a common scale and weighted according to its reliability characteristics. RSI readings are compared against dynamic thresholds that adjust based on trend state, making the indicator more forgiving in uptrends and more demanding in downtrends.
The component also includes divergence detection. When price makes a higher high but RSI makes a lower high (bearish divergence), or when price makes a lower low but RSI makes a higher low (bullish divergence), the divergence score adjusts the momentum component accordingly.
Component 3: Volume Confirmation
Volume provides crucial confirmation of price movements. This component analyzes On-Balance Volume relative to its moving average and measures the slope of OBV to determine whether volume is supporting the price trend. Additionally, it monitors relative volume by comparing current volume to its recent average, adding confirmation when volume spikes accompany price movements.
Component 4: Price Structure and Volatility
This component evaluates where price sits within the dynamic bands and considers the current volatility regime. When price is near the lower band, the component contributes a bullish score, suggesting potential support. When price is near the upper band, it contributes a bearish score, suggesting potential resistance.
The volatility regime assessment uses ATR percentile ranking. Low volatility periods often precede significant moves, while extremely high volatility may indicate unsustainable conditions.
Component 5: Price Action Quality
This component examines the character of recent candles by tracking the ratio of bullish to bearish candles over a lookback period. Consistent bullish price action contributes a positive score, while consistent bearish action contributes negatively. This helps filter signals by confirming that price behavior aligns with other factors.
Dynamic Bands
The indicator plots adaptive bands around a central basis line. The basis can be configured as either a simple or exponential moving average. Band width is determined by ATR multiplied by a dynamic factor that incorporates both ADX (expanding bands in trending markets) and the Chaikin Oscillator (expanding bands during strong accumulation or distribution).
These bands serve multiple purposes: they provide visual context for price position, they define signal trigger zones, and they help identify overextended conditions.
Trend State Detection
The indicator classifies market conditions into three states that affect signal generation and threshold levels.
Strong Uptrend is identified when ADX is rising, ADX exceeds the strong trend threshold, and the positive directional indicator exceeds the negative. This state triggers the most aggressive buy settings, allowing entries on shallow pullbacks.
Downtrend is identified when the negative directional indicator exceeds positive DI and ADX confirms directional movement. This state applies the most conservative buy settings, requiring deep oversold conditions before generating buy signals.
Neutral applies when neither trend condition is met, using moderate threshold settings appropriate for range-bound or transitional markets.
Dynamic RSI Thresholds
A key innovation is the automatic adjustment of RSI thresholds based on trend state. In a strong uptrend, the buy RSI threshold might be set to 50, allowing entries when RSI merely pulls back to neutral rather than requiring oversold conditions. The sell threshold rises to 72, keeping traders in positions longer during favorable conditions.
In downtrends, the buy RSI threshold drops to 25, ensuring buys only trigger on genuine capitulation. The sell threshold drops to 64, making exits easier to trigger.
In neutral markets, traditional oversold and overbought levels apply, with buy triggers around RSI 30 and sell triggers around RSI 68.
This adaptive approach prevents the common problem of indicators that work well in one market environment but fail in others.
Dynamic Cooldown
The signal cooldown period adjusts based on trend strength. During normal conditions, a standard cooldown prevents signal clustering. When ADX exceeds the strong trend threshold and is rising, indicating a powerful trend, the cooldown period extends. This helps traders stay in winning positions longer by reducing the frequency of counter-trend signals.
Cascade Protection
The indicator includes protection mechanisms to prevent overtrading and averaging down into losing positions.
The BBWP (Bollinger Band Width Percentile) monitor tracks current volatility relative to historical levels. When BBWP exceeds a threshold, indicating a volatility spike often associated with sharp moves, all buy signals are frozen. This protects against entering during panic selloffs or blow-off tops.
The consecutive buy counter tracks how many buy signals have occurred without an intervening sell. After reaching the maximum (default 3), no additional buy signals are generated until a sell occurs. This prevents the destructive pattern of repeatedly buying a declining asset.
Both protection mechanisms are displayed in the information panel, allowing traders to understand why signals may or may not be firing.
Signal Generation
Buy signals require price to touch or penetrate the lower band, RSI to be below the dynamic threshold, and the market to be in a trending state (when that filter is enabled). Additionally, the cooldown period must have elapsed and cascade protection must not be blocking buys.
Sell signals require price to touch or penetrate the upper band, RSI to be above the dynamic threshold, and the cooldown to have elapsed.
Signal labels display the entry price, signal type (shallow dip, capitulation, extended, bounce sell, or neutral), and the current position in the consecutive buy count.
Visual Components
The indicator provides multiple layers of visual feedback.
Cloud shading between the bands changes based on whether the composite score is in a buy zone or sell zone. Green clouds indicate bullish score readings, while red clouds indicate bearish readings.
Background coloring reflects the overall market regime. Green background indicates a bullish regime (positive DI leadership with volume confirmation), red indicates bearish regime, and white indicates neutral conditions.
An ADX bar at the bottom of the chart uses color coding: white for ranging (very low ADX), orange for flat, and blue for trending conditions.
The information panel displays the composite score with color coding, current trend state, active RSI thresholds, divergence status, BBWP freeze status, buy counter, market regime, ADX value with trend indicator, current cooldown setting, and live RSI reading color-coded against the active thresholds.
A debug panel can be enabled to show the individual component scores, helping users understand what is driving the composite reading.
How to Use
Monitor the composite score in the information panel. Readings above the buy threshold combined with price near the lower band represent potential long entries. Readings below the sell threshold with price near the upper band suggest exit opportunities.
Pay attention to the trend state. In strong uptrends, be more willing to buy dips and more patient with holding positions. In downtrends, require stronger confirmation before entering and be quicker to take profits on bounces.
Watch the cascade protection status. If BBWP shows frozen or the buy counter is approaching maximum, exercise additional caution regardless of other signals.
Use the dynamic RSI thresholds as context. When the panel shows buy RSI threshold at 50 (strong uptrend), even a pullback to RSI 45 is a potential entry. When the threshold shows 25 (downtrend), wait for genuine capitulation conditions.
Component Weight Adjustment
The relative importance of each scoring component can be adjusted through the settings. The default weights emphasize trend strength (30%) and momentum (25%), with volume (20%), price structure (15%), and price action (10%) providing confirmation.
For trend-following strategies, consider increasing trend and momentum weights. For mean-reversion approaches, increase the price structure weight to emphasize band position. The weights should sum to approximately 1.0 for proper score scaling.
Settings Guidance
The default settings are calibrated for cryptocurrency markets on lower timeframes. For traditional markets or longer timeframes, consider adjusting the ADX trending threshold (lower values for less volatile assets), the dynamic RSI levels for each trend state, and the cascade protection parameters.
The Heikin Ashi option for band calculation can provide smoother bands but may introduce slight lag. The default setting uses standard price data for better real-time accuracy.

ForzAguanno - Premium / Discount (Range Glissant)Premium / Discount Zones – Dynamic Range (Fibo-based)
This indicator highlights Premium, Discount, and Equilibrium zones using a dynamic Fibonacci range calculated from recent price action.
It is designed to help traders contextualize price and avoid taking trades in unfavorable locations (e.g. buying too high or selling too low).
- How it works
The indicator automatically:
- Detects the highest high (HH) and lowest low (LL) over a rolling range
- Builds a Fibonacci-style structure between LL → HH
- Defines three key areas:
Discount Zone (lower part of the range)
Equilibrium Zone (around the 50% level)
Premium Zone (upper part of the range)
Two additional extreme levels are used:
0.075 → deep discount
0.925 → deep premium
These levels help isolate areas where price is statistically stretched.
- Visual elements
- Horizontal levels:
- Green → Discount
- Purple → Equilibrium
- Red → Premium
- Text labels are placed inside each zone for instant readability.
Zones are extended into the future for cleaner visualization.
- How to use it
This tool is best used as a context filter, not a standalone signal generator.
Typical use cases:
Look for longs in Discount
Look for shorts in Premium
Use Equilibrium as a neutral / decision zone
Combine with structure, momentum, or entry models
It works particularly well with:
Market structure concepts
Smart money / range-based trading
Session-based strategies
⚠️ Important notes
This indicator does not predict direction
It provides context, not signals
Always combine with proper risk management
Final thoughts
The goal of this indicator is simplicity and clarity:
Know where price is located inside its range before taking a trade.
If you find it useful, feel free to share feedback.
