Trend and Momentum DashboardI created this indicator to tell me when it's time to trade (going long) and when it's time to wait (or going short).
You can enter up to 13 ticker (default is S&P500 and key market segments).
For each ticker, fibonacci levels are calculated and represented either in 5 color or 3 color mode as single lines.
(Thanks to eykpunter for the fibonacci level implementation. I'm using his code and modified it slightly).
Color coding (5 color mode) explanation:
blue = in uptrend area
light blue = in prudent buyers area
gray = in center area
light red = in prudent sellers area
red = in downtrend area
The topline is a combination of all ticker and shows if the market is either bullish or bearish (threshold adjustable in settings)
The bullish/bearish trend can also be used as background color. Alternatively the last bar in the selected time period is been highlighted.
How to use it:
The indicator works on all timeframes. Use the color coding explanation above to see the status of each asset.
a) You can evaluate "long" term trend using day or week timeframe. e.g. I'm usually trading only long and stay out of the market when it is not bullish (top line & background = blue). I'm also using it to know which segments/assets are currently "hot".
b) You can evaluate short term momentum (using 1h or lower timeframe) and see in which direction the market/assets are moving. e.g. I use this when the exchanges open to see how the day is going to move.
I've attached 3 examples in the screenshot - first is the default, in the second one I'm using different asset classes and the third one is for crypto.
Limitations:
There are security request limits as well as string limitations for the security calls in pine script, so I went to the maximum what is currently possible.
(No financial advise, for testing purposes only)
Trend

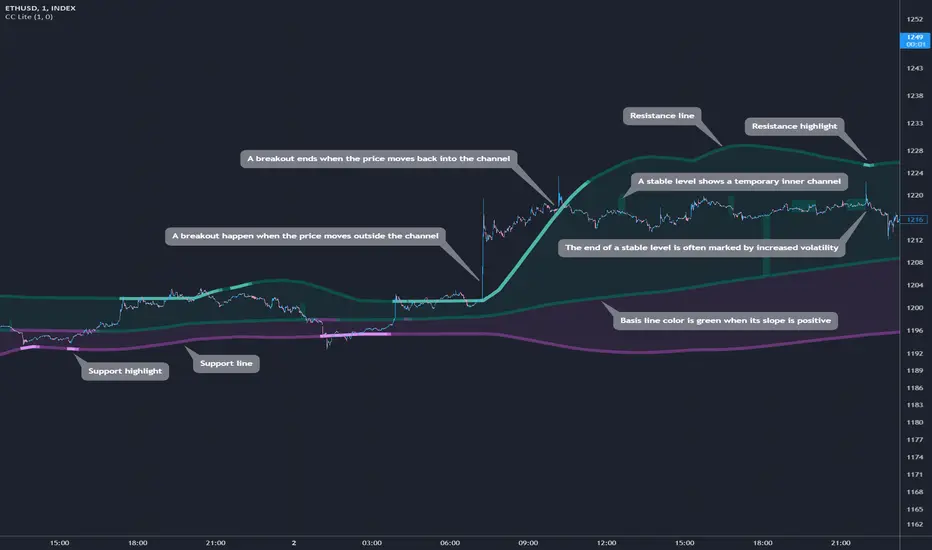
Cosmic Channel LiteCosmic Channel Lite ( CC Lite) draws dynamic non-repainting trendlines and helps
⭐ know when a breakout is about to begin
⭐ predict the position and timing of the next swing reversal
⭐ predict sudden changes in volatility
⭐ recognize whether the price is in bearish or bullish territory
👀 HOW IT WORKS
Cosmic Channel Lite draws a dynamic channel consisting of a support line, basis line and resistance line. These are calculated by applying the Reduced Median Method to groups of moving averages of different type over several periods each, effectively taking 20 data points and reducing them to 3. In between, 6 internal levels are left to give context inside the channel with stable levels, the extremes of which help highlight the SR lines (see chart). The basis line color is determined by its smoothed angle with positive angles in green and negative in purple. The aim of this indicator is to provide a consistent and generic price context that works out-of-the-box and accordingly the settings have been stripped to the bare minimum with no need to continually adjust them.
📗 HOW TO USE IT
The Cosmic Channel Lite plots are meant to be used as a guide for entering and exiting positions and setting stop-loss and take profit levels. The indicator is deemed effective for any particular timeframe as long as the price stays within the maximum bounds of the indicator's plots. For this reason it is recommended to use Cosmic Channel Lite in a multi-chart layout where each chart has a different timeframe. The 5 primary strategies are:
long when the price reverses off of the support line and short when the price reverses off of the resistance line
long when the support line is highlighted and short when the resistance line is highlighted
long when the price breaks above the resistance line and short when the price breaks below the support line
long when the price moves above the basis line after being below it for a prolonged period and visa-versa (short when the price moves below the basis line)
long/short in the direction the price takes after a stable level ends
🔔 SMART ALERTS
Get notified at the most critical times by settings just one alert. Simply select CC Lite and Any alert() function call as the conditions when creating an alert and you will be tipped-off on bar-close as follows:
R─ (resistance line is highlighted)
S─ (support line is highlighted)
For example, an alert such as CC Lite 6h R─ would mean that during the last 6-hour bar the resistance line has been highlighted. The highlight lasts at least 15 bars from the first highlight bar regardless of price action.
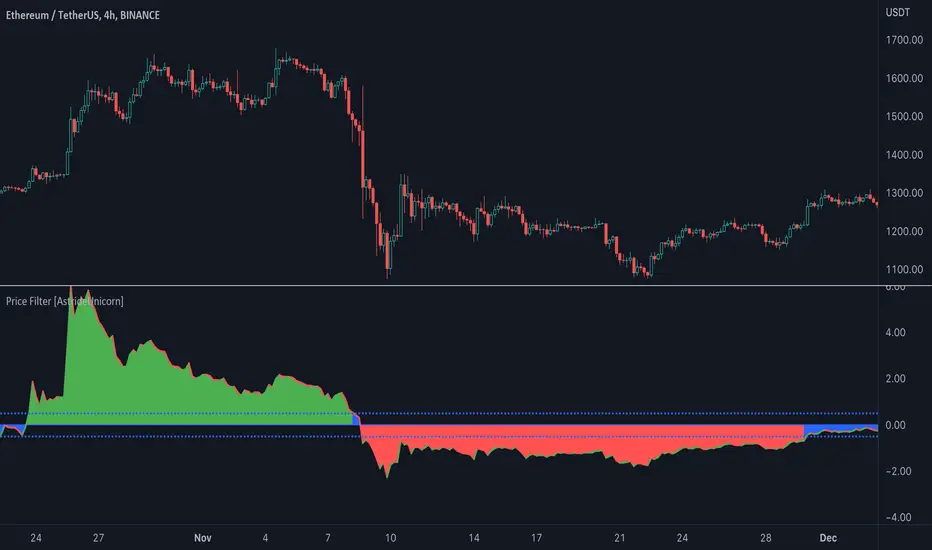
Price Filter [AstrideUnicorn]The indicator calculates a fast price filter based on the closing price of the underlying asset. Overall, it is intended to provide a fast, reliable way to detect trend direction and confirm trend strength, using statistical measures of price movements.
The algorithm was adapted from Marcus Schmidberger's (2018) article "High Frequency Trading with the MSCI World ETF". It demeans the price time series using the long-term average and then normalizes it with the long-term standard deviation. The resulting time series is then compared to specified thresholds to determine the trend direction.
HOW TO USE
The indicator surface is colored green if the price is trending upwards and red if the price is trending downwards. If the indicator outline is the opposite color of the indicator surface, it indicates that the price is moving against the trend and the current trend may be losing strength.
If the 'Use threshold' setting is enabled, the indicator will be colored blue if its value is within the range defined by the upper and lower thresholds. This indicates that the price is trending sideways, or that the current trend is losing strength.
SETTNGS
Length - the length of the long-term average used to calculate the price filter. Recommended range 20 - 200. The sensitivity of the indicator increases as the value becomes smaller, allowing it to detect smaller price moves and swings earlier.
Threshold - the threshold value used to detect trend direction.
Use threshold - a boolean (true/false) input that determines whether to use the threshold value for confirmation.
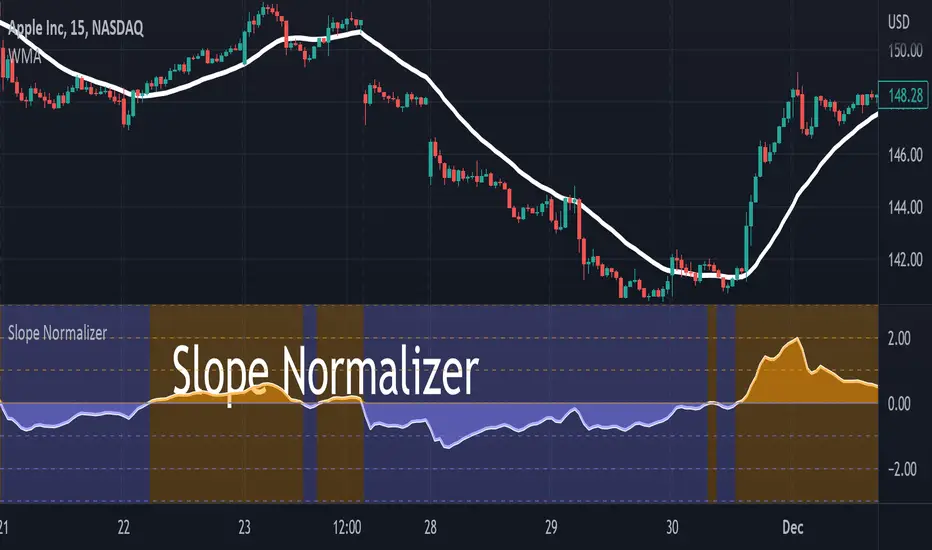
Slope NormalizerBrief:
This oscillator style indicator takes another indicator as its source and measures the change over time (the slope). It then isolates the positive slope values from the negative slope values to determine a 'normal' slope value for each.
** A 'normal' value of 1.0 is determined by the average slope plus the standard deviation of that slope.
The Scale
This indicator is not perfectly linear. The values are interpolated differently from 0.0 - 1.0 than values greater than 1.0.
From values 0.0 to 1.0 (positive or negative): it means that the value of the slope is less than 'normal' **.
Any value above 1.0 means the current slope is greater than 'normal' **.
A value of 2.0 means the value is the average plus 2x the standard deviation.
A value of 3.0 means the value is the average plus 3x the standard deviation.
A value greater than 4.0 means the value is greater than the average plus 4x the standard deviation.
Because the slope value is normalized, the meaning of these values can remain generally the same for different symbols.
Potential Usage Examples/b]
Using this in conjunction with an SMA or WMA may indicate a change in trend, or a change in trend-strength.
Any values greater than 4 indicate a very strong (and unusual) trend that may not likely be sustainable.
Any values cycling between +1.0 and -1.0 may mean indecision.
A value that is decreasing below 0.5 may predict a change in trend (slope may soon invert).
Auto Trend Lines Breakouts and Bounces Signals and AlertsAuto Trend Lines Breakout with Confirmation Bounce Signals and Alerts
This indicator draws trend lines automatically based on the 2 pivot points, which are calculated based on the specified number of bars (length), which is of course customizable. The indicator then shows you when these trend lines get touched (potential bounce) or “almost touched” (Yes! The script can do that as well!) by the current price of the instrument or broken and then confirmed by the “after break come back touch” – classic! Everything is shown on the chart, and for everything - alarms can be set up with just a few clicks!
Now there are 2 modes here (you can hide all signals as well and just use the trend lines):
1) Current/recent trend lines only: will only show 2 current upper/lower trend lines as well as previous 2 for reference.
2) All time (historical) trend lines: will show 2 current upper/lower trend lines as well as the historical lines from the past and these lines are often very respected by the price!
Besides that, you can set the indicator to show you exactly what you want: Just the trend lines touches/bounces, breaks with confirmation touches/bounces or BOTH.
In addition to that, you can set the indicator to only show you these touches/bounces and breaks with additional confirmations, only if confirmed by :
- Moving Average (customizable length): LONG signals based off the trend lines will only be shown if above EMA, SHORT if below.
- Signals where the candle color confirms the direction of the trade, but the candle type is opposite (like a green colored bearish hammer for example) will be avoided (such candles can be very uncertain/deceptive)
- Signals where the signal candle is doji will be avoided (uncertain)
- Signals will only be shown if supported by the trend line slope (for example, with this feature turned on, if there is an upper line trend line, but the line is actually above, touching the top of the candles and the price touches/crosses it or it gets broken – there will be no signal as even though the trend line is an upper line above candles, it’s slope is positive (going up), if the slope would be down, like a classical down/bearish trend line and the price touches/bounces off it or the line gets broken, only then the indicator will show the signal/alert.
- OFFSET: this one is really cool! With this feature you can hunt these conditions when the price comes very near the trend line, but never touches it. With this setting turned on, with a correct offset amount – you will be able to catch these! You will need to play around with the offset amount, depending on the timeframe/instrument, be quick-n-easy!
The indicator also includes Round Number lines on the chart, which are customizable for any instrument. As you know round numbers are appreciated by the price and can be very nicely used with this indicator looking for combos or using trend lines for signals, while round numbers as partial profit price targets or stop-loss areas.
Important economic events are also shown on the chart as red vertical lines (during these events, volatility can suddenly spike, so it’s best to stay away from trading!)
This is a very powerful indicator with plenty of customizations to find the best approaches, can be used for any instrument and on any timeframe! Awesome for scalping and could be used with swing trading as well! Enjoy!
To add the alerts
-Right-click anywhere on the TradingView chart
-Click on Add alert
-Condition: Auto Trend Lines Breakout with Confirmation Bounce Signals and Alerts
-Alert name: DO NOT TOUCH THIS
-Hit “Create”
-Note: If you change ANY Settings within the indicator – you must DELETE the current alert and create a new one per steps above, otherwise it will continue triggering alerts per old Settings!
A few strategies how this indicator can be used (these were actually tested and showed awesome results!):
1) Bounce Scalping: Simply hunting bounces off the trend lines. Often the price will slightly cross the trend line and then immediately bounces from it for nice little price move, which is great for scalping or if you for example take 2/3s off the position and leave the remaining, often with such bounces – the price may reverse from the trend line and go in the opposite direction considerably.
2) Break-Bounce-Confirm: this is the “Breaks with Confirmation Bounce” option of the script which fully automates the classical trend lines break confirmation, where the trend line is broken (which could be a fake out), so you wait for a touch/bounce of that trend line back from the initial break and open the position right there or wait and see if after the touch/bounce back, the price once again goes into the direction of the break.
For stop-loss and take-profit areas, you can use:
1) Pivots (these are marked with red and green crosses on the chart), which are used to draw the actual trend lines.
2) The actual trend lines themselves (if one gets broken + confirmation, you can set your stop-loss if that same line gets broken again in the opposite direction | similar for take-profit, you can take profit or partial profit at next trend line on the chart if the price reaches it.
3) Use the Round Numbers included, for example: use the closest round number as a visual soft stop-loss and the furthest one away as a visual soft take-profit.
You can try combining this indicator with divergence, stochastic, Bollinger bands, pretty much anything!
If you wish to try this out for a week or so – please reach out and I will give you access.

Theory Affinity TrendlinesThis indicator is perfect for traders who want to identify trend lines on a chart. It draws higher low uptrends and lower high downtrends, making it easy to see where the trend is going. You can also customize the settings to fit your needs, making it the perfect tool for your trading arsenal.
With this new tool, you can easily customize your experience to get the most out of your trading and analysis. With options like max lines, strength multiplier, pivot plots/text, and more, you can easily create the perfect trading analysis environment.
So why wait? Try it out today!
Leave feedback and let me know what you think.
// ############################################################################################## Input Descriptions
Pivot Left ----------------- look left n bars
Pivot Right ---------------- look right n bars
Strength ------------------- Pivot multiplier (Higher = Wider Trend lines)
Max Lines ------------------ Number of lines for each Uptrend and Downtrend
Structure Text ------------ Show HH, LL, etc. on chart
Structure Markers -------- Dots at the Pivot Highs and Lows
Plots ------------------------ Draw a line at Pivot Highs and Lows
Last Up Width ------------- Width of the current Uptrend line
Historical Up Width ------ Width of previous Uptrend lines
Last Down Width --------- Width of the current Downtrend lines
Historical Down Width --- Width of previous Downtrend lines
Line Offset ---------------- Shift trend lines right or left
* Lines may or may not "repaint". For use to identify trends that are more than likely already established and to identify trend line breaks.

Musashi_Fractal_Dimension === Musashi-Fractal-Dimension ===
This tool is part of my research on the fractal nature of the markets and understanding the relation between fractal dimension and chaos theory.
To take full advantage of this indicator, you need to incorporate some principles and concepts:
- Traditional Technical Analysis is linear and Euclidean, which makes very difficult its modeling.
- Linear techniques cannot quantify non-linear behavior
- Is it possible to measure accurately a wave or the surface of a mountain with a simple ruler?
- Fractals quantify what Euclidean Geometry can’t, they measure chaos, as they identify order in apparent randomness.
- Remember: Chaos is order disguised as randomness.
- Chaos is the study of unstable aperiodic behavior in deterministic non-linear dynamic systems
- Order and randomness can coexist, allowing predictability.
- There is a reason why Fractal Dimension was invented, we had no way of measuring fractal-based structures.
- Benoit Mandelbrot used to explain it by asking: How do we measure the coast of Great Britain?
- An easy way of getting the need of a dimension in between is looking at the Koch snowflake.
- Market prices tend to seek natural levels of ranges of balance. These levels can be described as attractors and are determinant.
Fractal Dimension Index ('FDI')
Determines the persistence or anti-persistence of a market.
- A persistent market follows a market trend. An anti-persistent market results in substantial volatility around the trend (with a low r2), and is more vulnerable to price reversals
- An easy way to see this is to think that fractal dimension measures what is in between mainstream dimensions. These are:
- One dimension: a line
- Two dimensions: a square
- Three dimensions: a cube.
--> This will hint you that at certain moment, if the market has a Fractal Dimension of 1.25 (which is low), the market is behaving more “line-like”, while if the market has a high Fractal Dimension, it could be interpreted as “square-like”.
- 'FDI' is trend agnostic, which means that doesn't consider trend. This makes it super useful as gives you clean information about the market without trying to include trend stuff.
Question: If we have a game where you must choose between two options.
1. a horizontal line
2. a vertical line.
Each iteration a Horizontal Line or a Square will appear as continuation of a figure. If it that iteration shows a square and you bet vertical you win, same as if it is horizontal and it is a line.
- Wouldn’t be useful to know that Fractal dimension is 1.8? This will hint square. In the markets you can use 'FD' to filter mean-reversal signals like Bollinger bands, stochastics, Regular RSI divergences, etc.
- Wouldn’t be useful to know that Fractal dimension is 1.2? This will hint Line. In the markets you can use 'FD' to confirm trend following strategies like Moving averages, MACD, Hidden RSI divergences.
Calculation method:
Fractal dimension is obtained from the ‘hurst exponent’.
'FDI' = 2 - 'Hurst Exponent'
Musashi version of the Classic 'OG' Fractal Dimension Index ('FDI')
- By default, you get 3 fast 'FDI's (11,12,13) + 1 Slow 'FDI' (21), their interaction gives useful information.
- Fast 'FDI' cross will give you gray or red dots while Slow 'FDI' cross with the slowest of the fast 'FDI's will give white and orange dots. This are great to early spot trend beginnings or trend ends.
- A baseline (purple) is also provided, this is calculated using a 21 period Bollinger bands with 1.618 'SD', once calculated, you just take midpoint, this is the 'TDI's (Traders Dynamic Index) way. The indicator will print purple dots when Slow 'FDI' and baseline crosses, I see them as Short-Term cycle changes.
- Negative slope 'FDI' means trending asset.
- Positive most of the times hints correction, but if it got overextended it might hint a rocket-shot.
TDI Ranges:
- 'FDI' between 1.0≤ 'FDI' ≤1.4 will confirm trend following continuation signals.
- 'FDI' between 1.6≥ 'FDI' ≥2.0 will confirm reversal signals.
- 'FDI' == 1.5 hints a random unpredictable market.
Fractal Attractors
- As you must know, fractals tend orbit certain spots, this are named Attractors, this happens with any fractal behavior. The market of course also shows them, in form of Support & Resistance, Supply Demand, etc. It’s obvious they are there, but now we understand that they’re not linear, as the market is fractal, so simple trendline might not be the best tool to model this.
- I’ve noticed that when the Musashi version of the 'FDI' indicator start making a cluster of multicolor dots, this end up being an attractor, I tend to draw a rectangle as that area as price tend to come back (I still researching here).
Extra useful stuff
- Momentum / speed: Included by checking RSI Study in the indicator properties. This will add two RSI’s (9 and a 7 periods) plus a baseline calculated same way as explained for 'FDI'. This gives accurate short-term trends. It also includes RSI divergences (regular and hidden), deactivate with a simple check in the RSI section of the properties.
- BBWP (Bollinger Bands with Percentile): Efficient way of visualizing volatility as the percentile of Bollinger bands expansion. This line varies color from Iced blue when low volatility and magma red when high. By default, comes with the High vols deactivated for better view of 'FDI' and RSI while all studies are included. DDWP is trend agnostic, just like 'FDI', which make it very clean at providing information.
- Ultra Slow 'FDI': I noticed that while using BBWP and RSI, the indicator gets overcrowded, so there is the possibility of adding only one 'FDI' + its baseline.
Final Note: I’ve shown you few ways of using this indicator, please backtest before using in real trading. As you know trading is more about risk and trade management than the strategy used. This still a work in progress, I really hope you find value out of it. I use it combination with a tool named “Musashi_Katana” (also found in TradingView).
Best!
Musashi

Linear Regression AngleThere are several Linear Regression indicator in the Public Library, but I don't think there is one that converts the Linear Regression (LR) curve into angle in degrees, relative to a set reference frame. Due to the large price range between tickers, creating this indicator isn't as straight forward as I originally thought. For example, given the same time period, a stock that fluctuate in the 10's will have a true linear regression angle dramatically different from a penny stock. Even changing the scale on your chart will affect the "apparent" angle you see on the chart. Hence, this indicator DOES NOT provide the true linear regression angle, but only a relative one based on a defined number of historical bars.
Originality and usefulness
This indicator provides Linear Regression (LR) Angle in degree that may be more easily interpreted by some traders as we are more accustomed to line angles in degree and know how to visualize them.
This script also provides the option to overlay up to four LR curves of different periods, as well as an average curve of the enabled curves. This allows traders to analysis short to long term trends.
Furthermore, slope (rate of change) of each LR curves can be toggled. The slope plot can help traders visualize accelerations and decelerations of the LR curves which may help in spotting trend reversals.
Data table provides real time data for each curve.
Example of using slope plot with a 30 bars Linear Regression Angle:

MAGIC MACDMAGIC MACD ( MACD Indicator with Trend Filter and EMA Crossover confirmation and Momentum). This MACD uses Default Trading view MACD
from Technical indicators library and adding a second MACD along with 3 EMA's to detect Trend and confirm MACD Signal.
Eliminates usage of 3different indicators (Default MACD , MACD-2,EMA5, EMA20, EMA50)
Basic IDEA.
Idea is to filter Histogram when price is above or below 50EMA. Similar to QQE -mod oscillator but Has a EMA Filter
1.Take DEFAULT MACD crossover signals with lower period
2.check with a Higher MACD Histogram.
3.Enter upon EMA crossover signal and Histogram confirmation.
Histogram changes to GRAY when price is below EMA 50 or above EMA 50 (Follows Trend)
4.Exit on next Default MACD crossover signal.
Overview :
Moving Average Convergence Divergence Indicator Popularly Known as MACD is widely used. MACD Usually generates a lots of False signals
and noise in Lower Time Frames, making it difficult to enter a trade in sideways market. Divergence is a major issue along with sideways
movement and tangling of MACD and Signal Lines. There is no way to confirm a Default MACD signal, except to switch time frames and
verify.
Magic MACD Can be used to in combination with other signals.
This MACD uses two MACD Signals to verify the signal given by Default MACD . The Histogram Plot shown is of a higher period
MACD (close,5,50,30) values. When a signal is generated on a lower MACD it is verified by the histogram with higher time period.
Technicals Used:
1. Lower MACD-1 values 12,26 and signal-9 (crossover Signals)
2. Higher MACD-2 values 5,50 and signal-30 (Histogram)
3. EMA 50 (Histogram Filter to allow only if price above or below Ema 50)
4. EMA 5 and EMA 20 for crossover confirmation of trend
What's is in this Indicator?
1.Histogram-(higher period 5,50 and 30signal)
2. MACD crossover Signals-(lower period Default MACD setting)
3.Signal Lines-( EMA 5 & 20)
Implemented & Removed in this Indicator
1. Default MACD and Signal Lines are removed completely
2. MACD crossover are taken on lower periods and plotted as signals(Blue Triangle or Red Triangle)
3. Histogram is plotted from a higher Period providing a clear picture with Higher Time period
4. EMA 5 and EMA 20 are used for MACD signal confirmation
How to use?
Up Signal
1. MACD Default (12,26,30) up signals are shown in Blue
2. Wait till the Histogram changes Blue
3. Look for EMA signals crossover near by
Down Signal
1. MACD Default (12,26,30) up signals are shown in Red
2. Wait till the Histogram changes Red
3. Look for EMA signals crossover near by
Do's
Consider only opposite color as signals
1. Red Triangle on Blue Histogram(likely to move down direction)
2. Blue Triangle on Red Histogram (Likely to move up direction)
Don'ts
1.Ignore Blue Signal on Blue Histogram (pull back signals can be used to enter trade if you miss first crossover)
2.Ignore Red Signal on Red Histogram(pull back signals can be used to enter trade if you miss first crossover)
3.Ignore Up and Down signals till Gray or Blacked out area is finished in Histogram
Tips:
1. EMA plot also shows pull back areas along with signals
2.side by side opposite signals shows sides ways movement
3. EMA 5,20 is plotted on MACD Histogram for Additional Benefit
Thanks & Credits
To Tradingview Team for allowing me to use their default MACD version and coding it in to a MAGIC MACD by adding a few lines of code that
makes it more enhanced.
Warning...!
This is purely for Educational purpose only. Not to be used as a stand alone indicator. Usage is at your own Risk. Please get familiar with its working before implementing. Its not a Financial Advice or Suggestion . Any losses or gains is at your own risk.

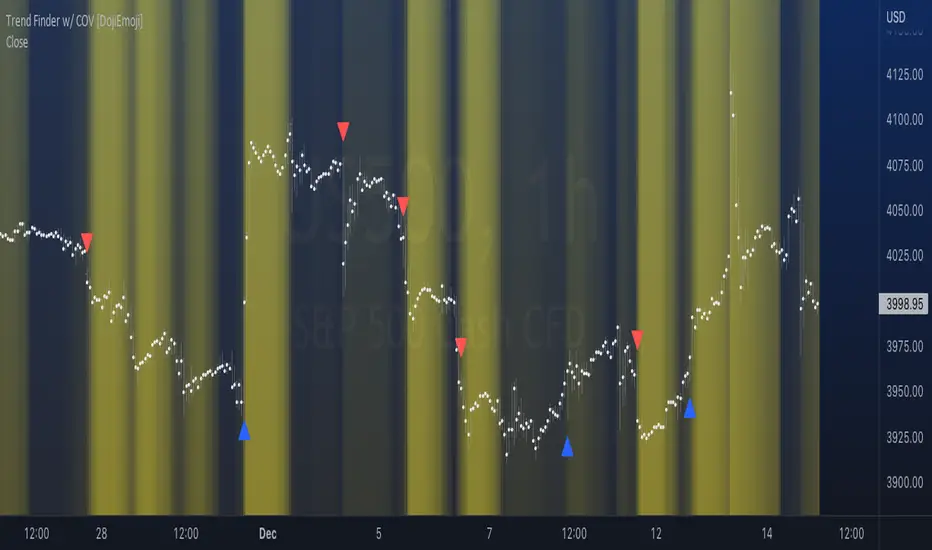
Trend Finder with Coefficient of VariationCoefficient of variation (“COV”) is a statistical measure used to describe the variability of values within a data set, it’s calculated by taking the standard deviation divided by the mean.
Traditionally, COV is applied to the expected returns of competing investment portfolios. A risk adverse investor prefers to accept a portfolio with a relatively lower COV value.
On the other hand, when applying COV to price charts, the difference is that instead of looking at expected returns, we now treat price as the source of data. We look at price from a moving average perspective. This script purely focuses on price.
What this indicator does:
Firstly, to go over the parameters:
Let ‘n’ be the lookback period for computing COV, and ‘m’ be the period for comparing the ranking of COVs.
Logics in a nutshell:
This program will (A) calculate the COV by dividing the moving standard deviation by moving average over ‘n’ bars, and then (B) illustrate the relationship of how COV at each bar ranks compared to COVs over past ‘m’ bars. We use a color scale (default black and yellow) for visualizing ranking in terms of percentiles. If COV is below its median value, then we assume that price is consolidating.
Hypothesis:
Using COV on top of regular SMA signals should reduce a lot of unwanted noise such as consecutive crossovers during ranging-periods. Traders want volatility, but not too much of it when sniping for entry opportunities (speaking of initial position; need to add to winning positions after, but this is for another topic). For this reason, the median value of COV is suitable as a metric for signals.
Applications:
We use the median value of COV to form a decision rule. A signal is generated when COV > median(COV,m), and the direction of trend is determined based on relative position of price with respect to sma(price,n). When the value of COV is increasing, it can also be thought of seeing Bollinger Bands beginning to bulge. When trends begin, this program will plot triangles to signify entry opportunities.
Immediate Trend - VHXIMMEDIATE TREND - VULNERABLE_HUMAN_X
This indicator is used to identify the immediate trend in the market.
When a Short Term High (STH) is engulfed and closed above, we consider that as a bullish trend.
And Similarly, when a Short Term Low (STL) is engulfed and closed below, we consider that as a bullish trend.
STH - A candle that is higher than the one candle towards it's left and one candle towards it's right.
STL - A candle that is lower than the one candle towards it's left and one candle towards it's right.
HOW TO USE:
1. Do not take trades purely based on the immediate trend showcased by the indicator. Rather, use them as confluence with your trading strategy.
2. When you are expecting price to reverse at your point of interest (Denamd/Supply zone), this indicator can help you predict the reversal by showcasing the current trend.
3. Using this indicator you can travel the trend as long as there is a change of trend predicted by this indicator.

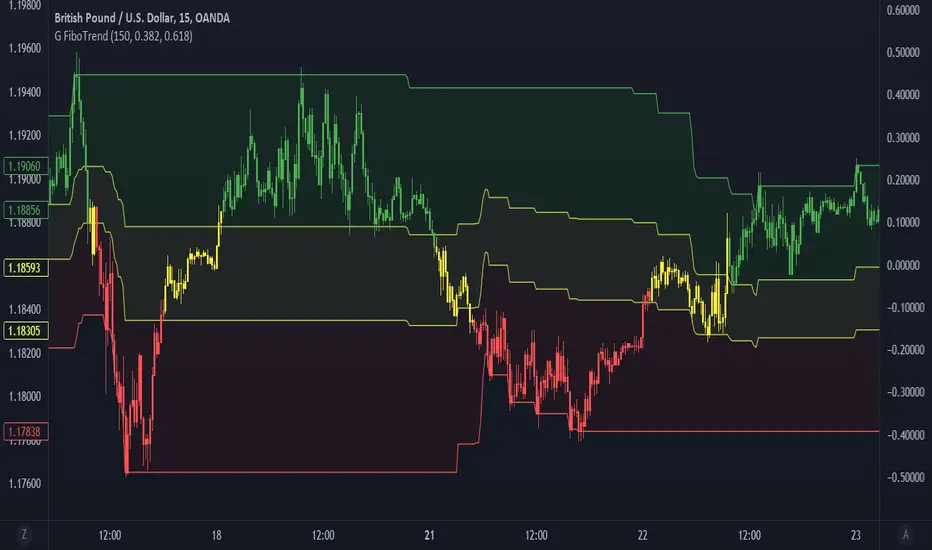
Gedhusek TrendFibonacciThis indicator is a trend filter based on fibonacci retracement levels
How to read:
- There are three filled zones --> red, yellow and green
- If the price is inside of red zone, there is a downtrend on the market
- If the price is inside the yellow zone, there is a sideways trend on the market
- If the price is inside the green zone, there is a uptrend on the market
- Also, candles are going to have a corresponding color based on the current trend
Calculations of the indicator:
1. Calculate distance between maximal and minimal price over the last "x" bars (choose value for "x" in inputs menu under the "Analysis period")
2. Use this distance for calculating two retracement levels (choose retracement levels in inputs menu)
3. These two retracement levels create an area of what is going to be considered as sideways market
Example:
- Lets say we chose Analysis period of 100, Lower Fibonacci Level as 0.382 and Upper Fibonacci Level as 0.618
- Maximum price over the last 100 bars was of 120 and minimum price was 20. That leaves us with the difference of 100 points
- Now we calculate the fibonacci levels --> 100*0.382 = 38.2 and 100*0.618 = 61.8
- The next step is to add the levels to the lowest price point --> 20 + 38.2 = 58.2 and 20 + 61.8 = 81.8
- And now we have our zones. If the price is going to be below the lower fibonacci level (in this case 58.2), we consider it as a bearish trend. If the price is between those fibonacci levels (58.2 and 81.8), we consider it as a sideways trend. And if the price is above the upper fibonacci level (81.8), we consider it as a bullish trend.
Inputs:
- Analysis period --> number of bars within which the system is going to look for max and min price
- Lower Fibonacci Level --> Choose from options and must be lower or the same as "Upper Fibonacci Level"
- Upper Fibonacci Level --> Choose from options and must be higher or the same as "Lower Fibonacci Level"
- Show Filling --> whether you wish to fill the areas with color
- Change Candle Color --> whether you wish to change the color of candles based on current trend.
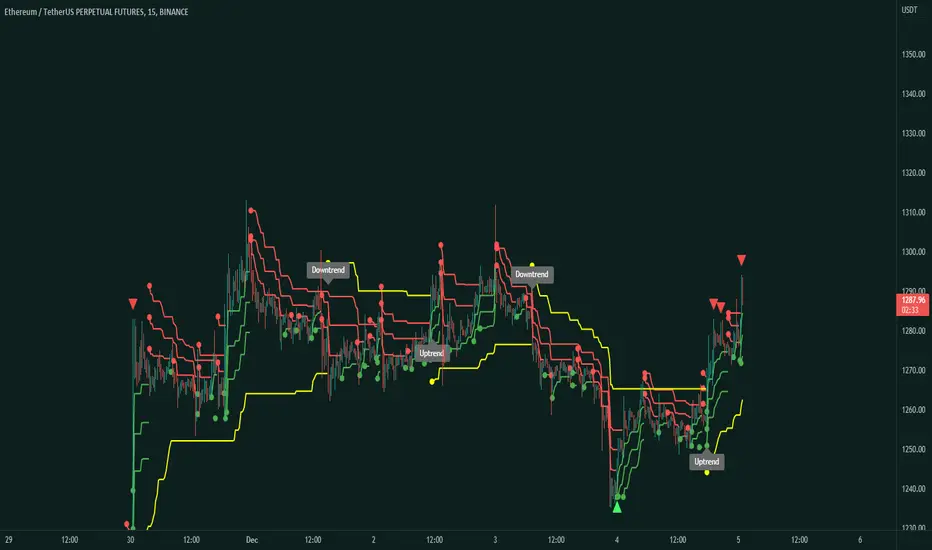
[-_-] Volatility Calibrated ATRDescription:
An indicator based on ATR adjusted for volatility of the market. It uses Heikin Ashi data to find short and long opportunities and displays a dynamic stop loss level. Additionally, it has alerts for when the trend changes (which is an entry signal).
How it works:
It works by dynamically calculating the Period for ATR which depends on current volatility level that is calculated by a function that uses Standard Deviation of price. ATR is then smoothed by Weighted Moving Average and multiplied by ATR Factor, resulting in a plot that changes its colour to red when we're in a downtrend and green when in an uptrend. This plot should be used as a dynamic Stop Loss level. Trend change is determined by price crossing the dynamic Stop Loss level. The squared red and green labels appear when the trend changes, and should be used as Entry signals.
Parameters:
- Source -> data used for calculations
- ATR Factor -> higher values produce less noise and longer trends, lower values give more signals

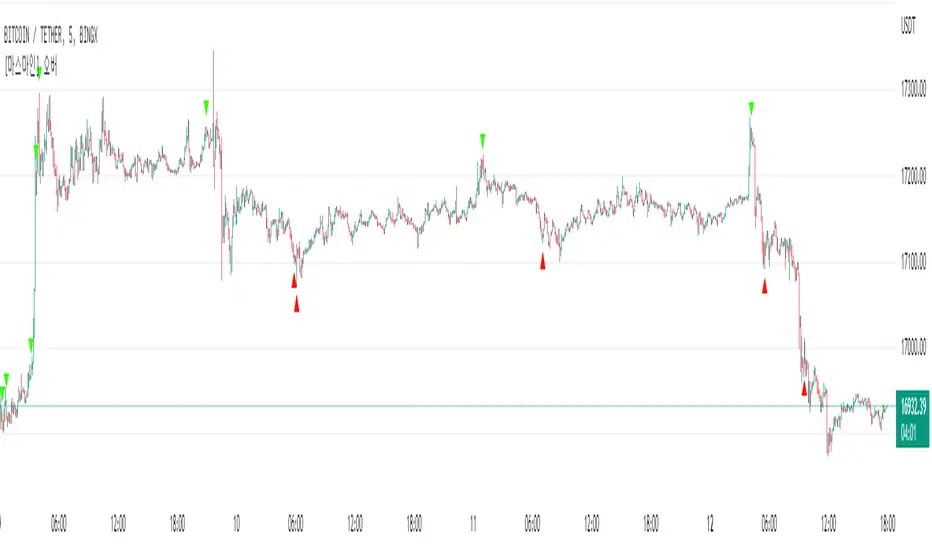
MarsMine_OverThis indicator marks the area where the overbought/oversold section of the Stochastic RSI and the overbought/oversold section of the RSI overlap with arrows.
If an upward arrow appears on the indicator, it can be recognized that both StoRSI and RSI have entered the oversold zone.
When a down arrow appears, both the StoRSI and RSI can be considered to have entered the overbought zone.
This is a good signal to identify the direction of the future trend.
이 지표는 Stochastic RSI의 과매수/과매도 구간과 RSI의 과매수/과매도 구간이 겹치는 구간을 화살표로 표기 해주는 지표 입니다.
해당 지표에서 상승 화살표가 출현할 경우에는 StoRSI와 RSI 모두 과매도 구간에 진입했다고 인식할 수 있으며,
하락 화살표가 출현할 경우에는 StoRSI와 RSI 모두 과매수 구간에 진입했다고 인식할 수 있습니다.
이는 추후 추세의 방향성을 파악할 수 있는 좋은 시그널 입니다.
RSItrendRSItrend is a trend indicator based on the standard RSI.
The logic of building the indicator: We build a channel based on the RSI extremes. The exit of the RSI from the channel up is the beginning of the uptrend, the exit of the RSI from the channel down is the beginning of the downtrend. In the downtrend, the candles are colored blue, in the uptrend - orange.
Possible use of the indicator:
I recommend using it with heiken ashi
On small timeframes, you can trade using extremes that are easy to determine by the indicator, as shown in the example given.
On the higher timeframes above the day, you can simply buy an orange bar, sell a blue one. Add a few money management techniques and make a profit.

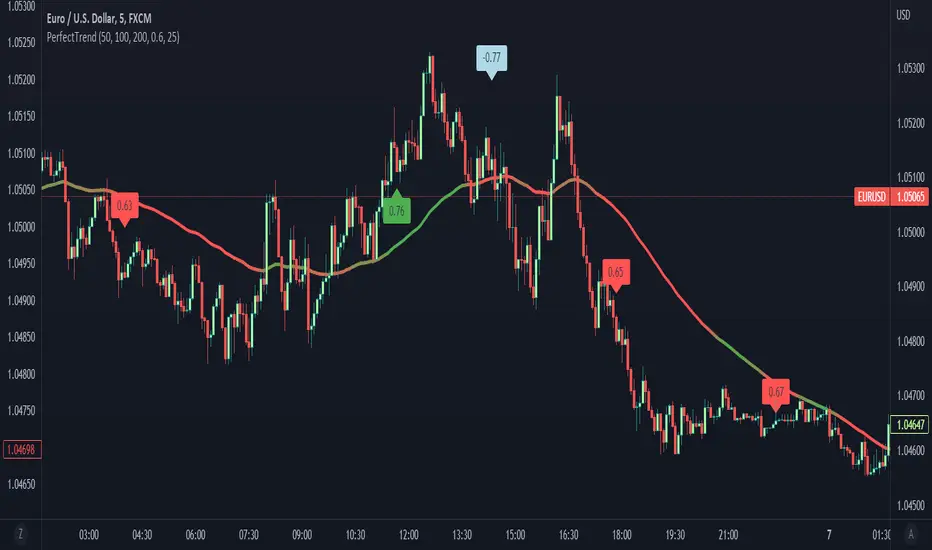
CorrelationTrendThis indicator is a correlation based trend classifier.
How does it work:
- The software measures a correlation between 3 moving averages and the price.
- If there is a significant correlation and the price is moving upwards, the Moving average displayed on the chart is going to be green and if it is moving downwards, it is going to be red. And, if the correlation is not significant, the price is going to have yellow/orange shade.
- In case there is a strong negative correlation (= strong divergence between price and moving average), you will receive a light blue label on the chart. Such events can indicate possible reversals in the market
How to read correlation:
- The correlation value ranges from -1 to 1
- If the value is either bigger than 0.5 or lower than -0.5, the correlation is considered as significant and as the value is closer to 1 or -1, its significancy rises.
Correlation is larger than 0.5 --> means that there is a positive relationship between the direction of price and moving averages (there is a trend)
Correlation is lower than -0.5 --> means that there is a divergence between the direction of price and moving average(possible sudden change of the trend)
What can you see on the chart:
- Moving average--> based on its color you can get a sense of the trend
- Red/Green labels--> after the correlation value surpasses positive Precision trigger (defined in inputs), it creates a label to let you know of such event
- Light blue labels--> after the correlation is lower than negative Precision trigger (defined in inputs), it creates a label to let you know of possible price reversion
- Label on the current bar--> this label displays the current correlation value
Inputs:
- First MA Period = period of the first moving average
- Second MA Period = period of the second moving average
- Third MA Period = period of the third moving average
- Analysis span = number of bars used for computing
- Show flags = set to "true" if you wish to see the labels, otherwise set to "false"
- Show MA = set to "true" if you wish to see the moving average, otherwise set to "false"
Additional info:
- This indicator on its own should not be used as a source of entry signal
- Its main purpose is to give you a sense of the current trend and possible price reversions
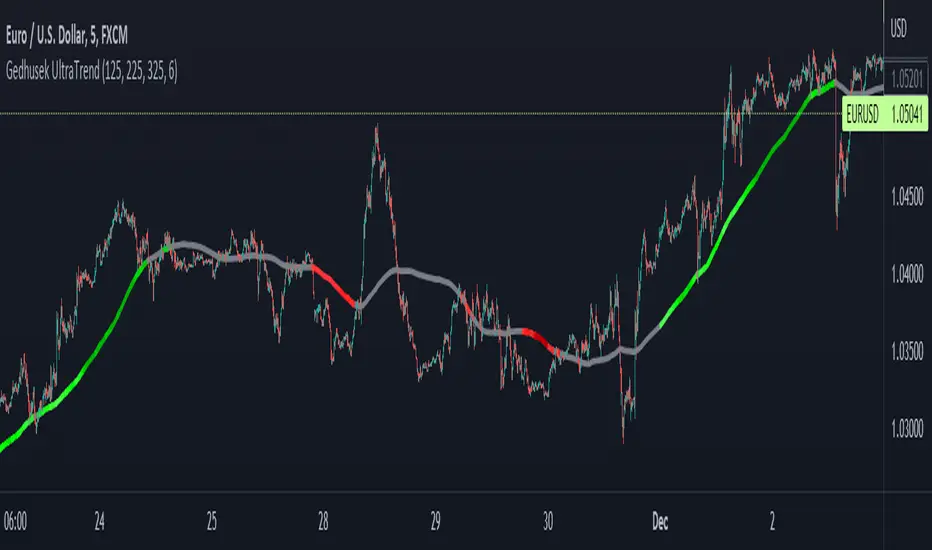
Gedhusek UltraTrendThis indicator serves a purpose of a trend recognizer. It is able to tell you whether the market is bullish, bearish or if the price goes sideways.
Process of determining the trend:
- The indicator uses 3 moving averages to determine the trend
- For each of these averages, there is calculated value change over a certain period. So, if the value of Moving average was 100 and now it is 110, the change is going to be +10
- After these calculations are done, all three of these values are summed up into one
- Based on this value we can determine whether the overall sentiment is bullish or bearish (if the value is larger than 0, the sentiment is bullish and if it is bellow 0, it is bearish)
- One more metric is used when determining the overall trend, and that is the ATR indicator. This indicator represents a certain movement threshold that has to be surpassed in order to have a valid trend
- So all of this can be summed up into this -> if the summed up value of the value shift of 3 moving averages over certain period is larger than ATR value for certain period, the trend is considered as bullish and if this summed up value is lower than ATR value *-1, the trend is considered as bearish. In case the summed value is smaller than ATR value and larger than ATR value *-1, there is no trend.
-----------------------------------------------------------------------------------------
How to use the Indicator:
- The indicator should be used as a tool for giving you a generic feel about the current trend
- It is not a signal providing system
- It can be adjusted for any trading style by changing the Periods in input menu. (As the values are lower, it will give you more short time trend and vice versa)
- It is a great tool to combine with any trend following strategy
-----------------------------------------------------------------------------------------
Which markets and TimeFrame:
- The UltraTrend Indicator works on all of the markets and all of the TF
- I usually use it on 15min and 1H TF, but that is solely my preference
-----------------------------------------------------------------------------------------
Inputs:
First Period = Period of the first MA
Second Period = Period of the second MA
Third Period = Period of the third MA
ATR Period = Period of the ATR
Supertrend Rally RollercoasterSupertrend indicator is a trend following indicator similar to moving averages. You can use this on any timeframe if there is enough market data.
What about the Supertrend Rally Rollercoaster?
The main objective of this indicator is to avoid fake trends as much as possible and find the best bull and bear runs.
The best timeframe is the 15 minute timeframe.
This indicator consist of 4 Supertrend periods. The most important period of this indicator is the fourth period. This is the period that determines the overall trend for the timeframe.
The rest of the bands can be used as confirmations to the trend, determine trade entries, and possible as trade exits and scalping.
The main use of this indicator is to be used with value lines and contraction zones, as showed in the picture below.
So basically the average price or the mean is the value line produced by the contraction. The expansion follows, and then you must wait for the actual trend.
If price is below the value line then you wait for a uptrend and preferably a proper entry. Then you ride it up to the value line as TP, or you can
also let it continue on riding, but your preference.
If price is above value then, you wait for a downtrend and then short to value. This is the main trading strategy behind this indicator and what it has intended for.
The indicator also comes with alerts on when the trend changes and also on the arrows which are take profit symbols.
On an uptrend you will see red take profit signals which work with RSI. They tell you when a possible trend reversal can take place.
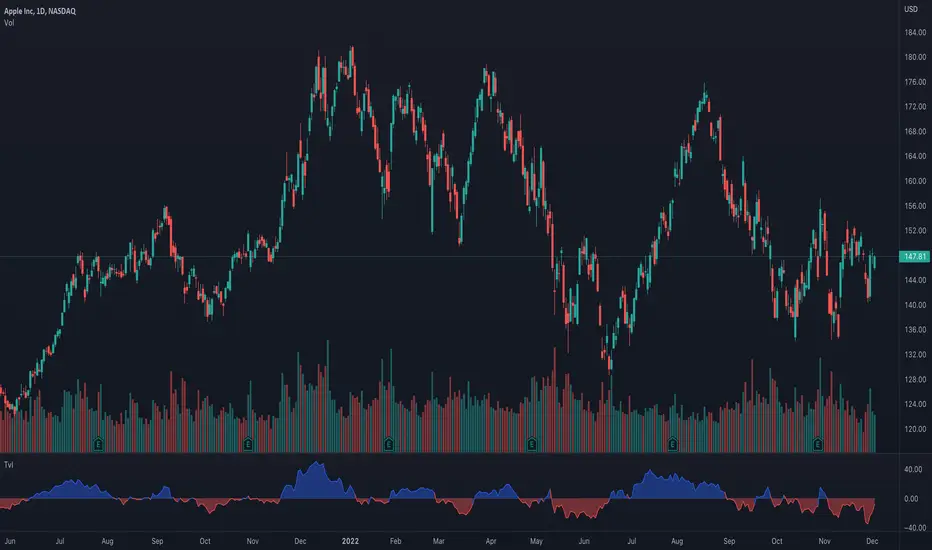
Ticker vs IndexI was exploring a simple idea how I can visualize the ticker performance against the underlying Index (or any other ticker) performance.
how it works:
When the line is moving up (blue zone), the ticker is performing better than the underlying index (e.g. SPX)(configurable).
When the line is moving down (red zone), the ticker is performing worse than the underlying index.
How to use it:
Use as confirmation always in conjunction with other (main) indicators, avoid "buy" when indicator is in the red zone
Also, crossing over the zero line is often an indication for an upcoming upward move
Try to different SMA length - default is 20 but 10 was often showing better results
(No financial advise, for testing purposes only)
Futures SignalThis is a Futures Signal Indictor works using support & resistance and market trend, it is designed for all type of markets (crypto, forex, stock etc.) and works on all commonly used timeframes (preferably on 5 Min, 15 Min Candles).
How it works Futures Signal Indictor :
Core logic behind this indicator is to finding the Support and Resistance , we find the Lower High (LH) and Higher Low (HL) to find the from where the price reversed (bounced back) and also we use a custom logic for figuring out the peak price in the last few candles. Based on the multiple previous Support and Resistance (HH, HL, LL LH) we calculate a price level, this price level is used a major a factor for entering the trade. Once we have the price level we check if the current price crosses that price level, if it crossed then we consider that as a long/short entry (based on whether it crosses resistance or support line that we calculated). Once we have pre long/short signals we further filter it based on the market trend to prevent too early/late signals. Along with this if we don't see a clear trend we do the filtering by checking how many support or resistance level the price has bounced off.
Stop Loss and Take Profit: We have also added printing SL and TP levels on the chart to make the it easier for everyone to find the SL/TP values. Script calculates the SL value by checking the previous support level for LONG trade and previous resistance level for SHORT trades. Take profit are calculated in 0.5 ratio as of now.

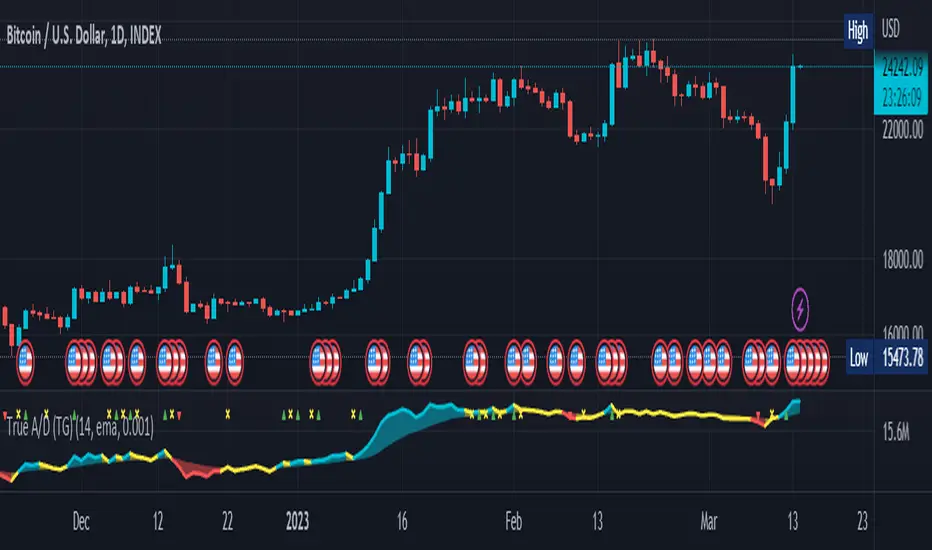
True Accumulation/Distribution (TG fork)An accumulation/distribution indicator that works better against gaps and with trend coloring.
Accumulation/Distribution was developed by Marc Chaikin to provide insight into strength of a trend by measuring flow of buy and sell volume .
The fact that A/D only factors current period's range for calculating the volume multiplier causes problem with price gaps. They are ignored or even misinterpreted.
True Accumulation/Distribution solves the problem by using True Range instead of only relying on current period's high and low.
Most of the time, True A/D reverts to producing the same values as the original A/D. The difference between True A/D and original A/D can be better seen when a gap has occurred, True A/D has handles it better than Accumulation/Distribution which a bearish close in period's range cause it to misinterpret the strong buy pressure as sell volume
The Moving Average Cloud is simply the filling between the moving average and the True A/D. This feature was inspired by D7R ACC/DIST closed-source indicator, kudos to D7R for making such neat visual indicators (but unfortunately all closed source!).
This indicator was made to extend the original work by adding MTF support and a moving average cloud and coloring.
If you like this indicator, please show the original author RezzaHmt some love:
Musashi_Katana=== Musashi-Katana ===
This tool was designed to fit my particular trading style and personal theories about the "Alchemy of the markets" and ''Harmonic Structure'.
Context
When following a Technical approach to to surf the markets, there are teachings that must be understood before reaching a confort-zone, this usually happen the possible worst way by constant experimentation, it hurts.
Here few technical hints:
- Align High timeframes with lower timeframes:
This simple concept relax a lot complexity of finding of a trend bias. Musashi-Katana allows you to use technical indicator corresponding to specific timeframes, like daily weekly or yearly. They wont change when you change the chart's timeframe, its very useful as you know where you're standing in the long term, Its quite relaxing.
- Use volume:
The constant usage of volume will allow you to sync with the market's breathing. This shows you the mass of money flowing into and out of the market, is key if you want to understand momentum. This tool can help here, as it have multi-period vwaps. You can use yearly, monthly for swing trading, and even weekly if you enjoy scalping.
Useful stuff:
- You have access to baselines, AMA and Kijun-sen with the possibility of adding ATR bands.
- AMAs come as two lines strategies for different approaches, fast medium or slow.
- You can experiment with normal and multi timeframe moving averages and other trend tools.
Final Note
If used correctly Musashi-Katana is a very powerful tool, which makes no sense as there is no correct usage. Don't add everything at the same time, experiment, combine stuff, every market is different.
Backtest every possible strategy before using it, see what works and doesn't. This gives you a lot of peace, specially while you're at the tip of the spear surfing the markets
--> I personally use this in combination with 'Musashi_Slasher (Mometum+Volatility)', as it gives me volatility and momentum in a very precise way.

Band of Filtered RS by Mustafa ÖZVERBand of Filtered RS by Mustafa ÖZVER
This code shows a range (max-min values) price may get if we get strong movements. These values is based on RSI (Relative Strange Index). And also these are calculated using RSI, if we get trades to make rsi is equal to 25 (or rsi down limit) or 75 (rsi up limit) or any value you set, how much will price value get? This code calculate these and shows these to you on graph.
This price are between these band limits because we expect cross reaction to hard movements on price.
For scalping, we can use these values as
long signal when price under down limit,
short signal when price over up limit,
But only these values can not guarantee good results for trading. BE CAREFUL
