OPEN-SOURCE SCRIPT
Ticker vs Index
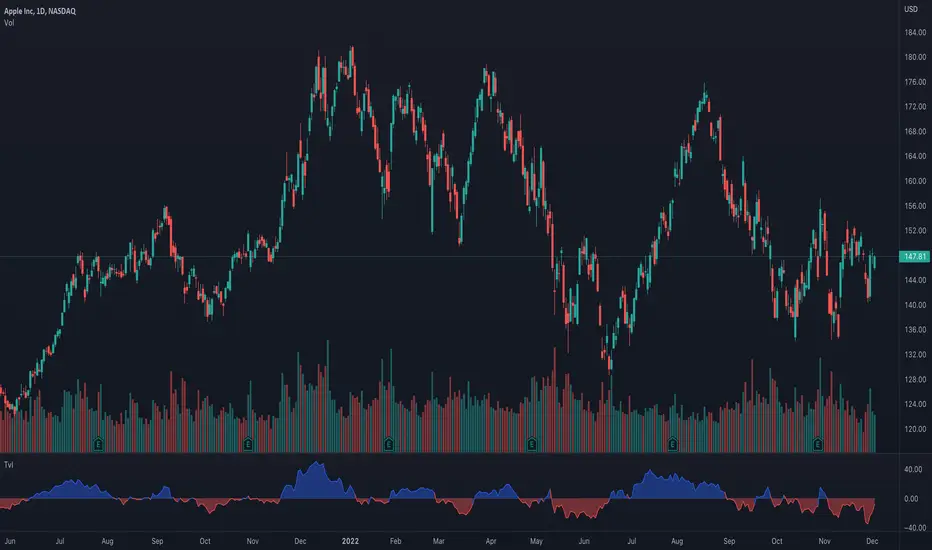
I was exploring a simple idea how I can visualize the ticker performance against the underlying Index (or any other ticker) performance.
how it works:
When the line is moving up (blue zone), the ticker is performing better than the underlying index (e.g. SPX)(configurable).
When the line is moving down (red zone), the ticker is performing worse than the underlying index.
How to use it:
Use as confirmation always in conjunction with other (main) indicators, avoid "buy" when indicator is in the red zone
Also, crossing over the zero line is often an indication for an upcoming upward move
Try to different SMA length - default is 20 but 10 was often showing better results
(No financial advise, for testing purposes only)
Açık kaynak kodlu komut dosyası
Gerçek TradingView ruhuna uygun olarak, bu komut dosyasının oluşturucusu bunu açık kaynaklı hale getirmiştir, böylece yatırımcılar betiğin işlevselliğini inceleyip doğrulayabilir. Yazara saygı! Ücretsiz olarak kullanabilirsiniz, ancak kodu yeniden yayınlamanın Site Kurallarımıza tabi olduğunu unutmayın.
Feragatname
Bilgiler ve yayınlar, TradingView tarafından sağlanan veya onaylanan finansal, yatırım, işlem veya diğer türden tavsiye veya tavsiyeler anlamına gelmez ve teşkil etmez. Kullanım Şartları'nda daha fazlasını okuyun.