TrailingStopsLibrary "TrailingStops"
This library contains functions to output trailing stop lines.
f_marketStructureStop(_restartMode, _flipMode, _restartLowIn, _restartHighIn)
Parameters:
_restartMode - Defines how the stop lines persist. Allowed values are:
"Always On" - The stop lines are always present and they just reset when they're crossed.
"Flip" - The stop lines flip when they're crossed.
"Manual" - The stop lines turn off when they're crossed, and turn back on again when _restartLowIn or _restartHighIn are passed into the function as true.
_flipMode - Defines whether the stop lines are broken by wicks or closes. Allowed values are "Wick", and "Close".
_restartLowIn - If _restartMode is "Manual", passing this parameter as true restarts the Low stop line.
_restartHighIn - If _restartMode is "Manual", passing this parameter as true restarts the High stop line.
@returns - floats for the Low and High stop line.
Trailingstoploss

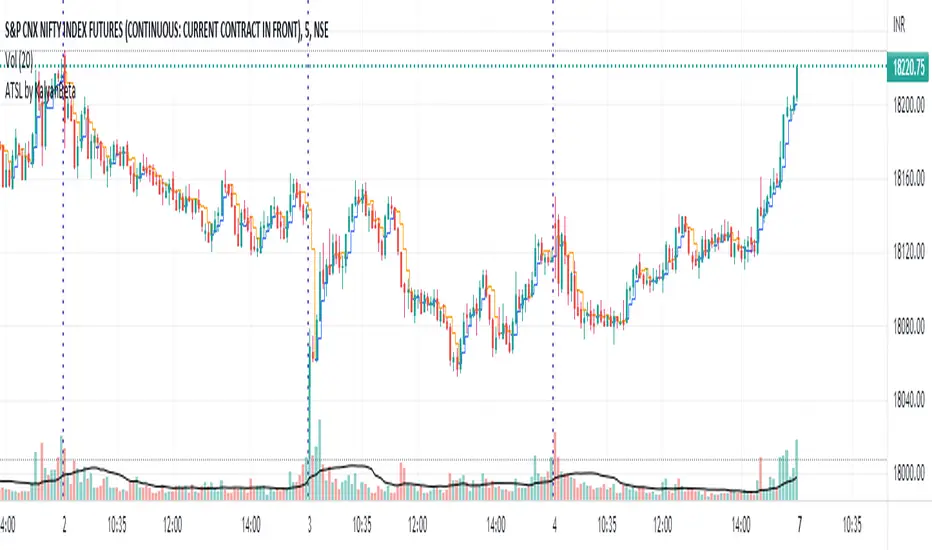
Anti-trap Trailing Stop Loss by KalyanBetaAnti-trap Trailing Stop Loss by KalyanBeta or ATSL
ATSL changes color when there it identifies price manipulation/ SL Hunting / Traps by Smart Money.
Change in color may be an exit signal for your trade in current direction.
This is a very simple indicator which can be used to predict Traps or Stop-loss hunting.
This can help in Trailing Stop-loss and in Exit decisions along with your own strategy.
ATSL may be used in all timeframes.
Please back-test it along with your strategy and then use it for Trailing the Stop-loss without getting trapped by operators and stop-loss hunters.
All the best.
Do post your feedback in comments below. Thank you.
Interactive ATR Stop-Loss [TANHEF]This indicator is "Interactive" which means some inputs can are manually added through the first click after adding the indicator to the chart (ATR Trailing Stop-loss start point). See images below for more explanation.
Why use a trailing stop-loss?
A trailing stop-loss provides an exit when price moves against you but also enables you to move the exit point further into profit when price is moving in the desired direction of a trade. The ATR (Average True Range) which is used to measure volatility, is very effective at functioning as a trailing stop loss.
Indicator Explanation
Initially when this indicator is added to the chart, you will be prompted to select where to begin the ATR Trailing Stop-loss.
For a long stop-loss, select below price.
For a short stop-loss, select above price.
After this indicator is placed, it can be modified via dragging or from within the settings by modifying the time and the price input. Or simply re-add the indicator to the chart.
The ATR Stop Loss plotted. Note that the trailing value that is considered as the stop loss value is the value of the ATR from the prior candle. The settings for the ATR calculation can be modified within the settings.
An optional fixed profit target can be added within the settings. This profit target will only actively be plotted when the ATR Trailing Stop-loss has not be hit hit yet or until the profit target has been hit.
Here shows that the profit target was hit, then later on the ATR Trailing Stop-loss was hit.
Note, trailing stop-loss will continue to be plotted until it has been hit regardless of the profit target being hit or not.
Alerts
1. 'Check' alerts to use within indicator settings (trailing stop hit and/or profit target hit).
2. Select 'Create Alert'
3. Set the condition to 'Interactive ATR''
4. Select create.

Trailing Stop SnippetThis is an example snippet that should allow for adding a trailing stop and trailing stop activation to almost any script.
You can use it by setting a trailing stop alone. This will provide you standard trailing stop functionality allowing you to lock in profits and increase your stop-loss as the price moves in your direction.
You can also set the trailing stop activation to trigger the original trailing stop at a certain level. "Once price rises 5%, set a trailing stop at break even". This would be set as 5 and 5 in the settings.

[fpemehd] Strategy TemplateHello Guys! Nice to meet you all!
This is my fourth script!
This is the Strategy Template for traders who wants to make their own strategy.
I made this based on the open source strategies by jason5480, kevinmck100, myncrypto. Thank you All!
### StopLoss
1. Can Choose Stop Loss Type: Percent, ATR, Previous Low / High.
2. Can Chosse inputs of each Stop Loss Type.
### Take Profit
1. Can set Risk Reward Ratio for Take Profit.
- To simplify backtest, I erased all other options except RR Ratio.
- You can add Take Profit Logic by adding options in the code.
2. Can set Take Profit Quantity.
### Risk Manangement
1. Can choose whether to use Risk Manangement Logic.
- This controls the Quantity of the Entry.
- e.g. If you want to take 3% risk per trade and stop loss price is 6% below the long entry price,
then 50% of your equity will be used for trade.
2. Can choose How much risk you would take per trade.
### Plot
1. Added Labels to check the data of entry / exit positions.
2. Changed and Added color different from the original one. (green: #02732A, red: #D92332, yellow: #F2E313)

ATR Trailing Stop Loss [V5]A complete ATR Trailing Stop Loss in version 5.
Features Include:
Timeframe Option
Long/Short Triggers (Green/Red Triangles)
Long/Short Conditions (Bottom Colored Line)
"Golden" Long/Short Triggers (Yellow Triangles)(Hanging Man or Shooting Star Candlestick patterns breaking ATR trailing stop)
Alerts

ATR alerts & backtestingThe Basics
Alert will trigger if the current (real time) price surpasses the high of the ATR of the previous bar. (can also be set for the Low of the ATR). Each time the follow up candle surpasses the high of the previous ATR, the background will be coloured orange. This makes back testing easier on the eye. This can be turned off.
- Colours can be changed.
- Can also set a color and alert when the current price surpasses the Low of the ATR of the previous bar.
- ATR distance can be changed.
- Can be used on different chart types.
- Can be used as entry or exits in combination with bots.
- Can display only ATR top or bottom or both.
Example
An alert will trigger if the price of the current bar surpasses the red dot (ATR) of the previous bar.
Alerts can be created on all timeframes, if this is within your Tradingview plan.
Final Words
Disclaimer: Please use it with care and at own risk. The owner of this indicator is not liable for any financial losses.
Past performance is no guarantee of future returns.

Rob Hoffman's 50/80/90/Price Trailing Stop LossA trailing stop loss method by Rob Hoffman.
Set your entry, TP, and SL.
Once price is 50% of its way to the TP, set your stop loss at the gray line.
Once price is 80% of its way to the TP, set your stop loss at the light gray line.
Once price is 90% of its way to the TP set your stop loss at the white line.

Pivot Based Trailing Maxima & Minima [LuxAlgo]This indicator returns trailing maximums/minimums and the resulting average, each resetting on the occurrence of a pivot point high/low, thus allowing to highlight past and current support and resistance levels.
Note that the user has the option to make the indicator subject to backpainting or not. Backpainting would offset the indicator output to the past and as such would be less suited for real-time applications.
🔶 USAGE
🔹 Non Backpainting
The indicator can highlight points of support and resistance given by the trailing maximum/minimum average.
An uptrend is indicated when the trailing maximum is making a new higher high, while a downtrend is indicated when the trailing minimum makes a new lower low.
🔹 Backpainting
When backpainting is enabled the historical trailing maximum/minimum and their resulting average are offset to the past. However, we extend these to the most recent bar, allowing for real-time applications of the indicator.
Users can easily analyze past trends and determine their type by observing the trailing maximum/minimum behavior. For example, trailing maximums/minimums not making new higher high/lower low would indicate a ranging market.
The frequency of new higher high/lower low can also help determine how bullish/bearish a trend was.
🔶 SETTINGS
Length: Determines the pivot high/low lookback, with higher values allowing to detect longer-term tops and bottoms.
Backpaint: Determine if the indicator is subject to backpainting. Enabling this setting would offset the returned results in the past.

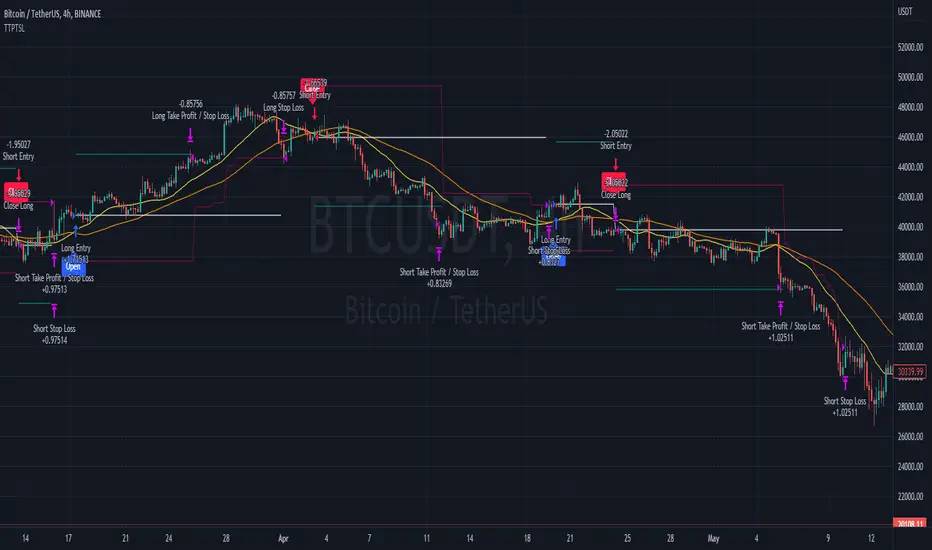
Template Trailing Strategy (Backtester)💭 Overview
+ Title: Template Trailing Strategy (Backtester)
+ Author: Iason Nikolas (jason5480)
+ License: CC BY-NC-SA 4.0
💢 What is the "Template Trailing Strategy (Backtester)" ❓
The "Template Trailing Strategy (Backtester)" (TTS) is a back-tester orchestration framework. It supercharges the implementation-test-evaluation lifecycle of new trading strategies, by making it possible to plug in your own trading idea.
While TTS offers a vast number of configuration settings, it primarily allows the trader to:
Test and evaluate your own trading logic that is described in terms of entry, exit, and cancellation conditions.
Define the entry and exit order types as well as their target prices when the limit, stop, or stop-limit order types are used.
Utilize a variety of options regarding the placement of the stop-loss and take-profit target(s) prices and support for well-known techniques like moving to breakeven and trailing.
Provide well-known quantity calculation methods to properly handle risk management and easily evaluate trading strategies and compare them.
Alert on each trading event or any related change through a robust and fully customizable messaging system.
All of the above makes TTS a practical toolkit: once you learn it, many repetitive tasks that strategy authors usually re-implement are eliminated. Using TradingView’s built-in backtesting engine makes testing and comparing ideas straightforward.
By utilizing the TTS one can easily swap "trading logic" by testing, evaluating, and comparing each trading idea and/or individual component of a strategy.
Finally, TTS, through its per-event alert management (and debugging) system, provides an automated solution that supports live trading with brokers via webhooks.
NOTE: The "Template Trailing Strategy (Backtester)" does not dictate how you can combine different indicator types. Thus, it should not be confused as a "Trading System", because it gives its user full flexibility on that end (for better or worse).
💢 What is a "Signal Indicator" ❓
"Signal Indicator" (SI) is an indicator that can output a "signal" that follows a specific convention so that the "Template Trailing Strategy (Backtester)" can "understand" and execute the orders accordingly. The SI realizes the core trading logic signaling to the TTS when to enter, exit, or cancel an order. A SI instructs the TTS "when" to enter or exit, and the TTS determines "how" to enter and exit the position once the Signal Indicator generates a signal.
A very simple example of a Signal Indicator might be a 200-day Simple Moving Average Signal. When the price of the security closes above the 200-day SMA, a SI would provide TTS with a "long entry signal". Once TTS receives the "long entry signal", the TTS will open a long position and send an alert or automated trade message via webhook to a broker, based on the Entry settings defined in TTS. If the TTS Entry settings specify a "Market" order type, then the open long position will be executed by TTS immediately. But if the TTS Entry settings specify a "Stop" order type with a 1% Stop Distance, then when the price of the security rises by 1% after the "long entry signal" occurs, the TTS will open a long position and the Long Entry alert or webhook to the broker will be sent.
🤔 How to Guide
💢 How to connect a "signal" from a "Signal Indicator" ❓
The "Template Trailing Strategy (Backtester)" was designed to receive external signals from a "Signal Indicator". In this way, a "new trading idea" can be developed, configured, and evaluated separately from the TTS. Similarly, the SI can be held constant, and the trading mechanics can change in the TTS settings and back-tested to answer questions such as, "Am I better with a different stop loss placement method, what if I used a limit order instead of a stop order to enter, what if I used 25% margin instead of trading spot market?"
To make that possible by connecting an external signal indicator to TTS, you should:
Add both your SI (e.g. "Two MA Signal Indicator" , "Click Signal Indicator" , "Signal Adapter" , "Signal Composer" ) and the TTS script to the same chart.
Open the script's Settings / Inputs dialog for the TTS.
In the 🛠️ STRATEGY group set 𝐃𝐞𝐚𝐥 𝐂𝐨𝐧𝐝𝐢𝐨𝐧𝐬 𝐌𝐨𝐝𝐞 to 🔨External (this makes TTS listen to an external signal source).
Still inside 🛠️ STRATEGY locate the 🔌𝐒𝐢𝐠𝐧𝐚𝐥 🛈 input and choose the plotted output of your SI. The option should look like: "<SI short title>:🔌Signal to TTS" .
Verbose troubleshooting & tips
If the SI does not appear in the 🔌Signal 🛈 selector, confirm both scripts are added to the same chart and the SI exposes a plotted series (title often "🔌Signal to TTS").
When using multiple SIs, pick the SI instance that actually outputs the "🔌Signal to TTS" plotted series.
Validate on the chart: when your SI changes state, the plotted "🔌Signal" series in the TTS (visible in the data window) should change accordingly.
The TTS accepts only signals that follow the tts_convention DealConditions structure. Do not attempt to feed arbitrary scalar series without using conv.getDealConditions / conv.DealConditions.
Make sure your SI composes a DealConditions value following the TTS convention (startLong, endLong, startShort, endShort — optional cancel fields). See the template below.
If the plot is present but TTS does not react, ensure the SI plot is non-repainting (or accept realtime/backtest limitations). Test on historical bars first.
Create alerts on the strategy (see the Alerts section). Use the {{strategy.order.alert_message}} placeholder in the Create Alert dialog to forward TTS messages.
💢 How to create a custom trading logic ❓
The "Template Trailing Strategy (Backtester)" provides two ways to plug in your custom trading logic. Both of them have their advantages and disadvantages.
✍️ Develop your own Customized "Signal Indicator" 💥
The first approach is meant to be used for relatively more complex trading logic. The advantages of this approach are the full control and customization you have over the trading logic and the relatively simple configuration setup by having two scripts only. The downsides are that you have to have some experience with pinescript or you are willing to learn and experiment. You should also know the exact formula for every indicator you will use since you have to write it by yourself. Copy-pasting from existing open-source indicators will get you started quite fast though.
The idea here is either to create a new indicator script from scratch or to copy an existing non-signal indicator and make it a "Signal Indicator". To create a new script, press the "Pine Editor" button below the chart to open the "Pine Editor" and then press the "Open" button to open the drop-down menu with the templates. Select the "New Indicator" option. Add it to your chart to copy an existing indicator and press the source code {} button. Its source code will be shown in the "Pine Editor" with a warning on top stating that this is a read-only script. Press the "create a working copy". Now you can give a descriptive title and a short title to your script, and you can work on (or copy-paste) the (other) indicators of your interest. Once you have the information needed to decide, define a DealConditions object and plot it like this:
import jason5480/tts_convention/ as conv
// Calculate the start, end, cancel start, cancel end conditions
dealConditions = conv.DealConditions.new(
startLongDeal = ,
startShortDeal = ,
endLongDeal = ,
endShortDeal = ,
cnlStartLongDeal = ,
cnlStartShortDeal = ,
cnlEndLongDeal = ,
cnlEndShortDeal = )
// Use this signal in scripts like "Template Trailing Strategy (Backtester)" and "Signal Composer" that can utilize its value
// Emit the current signal value according to the TTS framework convention
plot(series = conv.getSignal(dealConditions), title = '🔌Signal to TTS', color = #808000, editable = false, display = display.data_window + display.status_line, precision = 0)
You should import the latest version of the tts_convention library and write your deal conditions appropriately based on your trading logic and put them in the code section shown above by replacing the "…" part after "=". You can omit the conditions that are not relevant to your logic. For example, if you use only market orders for entering and exiting your positions the cnlStartLongDeal, cnlStartShortDeal, cnlEndLongDeal, and cnlEndShortDeal are irrelevant to your case and can be safely omitted from the DealConditions object. After successfully compiling your new custom SI script add it to the same chart with the TTS by pressing the "Add to chart" button. If all goes well, you will be able to connect your "signal" to the TTS as described in the "How to connect a "signal" from a "Signal Indicator"?" guide.
🧩 Adapt and Combine existing non-signal indicators 💥
The second approach is meant to be used for relatively simple trading logic. The advantages of this approach are the lack of pine script and coding experience needed and the fact that it can be used with closed-source indicators as long as the decision-making part is displayed as a line in the chart. The drawback is that you have to have a subscription that supports the "indicator on indicator" feature so you can connect the output of one indicator as an input to another indicator. Please check if your plan supports that feature here
To plug in your own logic that way you have to add your indicator(s) of preference in the chart and then add the "Signal Adapter" script in the same chart as well. This script is a "Signal Indicator" that can be used as a proxy to define your custom logic in the CONDITIONS group of the "Settings/Inputs" tab after defining your inputs from your preferred indicators in the VARIABLES group. Then a "signal" will be produced, if your logic is simple enough it can be directly connected to the TTS that is also added to the same chart for execution. Check the "How to connect a "signal" from a "Signal Indicator"?" in the "🤔 How to Guide" for more information.
If your logic is slightly more complicated, you can add a second "Signal Adapter" in your chart. Then you should add the "Signal Composer" in the same chart, go to the SIGNALS group of the "Settings/Inputs" tab, and connect the "signals" from the "Signal Adapters". "Signal Composer" is also a SI so its composed "signal" can be connected to the TTS the same way it is described in the "How to connect a "signal" from a "Signal Indicator"?" guide.
At this point, due to the composability of the framework, you can add an arbitrary number (bounded by your subscription of course) of "Signal Adapters" and "Signal Composers" before connecting the final "signal" to the TTS.
💢 How to set up ⏰Alerts ❓
The "Template Trailing Strategy (Backtester)" provides a fully customizable per-event alert mechanism. This means that you may have an entirely different message for entering and exiting into a position, hitting a stop-loss or a take-profit target, changing trailing targets, etc. There are no restrictions, and this gives you great flexibility.
First enable the events you want under the "🔔 ALERT MESSAGES" module. Each enabled event exposes a text area where you can craft the message using placeholders that TTS replaces with actual values when the event occurs.
The placeholder categories (exact names used by the script) are:
Chart & instrument:
{{ticker}}
{{base_currency}}
{{quote_currency}}
Entry / exit / stop / TP prices & offsets:
{{entry_price}}
{{exit_price}}
{{stop_loss_price}}
{{take_profit_price_1}} ... {{take_profit_price_5}}
{{entry+_price}}, {{entry-_price}}, {{exit+_price}}, {{exit-_price}} — Optional offset helpers (computed using "Offset Ticks")
Quantities, percents & derived quantities:
{{entry_base_quantity}} — base units at entry (e.g. BTC)
{{entry_quote_quantity}} — quote amount at entry (e.g. USD)
{{risk_perc}} — % of capital risked for that entry (multiplied by 100 when "Percentage Range " is enabled)
{{remaining_quantity_perc}} — % of the initial position remaining at close/SL
{{remaining_base_quantity}} — remaining base units at close/SL
{{take_profit_quantity_perc_1}} ... {{take_profit_quantity_perc_5}} — % sold/bought at each TP
{{take_profit_base_quantity_1}} ... {{take_profit_base_quantity_5}} — base units closed at each TP
❗ Important: the per-event alert text is injected into the Create Alert dialog using TradingView's strategy placeholder:
{{strategy.order.alert_message}}
During the creation of a strategy alert, make sure the placeholder {{strategy.order.alert_message}} exists in the "Message" box. TradingView will substitute the per-event text you configured and enabled in TTS Settings/Inputs before sending it via webhook/notification.
Tip: For webhook/broker execution, set the proper "Condition" in the Create Alert dialog (for changing-entry/exit/SL notifications use "Order fills and alert() function calls" or "alert() function calls only" as appropriate).
💢 How to execute my orders in a broker ❓
To execute your orders in a broker that supports webhook integration, you should enable the appropriate alerts in the "Template Trailing Strategy (Backtester)" first (see the "How to set up Alerts?" guide above). Then you should go to the "Create Alert/Notifications" tab check the "Webhook URL" and paste the URL provided by your broker. You have to read the documentation of your broker for more information on what messages are expected.
Keep in mind that some brokers have deep integration with TradingView so a per-event alert approach might be overkill.
📑 Definitions
This section tries to give some definitions in terms that appear in the "Settings/Inputs" tab of the "Template Trailing Strategy (Backtester)"
💢 What is Trailing ❓
Trailing is a technique where a price target follows another "barrier" price (usually high or low) by trying to keep a maximum distance from the "barrier" when it moves in only one direction (up or down). When the "barrier" moves in the other direction the price target will not change. There are as many types of trailing as price targets, which means that there are entry trailing, exit trailing, stop-loss trailing, and take-profit trailing techniques.
💢 What is a Moonbag ❓
A Moonbag in a trade is the quantity of the position that is reserved and will not be exited even if all take-profit targets defined in the strategy are hit, the quantity will be exited only if the stop-loss is hit or a close signal is received. This makes the stop-loss trailing technique in a trend-following strategy a good candidate to take advantage of a Moonbag.
💢 What is Distance ❓
Distance is the difference between two prices.
💢 What is Bias ❓
Bias is a psychological phenomenon where you make decisions based on market sentiment. For example, when you want to enter a long position you have a long bias, and when you want to exit from the long position you have a short bias. It is the other way around for the short position.
💢 What is the Bias Distance of a price target ❓
The Bias Distance of a price target is the distance that the target will deviate from its initial price. The direction of this deviation depends on the bias of the market. For example, suppose you are in a long position, and you set a take-profit target to the local highest high. In that case, adding a bias distance of five ticks will place your take-profit target 5 ticks below this local highest high because you have a short bias when exiting a long position. When the bias is long the bias distance will be added resulting in a higher target price and when you have a short bias the bias distance will be subtracted.
⚙️ Settings
In the "Settings/Inputs" tab of the "Template Trailing Strategy (Backtester)", you can find all the customizable settings that are provided by the framework. The variety of those settings is vast; hence we will only scratch the surface here. However, for every setting, there is an information icon 🛈 where you can learn more if you mouse over it. The "Settings/Inputs" tab is divided into ten main groups. Each one of them is responsible for one module of the framework. Every setting is part of a group that is named after the module it represents. So, to spot the module of a setting find the title that appears above it comes with an emoji and uppercase letters. Some settings might have the same name but belong to different modules e.g. "Tgt Dist Mtd" (Target Distance Method). Some settings are indented, which means that they are closely related to the non-indented setting above. Usually, indented settings provide further configuration for one or more options of the non-indented setting above. The groups that correspond to each module of the framework are the following:
🗺️ Quick Module Cross-Reference (use emojis to jump to setting groups)
📆 FILTERS — session, date & weekday filters
🛠️ STRATEGY — internal vs external deal-conditions; pick the signal source
🔧 STRATEGY – INTERNAL — built-in Two MA logic for demonstration purposes
🎢 VOLATILITY — ATR / StDev update modes
🔷 ENTRY — entry order types & trailing
🎯 TAKE PROFIT — multi-step TP and trailing rules
🛑 STOP LOSS — stop placement, move-to-breakeven, trailing
🟪 EXIT — exit order types & cancel logic
💰 QUANTITY/RISK MANAGEMENT — position sizing, moonbag, limits
📊 ANALYTICS — stats, streaks, seasonal tables
🔔 ALERT MESSAGES — per-event alert templates & placeholders
😲 Caveats
💢 Does "Template Trailing Strategy (Backtester)" have repainting behavior? ❓
The answer is that the "Template Trailing Strategy (Backtester)" does not repaint as long as the "Signal Indicator" that is connected also does not repaint. If you developed your own SI make sure that you understand and know how to prevent this behavior. The publication by @PineCoders here will give you a good idea on how to avoid most of the repainting cases.
⚠️ There is an exception though, when the "Enable Trail⚠️💹" checkbox is checked, the Take Profit trailing feature is enabled, and a tick-based approach is used, meaning that after a while, when the TradingView discards all the real-time data, assumptions will be made by the backtesting engine that will cause a form of repainting. To avoid making false assumptions please disable this feature in the early stages and evaluate its usefulness in your strategy later on, after first confirming the success of the logic without this feature. In this case, consider turning on the bar magnifier feature. This way you will get more accurate backtest results when the Take Profit trailing feature is enabled.
💢 Can "Template Trailing Strategy (Backtester)" satisfy all my trading strategies ❓
While this framework can satisfy quite a large number of trading strategies there are cases where it cannot do so. For example, if you have a custom logic for your stop-loss or take-profit placement, or if you want to dollar cost average, then it might be better to start a new strategy script from scratch.
⚠️ It is not recommended to copy the official TTS code and start developing unless you are a Pine wizard! Even in that case, there is a stiff learning curve that might not be worth your time. Last, you must consider that I do not offer support for customized versions of the TTS script and if something goes wrong in the process you are all alone.
💝 Support & Feedback
For feedback, bug reports, or feature requests, contact me via TradingView PM or use the script comments.
Note: The author's personal links and contact are available on the TradingView profile.
🤗 Thanks
Special thanks to the welcoming community members, who regularly gave feedback all those years and helped me to shape the framework as it is today! Thanks everyone who contributed by either filing a "defect report" or asking questions that helped me to understand what improvements were necessary to help traders.
Enjoy!
Jason

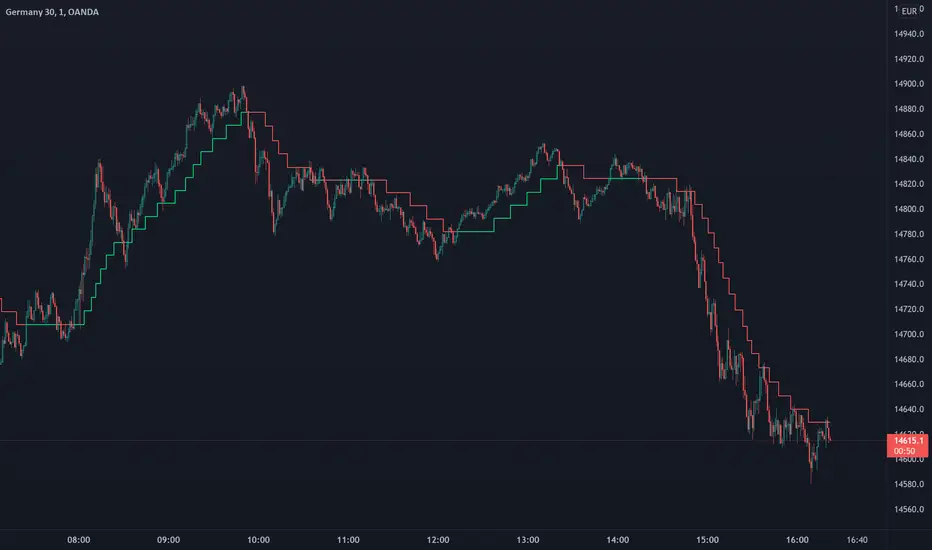
Trend Step - TrailingTrend Step - Trailing Stop is a moving average-based trailing stop that moves in pre-defined steps. In this way, the user can set the number of pips/points they want the trailing to move in relation to the movements in the average. You can also see it as trend steps. Every step represents the trend movement.
Usage
Use it as a trailing stop or as a trend direction tool.
Disclaimer: No financial advice, only for educational/entertainment purposes.
ATR Bands with vortex indicator [LM]Hello traders,
I would like to present you ATR Bands with vortex indicator. This indicator is different than my others I used not that known vortex indicator as a entry indicator, and atr bands I have used as a exit indicator.
You can see 2 set of bands with different multiplicator, first is used as first target profit, stop loss and second as a second target
There are to modes that takes, first is static mode that gives you lines with 1st, 2nd target profit and in red color stop loss
In the static mode you can also turn off extending line he price reach the level:
Second mode is tracking atr first band with candle offset of your choosing:
The trailing functionality is not working 100% but I as thinking to share it anyway and see maybe some feedback and meantime I will fix the trailing behavior.
Settings:
Genreal settings - basic setting of source for atr bands, line settings,
First atr bands setting
Second atr bands setting
Vortex setting
Cheers and Happy Xmas,
Lukas

[Fedra Algotrading Strategy Trailing Stop]Algotrading strategy optimized for cryptocurrencies. Originally conceived to trade automatically through bots (that's how I use it), it also works to get signals and trade manually in any exchange.
It works in spot.
Buy the dip:
Attempts to buy on the dip, finding entries when the price makes abrupt dips that break deviation of the linear regression of the last periods.
Trend Detection:
Determines whether the market is in an uptrend or downtrend by crossing 2 SMAs + super trend in different temporalities. This affects the performance of the strategy. It works as a filter to avoid making entries in a downtrend. It also includes other advanced filters to find the best selling price on losses.
Break Even:
If the market enters a downtrend with an open trade, the Break Even sell is triggered, (configurable, default 1.5%). The intention is to close the trade as soon as possible, but without losses. The value of 1.5% is intended to cover commission costs and a possible spread.
Conditional SL Level: Determines a tolerance level in %, from which it is allowed to sell at a loss, while the price is above this level, the scrip will only sell at a profit.
% Trailing Stop Loss. The Stop Loss is placed a % below the price and accompanies it in the rises to make the most of an uptrend.
It allows you to easily configure the backtest period to optimize the parameters for consistent results.
The strategy calculates by default a commission of 0.1% on each trade to make the backtest more "pessimistic".
Includes advanced features for compatibility with different bots platforms in the market.
Risk management by % of equity or by maximum series of losses.
////////////////SPANISH///////////////////
Estrategia de Algotrading optimizada para criptomonedas. Originalmente concebida para operar de manera automática mediante bots (así la utilizo yo), funciona también para obtener señales y operar manualmente en cualquier exchange.
Funciona en spot.
Buy the dip:
Intenta comprar en el dip, encontrando entradas cuando el precio hace bajadas abruptas que rompen la desviación de la regresión lineal de los últimos periodos
Detección de Trend:
Determina si el mercado tiene una tendencia alcista o bajista mediante el cruce de 2 SMAs + super trend en distintas temporalidades. Esto afecta el funcionamiento de la estrategia. Funciona como filtro para evitar realizar entradas en una tendencia bajista. Incluye también otros filtros avanzados para encontrar el mejor precio de venta en pérdidas.
Break Even:
Si el mercado entra en tendencia bajista con una operación abierta, se activa la venta en Break Even, (configurable, por defecto 1.5%). La intención es cerrar la operación lo antes posible, pero sin pérdidas. El valor de 1.5% está pensado para cubrir los costos de comisiones y un posible spread.
Nivel de SL Condicional: Determina un nivel de tolerancia en %, a partir del cual se permite la venta en pérdidas, mientras el precio esté sobre este nivel, el scripto sólo venderá en ganancias
% Trailing Stop Loss. El Stop Loss se ubica un % debajo del precio y lo acompaña en las subidas para aprovechar al máximo un uptrend.
Permite configurar de manera muy fácil el periodo de backtest para optimizar los parámetros para resultados consistentes.
La estrategia calcula por defecto una comisión de 0.1% en cada operación para que el backtest sea más "pesimista".
Incluye funciones avanzadas para compatibilidad con diferentes plataforma de bots del mercado.
Administración de risego por % del capital o por máxima serie de pérdidas

Macd Divergence + MTF EMA MACD Divergence + Multi Time Frame EMA
This Strategy uses 3 indicators: the Macd and two emas in different time frames
The configuration of the strategy is:
Macd standar configuration (12, 26, 9) in 1H resolution
10 periods ema, in 1H resolution
5 periods ema, in 15 minutes resolution
We use the two emas to filter for long and short positions.
If 15 minutes ema is above 1H ema, we look for long positions
If 15 minutes ema is below 1H ema, we look for short positions
We can use an aditional filter using a 100 days ema, so when the 15' and 1H emas are above the daily ema we take long positions
Using this filter improves the strategy
We wait for Macd indicator to form a divergence between histogram and price
If we have a bullish divergence, and 15 minutes ema is above 1H ema, we wait for macd line to cross above signal line and we open a long position
If we have a bearish divergence, and 15 minutes ema is below 1H ema, we wait for macd line to cross below signal line and we open a short position
We close both position after a cross in the oposite direction of macd line and signal line
Also we can configure a Take profit parameter and a trailing stop loss

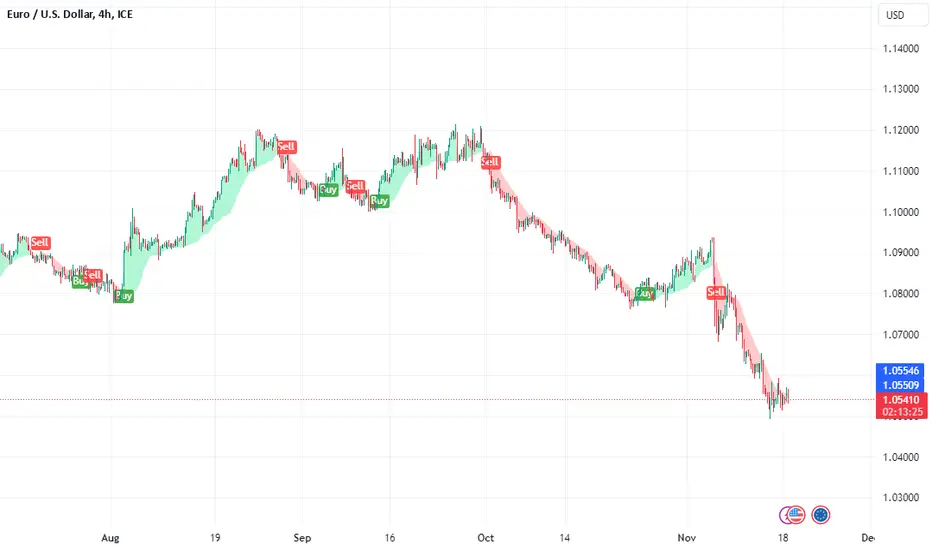
IZCI [xaurr]Yet another trailing stop loss script, using optional percentage or atr values to follow the last price.
Green area: bullish , long
Red area: bearish, short
IZCI means trailing in Turkish.
If you find it usefull, please like it.
Good Luck :)
Trailing Stop LossThis script demonstrate how to make a Training Stop Loss to "ride the wave". In comparison to classic Stop Loss this strategy follows the price upwards (for long positions) and when price drops by a fixed percentage then you exit your position.

Trailing Take Profit Trailing Stop LossThis script demonstrated a dual trailing take profit and stop loss strategy. Where you take 50% (configurable) of the profit when a price level is reached and then you get the rest when a trailing stop loss is hit.
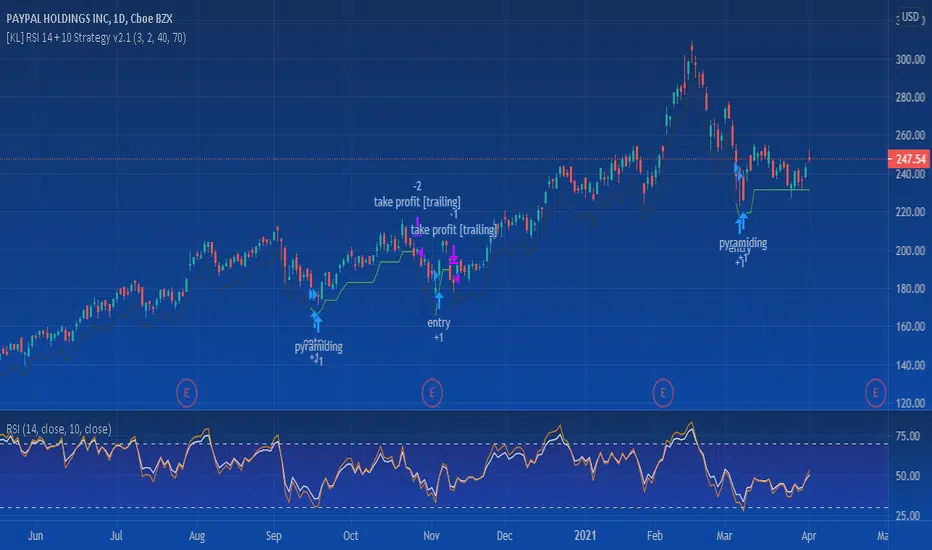
[KL] RSI 14 + 10 StrategyThis strategy uses RSI14 for entry and exit signals; applies RSI10 for confirmation. The thresholds can adjusted in Settings.
Trailing stop can also be applied if wanted.
Tested on daily/hourly charts.
SNAP BACK 2.0 Strategy
This strategy is designed to allow you to catch the bounce or "SNAP Back" of an equity that has been in a trend.
1) Once the moving averages are in the order of 200SMA > 50 SMA > 34EMA > 20SMA > 8EMA (or reverse for and uptrend), the strategy is setup.
2) Next you wait for a trigger of the closing price crossing the 8EMA, while there is a desired gap size between the 8EMA and the 20SMA (2-10% of stock value preferred).
3) Exit position based on target profit reached (conservative sell half at 34EMA and engage a trailing stop loss for remainder or set static limit) or price crosses 8EMA or stop loss%
*)This code also allows you to determine your desired backtesting date compliments of alanaster
This code is the product of many hours of hard work on the part of the greater tradingview community. The credit goes to everyone in the community who has put code out there for the greater good.
The idea for the coding came from a video I watched on YouTube presented by TradeStation called Snap Back - thank you guys for the inspiration.
UPDATE: I have coded the other side of the strategy to allow you to take advantage of the same set-up in an uptrend for Short plays. You can turn the up or downsides on, off, or both.
The main intent is to catch the bounces of a falling stock. However, I have found that you can do the inverse and catch the drops in a rising stock (the latter is not as reliable). This also tends to work better on less volatile stocks. I have included a large volume of user defined conditions and display entry and exit conditions on the chart to see how your choices are impacting the script.

Scalping using RSI 2 indicator with TP and TSLThis study implements a simply scalping using the RSI (calculated on two periods), the slopes of two MAs (EMA or SMA) having different lengths (by default, I use 50 and 200).
A take profit (%) and a trailing stop loss (%) are used.
Entry conditions:
.) Fast MA > Slow MA and Price > Slow MA and RSI < Oversold Threshold ------> go Long
.) Fast MA < Slow MA and Price < Slow MA and RSI > Overbought Threshold ------> go Short
Exit conditions:
.) Long entry condition is true and (close >= TP or close <= TSL) ----> close short position
.) Short entry condition is true and (close <= TP or close >= TSL) ----> close long position
The strategy performed best on Bitcoin and the most liquid and capitalized Altcoins but works excellent on volatile assets, mainly if they often go trending.
Works best on 3h - 4h time frame.
There's also an optional Volatility filter, which opens the position only if the difference between the two slopes is more than a specific value, which can be set in the study inputs. The purpose is not opening positions if the price goes sideways and the noise is way > than the signal.
Note:
.) the RSI length is 2;
.) the oversold Threshold is 90%;
.) the overbought Threshold is 10%;
.) by default, the take profit per cent is 0.5%;
.) by default, the trailing stop loss per cent is 0.5%;
.) by default, the fast MA length is 50;
.) by default, the slow MA length is 200;
.) by default, the MA used is EMA.
Cheers.

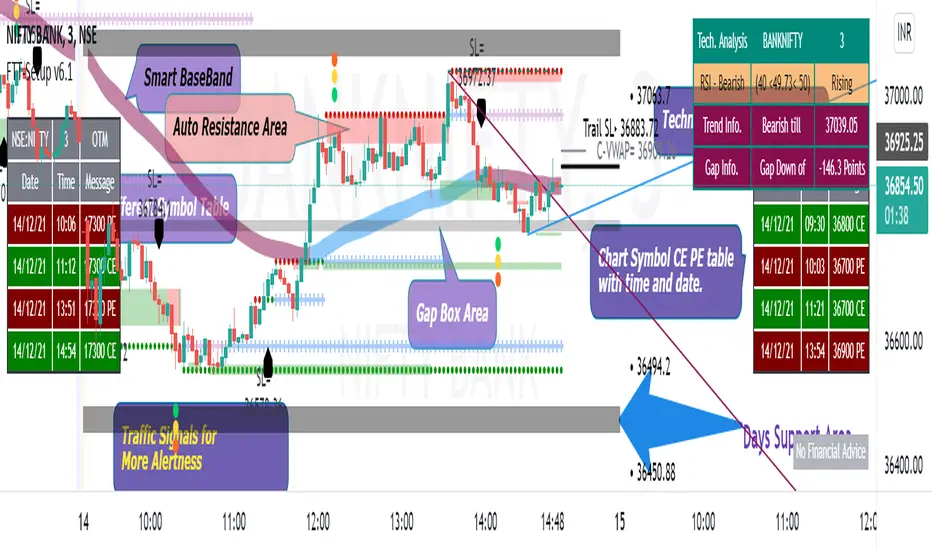
Fishing The Trend - SetupFishing The Trend - Setup
HOW Does it work ?
The name itself says we must have a trading setup for ease of trading for getting the most from the market.
i.e. Combining the most useful indicator under one roof...
Fishing The Trend - Setup have following ::-
1) IntraDay Range.
2) Four Friends.
3) Fishing The Trend.
4) Multi Time Frame - Custom VWAP.
5) RSI based SMA.
1) Intraday Range
HOW Does it work ?
For calculating the average most probable range for any plotted security, it plots 2 bands higher band and a lower band for a particular range using the default ADR. This indicator is on - as default.
# Upper and Lower band act as support and resistance , user may see a reversal in trend from these bands
# If the price breaks these bands, don't take a trade expecting a reversal
# These bands are calculated by averaging the previous x number of days' highs and lows of the security.
2) Four Friends
HOW Does it work ?
Plotting different EMA for finding the direction of Trend / Market, There are actually 5 EMAs- F1 = 20 EMA, F2 = 50 EMA, F3 = 100EMA, F4= 150, and Trend = 200-EMA. Usually 200 EMA is used to find the trend of market whether bearish / bullish, if market is above 200 ema than we may say its bullish and below 200 ema its bearish. The 50 EMA and 100 EMA works as best pullbacks in the trending market, user can configure as per his trading style and method. This indicator can be changed to multi timeframe as required. User can plot lower time frame data onto higher time or vice-versa for finding better opportunities for early trend detection, also the user have the option to use feature of non-repainting or vice versa. The default Color MA option is un=ticked, means plotting 5 different color EMAs, If the user ticks this feature, the whole 5 EMA color will change into red or orange as per direction of closing candle, user can change color as per his / her color combination. Default plotting time is of 1 min. This second indicator is off by default - user have to tick-it to activate it
3) Fishing The Trend
HOW Does it work ?
The code uses dynamic current levels to identify trend, This indicator is using SuperTrend, ATR and relatively Smoothened ATR for
early trend reversal detection to determine the trend and direction so that a fruitful decision can be made.
To Indicate the strength of the trendline, The standard calculations of SuperTrend, along with multiple smoothen ATR results are clubbed determine the direction, a step ahead. However, the indicator is not appropriate for all the situations. It works when the market is trending. Hence it is best to use for short-term technical analysis . SuperTrend uses only the two parameters of ATR and multiplier which are not sufficient under certain conditions to predict the accurate direction of the market. Here in this indicator ATR value is not editable and after long backtests the best ATR value is kept that helps the indicator working very well.
The default setting is best for use, but user can customize the Multiplier for his own fine tunings, So once the Levels are matched, a Long / Short suggestion is plotted. Best Time Frames to use : starting from 1, 3, 5, 15, 30 Mins and so on... to determine Trend.
Long = L and Short = S.
Where and how to use?
The main use of this indicator is quick scalping and Intra-day trading. The Indicator shows the option to show Long/Short Signals which the use can be turned on or off. The indicator shows a very useful option for early detection of the ongoing trend whether there will be reversal of trend or not ?
Stop Loss - That should be done by following ones risk appetite, Ideally the High of the Previous Candle should be the stop loss for
the Long / Short but everyone has their own Risk Management Strategies based on the capital deployed.
by default this comes on..
4) Multi Time Frame - Custom VWAP.
HOW Does it work ?
VWAP = The volume weighted average price (VWAP) is a trading benchmark used by traders that gives the average price a
security has traded at throughout the day, based on both volume and price. It is important because it provides traders with insight into both the trend and value of a security.
This indicator is programmed for using vwap for spot indices / securities not having volume calculations but have futures, specially banknifty and nifty of Indian markets. User has option to change the plotting timeframe as per his requirements for checking the trend under vwap or over vwap. The user have to type the equivalent script symbol in the space provided to calculate the vwap of that particular security and plot on the non-volume script. Seems confusing !!!! have a look
at example..
eg. - if you have chart of banknifty spot and u want to place vwap on in then just write security name in the blank field banknifty future of continuous contract running month " BANKNIFTY1! " Futures Chart... that's it and u will have futures vwap plotting on spot chart... this can give user a definite idea about the vwap line. User have option to change color of bar and change color of the
vwap line which is plotted.
By default this comes off..
Note = This indicator changes bar color
5) RSI based SMA
HOW Does it work ?
# This indicator is for user using RSI, The twist is that not only it uses RSI but also simple moving average, So this makes the user more safe as it is a combination of RSI and SMA.
# Multi-colored ----> Green/Red/Yellow user can change ..moving average of choice
# user can change overbought / over sold values of RSI as required. The time frame here is fixed.
* There is an On/Off Option for each Indicator.
Disclaimer : There could be scenarios when the candle is shown as a long or short and then the candle turns into opposite direction red/green. In such scenarios , Please refer to the just preceding candle and the early detection signal and if this candle is moving into positive direction only then go for long, Similarly opposite for Short, the value of multiplier 1.0 is determined using series of back test across various assets with different time frames.
User Options : Choice of turning on / off the Long / Short Labels and early detection/StopLoss Option can also be activated or deactivated.
Visual Checks - The user could manually validate the back test results on various assets they would like to use this strategy on before putting it live.
Usage/Markets : Index Trading / Equities and also well with Commodities and Currencies
How to get access
Please click on the link / email available in the signature or send me a private message to get access.
Feedback
Please click on the link/email in the signature or send me a private message for suggestions/feedbacks.
Percent Drop from Highest HighBuy and hold investors may decide to use trailing stops to protect profits and capital from market crashes, especially during bull markets.
The purpose of this indicator is to hep investors to identify a location to place them. The indicator plots the highest high from 'x' bars ago. It then plots a trailing stop loss 'y' percent below that line.
The indicator enables its users to input different 'x' and 'y' values to observe what they think works best for them in different markets.
Users might choose to pair the indicator with trend confirming indicators, such as moving average cross overs, to determine that the market is trending and not ranging.
There is no magic in this indicator, only maths. Like every indicator, it has no ability to predict anything. Just because the market is doing one thing now, it might do something different later. The past does not equal the present nor the future. Make your own decisions and be responsible for them.
All the best to you and your family.

Pinescript v4 - The Holy Grail (Trailing Stop)After studying several other scripts, I believe I have found the Holy Grail! (Or perhaps I've just found a bug with Tradingview's Pinescript v4 language) Anyhow, I'm publishing this script in the hope that someone smarter than myself could shed some light on the fact that adding a trailing stop to any strategy seems to make it miraculously...no that's an understatement...incredulously, stupendously, mind-bendingly profitable. I'm talking about INSANE profit factors, higher than 200x, with drawdowns of <10%. Sounds too good to be true? Maybe it is...or you could hook it up to your LIVE broker, and pray it doesn't explode. This is an upgraded version of my original Pin Bar Strategy.
Recommended Chart Settings:
Asset Class: Forex
Time Frame: H1
Long Entry Conditions:
a) Exponential Moving Average Fan up trend
b) Presence of a Bullish Pin Bar
c) Pin Bar pierces the Exponential Moving Average Fan
Short Entry Conditions:
a) Exponential Moving Average down trend
b) Presence of a Bearish Pin Bar
c) Pin Bar pierces the Exponential Moving Average Fan
Exit Conditions:
a) Trailing stop is hit
b) Moving Averages cross-back (optional)
c) It's the weekend
Default Robot Settings:
Equity Risk (%): 3 //how much account balance to risk per trade
Stop Loss (x*ATR, Float): 0.5 //stoploss = x * ATR, you can change x
Stop Loss Trail Points (Pips): 1 //the magic sauce, not sure how this works
Stop Loss Trail Offset (Pips): 1 //the magic sauce, not sure how this works
Slow SMA (Period): 50 //slow moving average period
Medium EMA (Period): 18 //medium exponential moving average period
Fast EMA (Period): 6 //fast exponential moving average period
ATR (Period): 14 // average true range period
Cancel Entry After X Bars (Period): 3 //cancel the order after x bars not triggered, you can change x
Backtest Results (2019 to 2020, H1, Default Settings):
AUDUSD - 1604% profit, 239.6 profit factor, 4.9% drawdown (INSANE)
NZDUSD - 1688.7% profit, 100.3 profit factor, 2.5% drawdown
GBPUSD - 1168.8% profit, 98.7 profit factor, 0% drawdown
USDJPY - 900.7% profit, 93.7 profit factor, 4.9% drawdown
USDCAD - 819% profit, 31.7 profit factor, 8.1% drawdown
EURUSD - 685.6% profit, 26.8 profit factor, 5.9% drawdown
USDCHF - 1008% profit, 18.7 profit factor, 8.6% drawdown
GBPJPY - 1173.4% profit, 16.1 profit factor, 7.9% drawdown
EURAUD - 613.3% profit, 14.4 profit factor, 9.8% drawdown
AUDJPY - 1619% profit, 11.26 profit factor, 9.1% drawdown
EURJPY - 897.2% profit, 6 profit factor, 13.8% drawdown
EURGBP - 608.9% profit, 5.3 profit factor, 9.8% drawdown (NOT TOO SHABBY)
As you can clearly see above, this forex robot is projected by the Tradingview backtester to be INSANELY profitable for all common forex pairs. So what was the difference between this strategy and my previous strategies? Check my code and look for "trail_points" and "trail_offset"; you can even look them up in the PineScript v4 documentation. They specify a trailing stop as the exit condition, which automatically closes the trade if price reverses against you.
I however suspect that the backtester is not properly calculating intra-bar price movement, and is using a simplified model. With this simplfied approach, the trailing stop code becomes some sort of "holy grail" generator, making every trade entered profitable.
Risk Warning:
This is a forex trading strategy that involves high risk of equity loss, and backtest performance will not equal future results. You agree to use this script at your own risk.
Hint:
To get more realistic results, and *maybe* overcome the intrabar simulation error, change the settings to: "Stop Loss Trail Points (pips)": 100
I am not sure if this eradicates the bug, but the entries and exits look more proper, and the profit factors are more believable.
