IDX - 5UPThe UDX-5UP is a custom indicator designed to assist traders in identifying trends, entry and exit signals, and market reversal moments with greater accuracy. It combines price analysis, volume, and momentum (RSI) to provide clear buy ("Buy") and sell ("Sell") signals across any asset and timeframe, whether you're a scalper on the 5M chart or a swing trader on the 4H chart. Inspired by robust technical analysis strategies, the UDX-5UP is ideal for traders seeking a reliable tool to operate in volatile markets such as cryptocurrencies, forex, stocks, and futures.
Components of the UDX-5UP
The UDX-5UP consists of three main panels that work together to provide a comprehensive view of the market:
Main Panel (Price):
Pivot Supertrend: A dynamic line that changes color to indicate the trend. Green for an uptrend (look for buys), red for a downtrend (look for sells).
SMAs (Simple Moving Averages): Two SMAs (8 and 21 periods) to confirm the trend direction. When the SMA 8 crosses above the SMA 21, it’s a bullish signal; when it crosses below, it’s a bearish signal.
Entry/Exit Signals: "Buy" (green) and "Sell" (red) labels are plotted on the chart when entry or exit conditions are met.
Volume Panel:
Colored Volume Bars: Green bars indicate dominant buying volume, while red bars indicate dominant selling volume.
Volume Moving Average (MA 20): A blue line that helps identify whether the current volume is above or below the average, confirming the strength of the movement.
RSI Panel:
RSI (Relative Strength Index): Calculated with a period of 14, with overbought (70) and oversold (30) lines to identify momentum extremes.
Divergences: The indicator detects divergences between the RSI and price, plotting signals for potential reversals.
How the UDX-5UP Works
The UDX-5UP uses a combination of rules to generate buy and sell signals:
Buy Signal ("Buy"):
The Pivot Supertrend changes from red to green.
The SMA 8 crosses above the SMA 21.
The volume is above the MA 20, with green bars (indicating buying pressure).
The RSI is rising and, ideally, below 70 (not overbought).
Example: On the 4H chart, the price of Tether (USDT) is at 0.05515. The Pivot Supertrend turns green, the SMA 8 crosses above the SMA 21, the volume shows green bars above the MA 20, and the RSI is at 46. The UDX-5UP plots a "Buy".
Sell Signal ("Sell"):
The Pivot Supertrend changes from green to red.
The SMA 8 crosses below the SMA 21.
The volume is above the MA 20, with red bars (indicating selling pressure).
The RSI is falling and, ideally, above 70 (overbought).
Example: On the 4H chart, the price of Tether rises to 0.05817. The Pivot Supertrend turns red, the SMA 8 crosses below the SMA 21, the volume shows red bars, and the RSI is above 70. The UDX-5UP plots a "Sell".
RSI Divergences:
The indicator identifies bullish divergences (price makes a lower low, but RSI makes a higher low) and bearish divergences (price makes a higher high, but RSI makes a lower high), plotting alerts for potential reversals.
Adjustable Settings
The UDX-5UP is highly customizable to suit your trading style:
Pivot Supertrend Period: Default is 2. Increase to 3 or 4 for more conservative signals (fewer false positives, but more lag).
SMA Periods: Default is 8 and 21. Adjust to 5 and 13 for smaller timeframes (e.g., 5M) or 13 and 34 for larger timeframes (e.g., 1D).
RSI Period: Default is 14. Reduce to 10 for greater sensitivity or increase to 20 for smoother signals.
Overbought/Oversold Levels: Default is 70/30. Adjust to 80/20 in volatile markets.
Display Panels: You can enable/disable the volume and RSI panels to simplify the chart.
How to Use the UDX-5UP
Identify the Trend:
Use the Pivot Supertrend and SMAs to determine the market direction. Uptrend: look for buys. Downtrend: look for sells.
Confirm with Volume and RSI:
For buys: Volume above the MA 20 with green bars, RSI rising and below 70.
For sells: Volume above the MA 20 with red bars, RSI falling and above 70.
Enter the Trade:
Enter a buy when the UDX-5UP plots a "Buy" and all conditions are aligned.
Enter a sell when the UDX-5UP plots a "Sell" and all conditions are aligned.
Plan the Exit:
Use Fibonacci levels or support/resistance on the price chart to set targets.
Exit the trade when the UDX-5UP plots an opposite signal ("Sell" after a buy, "Buy" after a sell).
Tips for Beginners
Start with Larger Timeframes: Use the 4H or 1D chart for more reliable signals and less noise.
Combine with Other Indicators: Use the UDX-5UP with tools like Fibonacci or the Candles RSI (another powerful indicator) to confirm signals.
Practice in Demo Mode: Test the indicator in a demo account before using real money.
Manage Risk: Always use a stop-loss and don’t risk more than 1-2% of your capital per trade.
Why Use the UDX-5UP?
Simplicity: Clear "Buy" and "Sell" signals make trading accessible even for beginners.
Versatility: Works on any asset (crypto, forex, stocks) and timeframe.
Multiple Confirmations: Combines price, volume, and momentum to reduce false signals.
Customizable: Adjust the settings to match your trading style.
Author’s Notes
The UDX-5UP was developed based on years of trading and technical analysis experience. It is an evolution of tested strategies, designed to help traders navigate volatile markets with confidence. However, no indicator is infallible. Always combine the UDX-5UP with proper risk management and fundamental analysis, especially in unpredictable markets. Feedback is welcome – leave a comment or reach out with suggestions for improvements!
Tradingsignals

Multi-Timeframe Stochastic RSI ArrowsMulti-Timeframe Stochastic RSI Arrows Indicator by The Venetian
Dear Moderators before you torch me alive theres nothing groundbreaking just very handy indicator for some users.
This indicator provides traders with a jet fighter-style heads-up display for market momentum across multiple timeframes. By displaying Stochastic RSI directional arrows for 12 different timeframes simultaneously, it offers a comprehensive view of market conditions without requiring multiple chart windows.
How It Works
The indicator calculates the Stochastic RSI for each of 12 common timeframes (1m to 3M) and represents directional movements with intuitive arrows:
- ▲ Green up arrow = Rising momentum
- ▼ Red down arrow = Falling momentum
- ◄► Yellow horizontal arrows = Flat/sideways momentum
- ► Gray right arrow = Just peaked (crossed above overbought)
- ◄ Gray left arrow = Just bottomed (crossed below oversold)
Each timeframe's status appears with its label (e.g., "1m ▲") in a clean, vertically-stacked display using ATR-based spacing to maintain consistent visual appearance regardless of price scale.
Key Features
- ATR-Based Spacing : Uses Average True Range to maintain consistent distances between labels even as chart scale changes
- Multi-Timeframe Analysis: Easily spot divergences and confluences across timeframes (1m, 3m, 5m, 15m, 30m, 1h, 2h, 4h, 1D, 1W, 1M, 3M)
- Sensitivity Control: Adjust flat detection sensitivity to filter out noise
- Customisable Appearance: Modify arrow size, vertical spacing, and show/hide timeframe labels
- Overbought/Oversold Detection: Highlights when momentum has peaked or bottomed at extreme levels
- Trading Applications
- Trend Alignment: Quickly identify when multiple timeframes align in the same direction
- Divergence Detection: Spot when shorter timeframes begin to shift against longer ones
- Entry/Exit Timing: Use crossovers of significant timeframes as potential signals
- Market Context: Maintain awareness of the bigger picture while trading shorter timeframes
This indicator doesn't break new ground technically but excels in presenting complex multi-timeframe information in a clean, actionable format — much like a pilot's heads-up display provides critical information at a glance. The ATR-based positioning ensures consistent visibility across different instruments and market conditions.
Great effort has been made for this script to adhere to TradingView's Pine Script house rules and focuses on trader usability rather than introducing novel technical concepts.

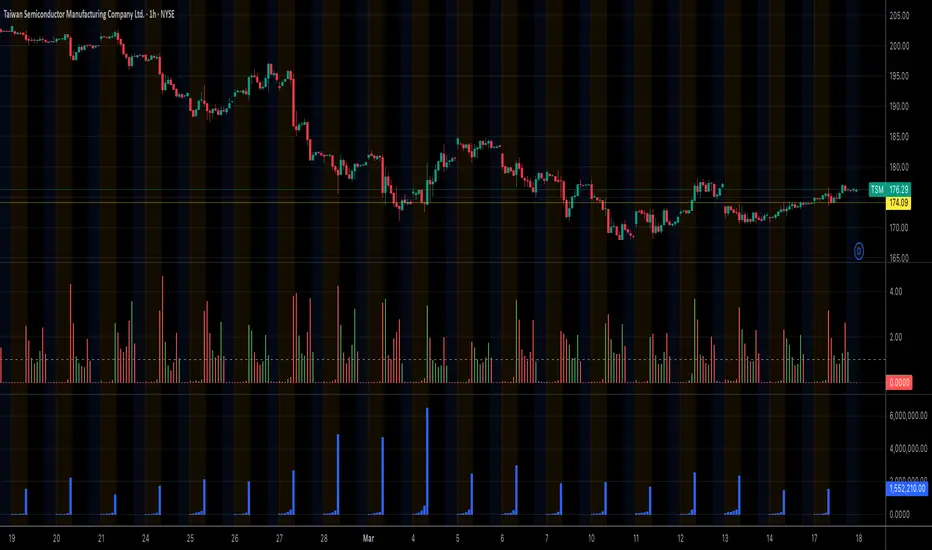
Premarket VolumeTimeframe: Use on intraday charts (e.g., 1-minute, 5-minute) with extended hours enabled.
Behavior: The plot will appear at 4:00 AM, grow as volume accumulates, and disappear at 9:30 AM each day.
Multi-Timeframe VWAP Master ProThe Multi-Timeframe VWAP Suite is a comprehensive and highly customizable indicator designed for traders who rely on Volume-Weighted Average Price (VWAP) across multiple timeframes and periods. This tool provides a complete suite of VWAP calculations, including daily, weekly, monthly, quarterly, yearly, and custom VWAPs, allowing traders to analyze price action and volume trends with precision. Whether you're a day trader, swing trader, or long-term investor, this indicator offers unparalleled flexibility and depth for your trading strategy.
Multi-Timeframe VWAPs:
Daily, Weekly, Monthly, Quarterly, and Yearly VWAPs: Track VWAP across various timeframes to identify key support and resistance levels.
Customizable Timeframes: Use the SMA timeframe input to adjust the period for moving averages and other calculations.
Previous Period VWAPs:
Previous Daily, Weekly, Monthly, and Quarterly VWAPs: Analyze historical VWAP levels to understand past price behavior and identify potential reversal zones.
Previous Year Quarterly VWAPs: Compare current price action to VWAP levels from specific quarters of the previous year.
Custom VWAPs:
Custom Start Date and Timeframe: Define your own VWAP periods by specifying a start date and timeframe, allowing for tailored analysis.
Dynamic Custom VWAP Calculation: Automatically calculates VWAP based on your custom inputs, ensuring flexibility for unique trading strategies.
Seasonal and Yearly VWAPs:
April, July, and October VWAPs: Analyze seasonal trends by tracking VWAP levels for specific months.
Yearly VWAP: Get a broader perspective on long-term price trends with the yearly VWAP.
SMA Integration:
SMA Overlay: Combine VWAP analysis with a Simple Moving Average (SMA) for additional confirmation of trends and reversals.
Customizable SMA Length and Timeframe: Adjust the SMA settings to match your trading style and preferences.
User-Friendly Customization:
Toggle Visibility and Labels: Easily enable or disable the display of specific VWAPs and their labels to keep your chart clean and focused.
Color Customization: Each VWAP line and label is color-coded for easy identification and can be customized to suit your preferences.
Dynamic Labeling:
Automatic Labels: Labels are dynamically placed on the last bar, providing clear and concise information about each VWAP level.
Customizable Label Text: Labels include detailed information, such as the timeframe or custom period, for quick reference.
Flexible Timeframe Detection:
Automatic Timeframe Detection: The indicator automatically detects new days, weeks, months, and quarters, ensuring accurate VWAP calculations.
Support for Intraday and Higher Timeframes: Works seamlessly on all chart timeframes, from 1-minute to monthly charts.
Previous Year Quarterly VWAPs:
Q1, Q2, Q3, Q4 VWAPs: Compare current price action to VWAP levels from specific quarters of the previous year.
User-Selectable Year: Choose the year for which you want to calculate previous quarterly VWAPs.
Persistent Monthly VWAPs:
Option to Persist Monthly VWAPs Year-Round: Keep monthly VWAP levels visible even after the month ends for ongoing analysis.
Comprehensive Analysis: Combines multiple VWAP timeframes and periods into a single tool, eliminating the need for multiple indicators.
Customizable and Flexible: Tailor the indicator to your specific trading strategy with customizable timeframes, periods, and settings.
Enhanced Decision-Making: Gain deeper insights into price action and volume trends across different timeframes, helping you make more informed trading decisions.
Clean and Organized Charts: Toggle visibility and labels to keep your chart clutter-free while still accessing all the information you need.
Ideal For:
Day Traders: Use daily and intraday VWAPs to identify intraday support and resistance levels.
Swing Traders: Analyze weekly and monthly VWAPs to spot medium-term trends and reversals.
Long-Term Investors: Leverage quarterly and yearly VWAPs to understand long-term price behavior and key levels.
Seasonal Traders: Track April, July, and October VWAPs to capitalize on seasonal trends.
The Multi-Timeframe VWAP Suite is a powerful and versatile tool for traders of all styles and timeframes. With its comprehensive suite of VWAP calculations, customizable settings, and user-friendly design, it provides everything you need to analyze price action and volume trends with precision and confidence. Whether you're looking to fine-tune your intraday strategy or gain a broader perspective on long-term trends, this indicator has you covered.

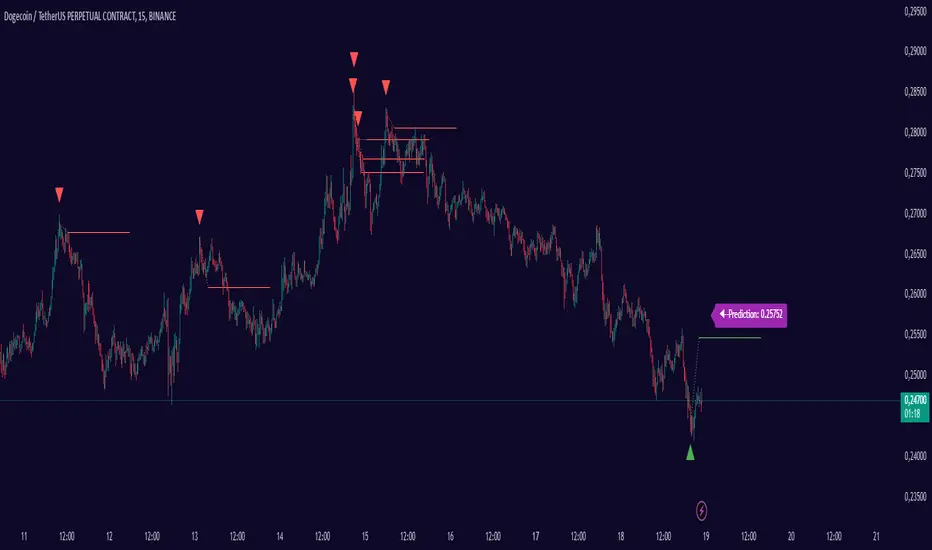
Smart Adaptive Signal SystemSmart Adaptive Signal System
Description: The Smart Adaptive Signal System is a sophisticated indicator that generates intelligent buy/sell signals by dynamically adapting to market conditions. It predicts target prices based on momentum and volatility, providing more accurate and reliable trading opportunities.
How It Works:
Dynamic Signal Generation: The system predicts target prices by considering factors such as volatility and momentum. This allows it to react instantly to trend changes and market fluctuations.
Adaptive Thresholds: Buy and sell signals are triggered with adaptive thresholds, adjusting according to market volatility. This ensures flexibility in the face of sudden market changes.
Trend-Based Reset: Users can choose to reset threshold values based on a time interval or trend change. This feature helps the system re-adapt to current market conditions for greater accuracy.
Target Price Prediction: Target prices are calculated using momentum and volatility, helping the system predict future price movements.
How to Use:
Buy/Sell Signals: The indicator generates buy and sell signals based on market conditions. Look for a "down arrow" for a buy signal and an "up arrow" for a sell signal on the chart.
Target Price Lines: Along with buy and sell signals, the system draws target price lines. This helps you visualize potential future price levels.
Flexible Settings: Users can customize analysis periods, minimum change percentages, and other parameters to fit their needs.
Features:
Dynamic buy and sell signals
Target price predictions
Volatility and momentum-based analysis
User-friendly and flexible settings
Trend-based adaptive resetting
Alerts: The Smart Adaptive Signal System responds quickly to sudden market changes, but always use it in conjunction with other indicators like support and resistance levels. Signal accuracy may vary depending on market conditions.
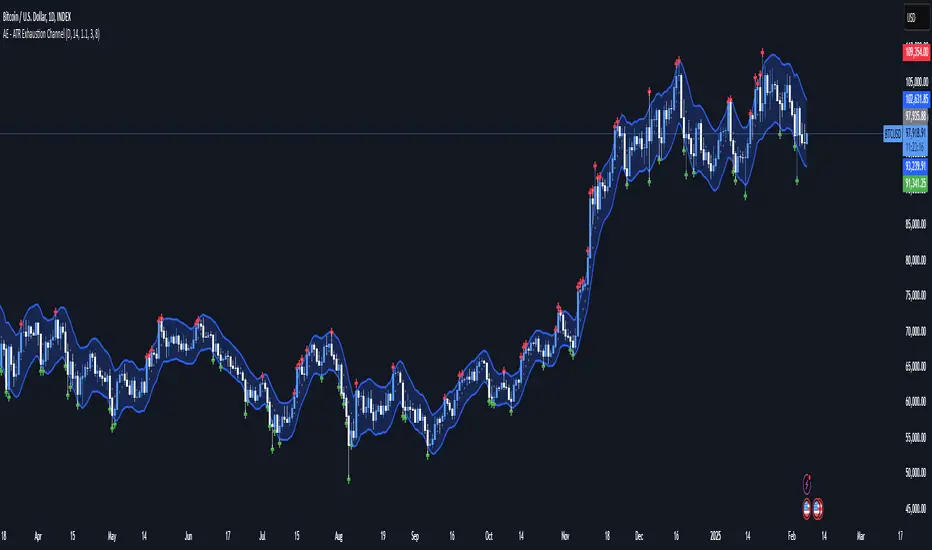
AE - ATR Exhaustion ChannelAE - ATR Exhaustion Channel
📈 Overview
Identify Exhaustion Zones & Trend Breakouts with ATR Precision!
The AE - ATR Exhaustion Channel is a powerful volatility-based trading tool that combines an averaged SMA with ATR bands to dynamically highlight potential trend exhaustion zones. It provides real-time breakout detection by marking when price moves beyond key volatility bands, helping traders spot overextensions and reversals with ease.
🔑 Key Features
✔️ ATR-SMA Hybrid Channel: Uses an averaged SMA as the core trend filter while incorporating adaptive ATR-based bands for precise volatility tracking.
✔️ Dynamic Exhaustion Markers: Marks red crosses when price exceeds the upper band and green crosses when price drops below the lower band.
✔️ Customizable ATR Sensitivity: Adjust the ATR multiplier and length settings to fine-tune band sensitivity based on market conditions.
✔️ Clear Channel Visualization: A gray SMA midpoint and a blue-filled ATR band zone make it easy to track market structure.
📚 How It Works
1️⃣ Averaged SMA Calculation: The script calculates an averaged SMA over a user-defined range (min/max period). This smooths out short-term fluctuations while preserving trend direction.
2️⃣ ATR Band Construction: The ATR value (adjusted by a multiplier) is added to/subtracted from the SMA to form dynamic upper and lower volatility bands.
3️⃣ Exhaustion Detection:
If high > upper ATR band, a red cross is plotted (potential overextension).
If low < lower ATR band, a green cross is plotted (potential reversal zone).
4️⃣ Filled ATR Channel: The area between the upper and lower bands is shaded blue, providing a visual trading range.
🎨 Customization & Settings
⚙️ ATR Length – Adjusts the ATR calculation period (default: 14).
⚙️ ATR Multiplier – Scales the ATR bands for tighter or wider volatility tracking (default: 0.8, adjustable in 0.1 steps).
⚙️ SMA Range (Min/Max Length) – Defines the period range for calculating the averaged SMA (default: 5-20).
⚙️ Rolling Lookback Length – Controls how far back the high/low comparison is calculated (default: 50 bars).
🚀 Practical Usage
📌 Spotting Exhaustion Zones – Look for red/green markers appearing outside the ATR bands, signaling potential trend exhaustion and possible reversal opportunities.
📌 Breakout Confirmation – Price consistently breaching the upper band with momentum could indicate continuation, while repeated touches without strong closes may hint at reversal zones.
📌 Trend Reversal Signals – Watch for green markers below the lower band in uptrends (buy signals) and red markers above the upper band in downtrends (sell signals).
🔔 Alerts & Notifications
📢 Set Alerts for Exhaustion Signals!
Traders can configure alerts to trigger when price breaches the ATR bands, allowing for instant notifications when volatility-based exhaustion is detected.
📊 Example Scenarios
✔ Trend Exhaustion in Overextended Moves – A series of red crosses near resistance may indicate a short opportunity.
✔ Trend Exhaustion in Overextended Moves – A series of red crosses near resistance may indicate an opportunity to open a short trade.
✔ Volatility Compression Breakouts – If price consolidates within the ATR bands and suddenly breaks out, it could signify a momentum shift.
✔ Reversal Catching in Trending Markets – Spot potential trend reversals by looking for green markers below the ATR bands in bullish markets.
🌟 Why Choose AE - ATR Exhaustion Channel?
Trade with Confidence. Spot Volatility. Catch Breakouts.
The AE - ATR Exhaustion Channel is an essential tool for traders looking to identify trend exhaustion, detect breakouts, and manage volatility effectively. Whether you're trading stocks, crypto, or forex, this ATR-SMA hybrid system provides clear visual cues to help you stay ahead of market moves.
✅ Customizable to Fit Any Market
✅ Combines Volatility & Trend Analysis
✅ Easy-to-Use with Instant Breakout Detection
Triple Trend Indicator [BigBeluga]Triple Trend Indicator is a versatile trend-following tool designed to help traders identify trend strength and potential pullback levels using a three-band system. Each band represents a varying degree of price deviation from the mean, providing progressively stronger trend signals.
🔵 Key Features:
Three Adaptive Bands:
The indicator dynamically calculates three bands (1, 2, and 3) based on moving averages (SMA, EMA, WMA) and ATR multipliers.
Bands are positioned below the price in an uptrend and above the price in a downtrend, offering clear trend direction visualization.
Signal System:
Signals are generated when price interacts with the bands:
Signal 1: Triggered when the price touches Band 1, indicating a minor pullback within the trend.
Signal 2: Triggered at Band 2, showing a stronger price deviation and trend confirmation.
Signal 3: Triggered at Band 3, representing the most significant price deviation and strongest trend signal.
The further the price deviates from the mean, the stronger the trend signal, with Signal 3 being the most robust.
Color-Coded Bands:
Bands dynamically change color based on the trend direction:
Green bands signify an uptrend.
Brown bands signify a downtrend.
Dynamic Trend Line Changes:
Dashed lines highlight trend changes, helping traders visualize key turning points in the market.
🔵 Usage:
Use the bands to identify trend direction and strength.
Monitor the signal system to assess the level of price deviation and potential pullback strength.
Combine Signal 1, 2, and 3 to confirm trend momentum:
Signal 1 suggests a weaker pullback and continuation.
Signal 2 indicates a stronger trend confirmation.
Signal 3 highlights the strongest momentum and potential exhaustion points.
Utilize the color-coded bands for an intuitive understanding of current market conditions.
The Triple Trend Indicator is an ideal tool for trend traders looking for structured signals and dynamic support and resistance levels to optimize entries and exits.

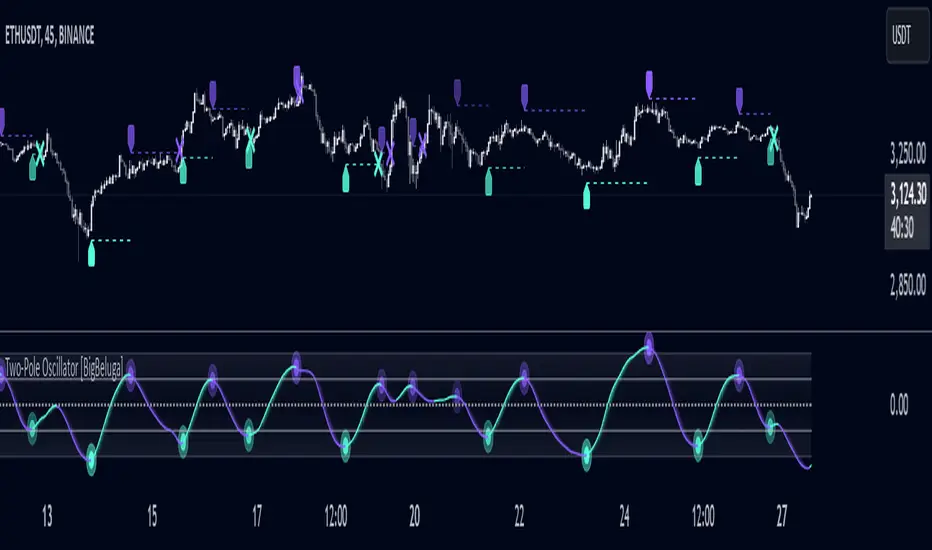
Two-Pole Oscillator [BigBeluga]
The Two-Pole Oscillator is an advanced smoothing oscillator designed to provide traders with precise market signals by leveraging deviation-based calculations combined with a unique two-pole filtering technique. It offers clear visual representation and actionable signals for smart trading decisions.
🔵Key Features:
Two-Pole Filtering: Smooths out the main oscillator signal to reduce noise, providing a cleaner and more reliable view of market momentum and trend strength.
// Two-pole smooth filter function
f_two_pole_filter(source, length) =>
var float smooth1 = na
var float smooth2 = na
alpha = 2.0 / (length + 1)
if na(smooth1)
smooth1 := source
else
smooth1 := (1 - alpha) * smooth1 + alpha * source
if na(smooth2)
smooth2 := smooth1
else
smooth2 := (1 - alpha) * smooth2 + alpha * smooth1
Deviation-Based Oscillator: Utilizes price deviations from the mean to generate dynamic signals, making it ideal for detecting overbought and oversold conditions.
float sma1 = ta.sma(close, 25)
float sma_n1 = ((close - sma1) - ta.sma(close - sma1, 25)) / ta.stdev(close - sma1, 25)
Signal Gradient Strength: Signals on the main oscillator line feature gradient coloring based on their proximity to the 0 level:
➔ Closer to 0: More transparent, indicating weaker signals.
➔ Closer to 1 or -1: Less transparent, highlighting stronger signals.
Level-Based Signal Validation: Parallel levels are plotted on the chart for each signal:
➔ If a level is crossed by price, the signal is invalidated, marked by an "X" at the invalidation point.
Trend Continuation
Invalidation Levels: Serve as potential stop-loss or trade-reversal zones, enabling traders to make more informed and disciplined trading decisions.
Dynamic Chart Plotting: Signals are plotted directly on the chart with corresponding levels, providing a comprehensive visual representation for easy interpretation.
🔵How It Works:
The oscillator calculates price deviation from a mean value and applies two-pole filtering to smooth the resulting signal.
Gradient-colored signals reflect their strength, with transparency indicating proximity to the 0 level on the oscillator scale.
Buy and sell signals are generated based on crossovers and crossunders of the oscillator line with a signal line.
If a level is crossed, the corresponding signal is marked with a "X" plotted on the chart at the crossover point.
🔵Use Cases:
Detecting overbought or oversold market conditions with a smoother, noise-free oscillator.
Using invalidation levels to set clear stop-loss or trade exit points.
Identifying strong momentum signals and filtering out weaker, less reliable ones.
Combining oscillator signals with price action for more precise trade entries and exits.
This indicator is perfect for traders seeking a refined approach to oscillator analysis, combining signal strength visualization with actionable invalidation levels to enhance trading precision and strategy.
TechniTrend: Advance Custom Candle Finder (CCF)🟦 Description:
The TechniTrend: Advanced Custom Candle Finder (CCF) is a versatile tool designed to help traders identify custom candlestick patterns using various configurable criteria. This indicator provides a flexible framework to filter and highlight specific candles based on volume, volatility, candle characteristics, and other important metrics. Below is a detailed explanation of each filter and its customization options:
🟦 Volume-Based Filters
🔸Volume Spike Filter:
Enable filtering based on volume spikes. Use the Volume Spike Multiplier to define what constitutes a significant increase in volume compared to the average. A spike indicates unusually high trading interest.
🔸Volume Range Filter:
Filter candles based on specific volume ranges. Set Minimum Volume and Maximum Volume thresholds to isolate candles with trading volumes within your desired boundaries.
🟦 Candle Body & Wick Filters
🔸Body Size Filter:
Filter candles based on the size of their body. A Body Size Multiplier determines what is considered a large body relative to historical averages.
🔸Body Percentage Filter:
Filter based on the proportion of the body to the entire candle size. Use the Body Percentage Threshold to highlight candles where the body makes up a certain percentage of the total candle range.
🔸Wick-to-Body Ratio Filter:
Identify candles with specific wick-to-body ratios. A higher Wick-to-Body Ratio can indicate indecision or reversals.
🟦 Volatility & Range Filters
🔸Volatility Filter:
Highlight candles based on price changes relative to volume. The Volatility Multiplier sets the threshold for what is considered a volatile candle.
🔸Candle Range Filter:
Filter based on the range (High - Low) of each candle. Use Minimum Candle Range and Maximum Candle Range to specify your desired candle size in points or pips.
🔸Short-Term and Long-Term Volatility Filters:
Analyze volatility over different periods. Enable Short-Term Volatility or Long-Term Volatility filters to compare recent volatility against historical averages, helping you detect sudden market shifts.
🟦 Candle Color & Open/Close Filters
🔸Candle Color Filter:
Filter based on the candle's color. Choose between Bullish (close > open) or Bearish (close < open) to focus on specific market sentiments.
🔸Open/Close Price Range Filter:
Filter based on the difference between the open and close prices. Use Minimum Open/Close Range and Maximum Open/Close Range to specify your acceptable range in price movements.
🟦 Core Functionality
The CCF indicator combines these filters to provide a final signal whenever a candle meets all the enabled criteria. By default, it highlights any qualifying candle directly on the chart and changes the background color for added visibility.
🟦 Key Features:
🔸Highly Customizable Filters: Adjust the parameters for each filter to tailor the indicator to your specific needs.
🔸Multiple Conditions: Combine several conditions to identify complex candlestick patterns.
🔸Real-Time Alerts: Receive instant notifications when a matching candle pattern is found based on your custom criteria.
🟦 How to Use:
🔸Enable the filters you wish to apply (e.g., Volume Spike, Candle Body Size, Volatility).
🔸Adjust the thresholds for each filter to fine-tune the pattern recognition criteria.
🔸Observe the chart to see visual cues for candles that match your specified conditions.
🟦 Notes:
🔸Ensure that you clearly understand each filter’s role. Over-filtering with very strict criteria may reduce the number of signals.
🔸This indicator is designed to be a customizable tool, not providing buy or sell recommendations.
🔸Use in combination with other analysis tools and indicators for the best results.

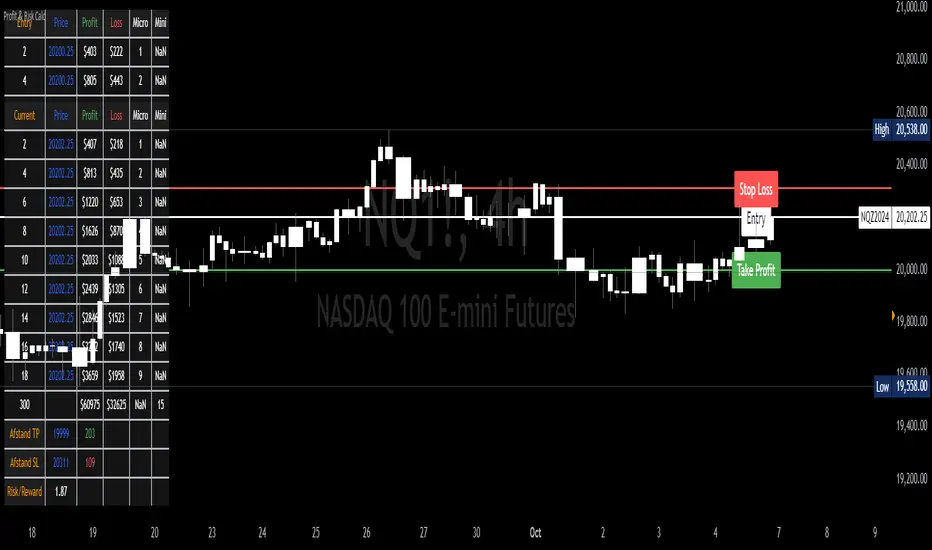
Target Trend [BigBeluga]The Target Trend indicator is a trend-following tool designed to assist traders in capturing directional moves while managing entry, stop loss, and profit targets visually on the chart. Using adaptive SMA bands as the core trend detection method, this indicator dynamically identifies shifts in trend direction and provides structured exit points through customizable target levels.
SP500:
🔵 IDEA
The Target Trend indicator’s concept is to simplify trade management by providing automated visual cues for entries, stops, and targets directly on the chart. When a trend change is detected, the indicator prints an up or down triangle to signal entry direction, plots three customizable target levels for potential exits, and calculates a stop-loss level below or above the entry point. The indicator continuously adapts as price moves, making it easier for traders to follow and manage trades in real time.
When price crosses a target level, the label changes to a check mark, confirming that the target has been achieved. Similarly, if the stop-loss level is hit, the label changes to an "X," and the line becomes dashed, indicating that the stop loss has been activated. This feature provides traders with a clear visual trail of whether their targets or stop loss have been hit, allowing for easier trade tracking and exit strategy management.
🔵 KEY FEATURES & USAGE
SMA Bands for Trend Detection: The indicator uses adaptive SMA bands to identify the trend direction. When price crosses above or below these bands, a new trend is detected, triggering entry signals. The entry point is marked on the chart with a triangle symbol, which updates with each new trend change.
Automated Targets and Stop Loss Management: Upon a new trend signal, the indicator automatically plots three price targets and a stop loss level. These levels provide traders with structured exit points for potential gains and a clear risk limit. The stop loss is placed below or above the entry point, depending on the trend direction, to manage downside risk effectively.
Visual Target and Stop Loss Validation: As price hits each target, the label beside the level updates to a check mark, indicating that the target has been reached. Similarly, if the stop loss is activated, the stop loss label changes to an "X," and the line becomes dashed. This feature visually confirms whether targets or stop losses are hit, simplifying trade management.
The indicator also marks the entry price at each trend change with a label on the chart, allowing traders to quickly see their initial entry point relative to current price and target levels.
🔵 CUSTOMIZATION
Trend Length: Set the lookback period for the trend-detection SMA bands to adjust the sensitivity to trend changes.
Targets Setting: Customize the number and spacing of the targets to fit your trading style and market conditions.
Visual Styles: Adjust the appearance of labels, lines, and symbols on the chart for a clearer view and personalized layout.
🔵 CONCLUSION
The Target Trend indicator offers a streamlined approach to trend trading by integrating entry, target, and stop loss management into a single visual tool. With automatic tracking of target levels and stop loss hits, it helps traders stay focused on the current trend while keeping track of risk and reward with minimal effort.

TechniTrend: Trend and Volume Indicator🟪 Overview
The "TechniTrend: Trend and Volume Indicator" is designed to assist traders in identifying optimal entry and exit points in the market by combining trend detection and volume analysis. This indicator integrates moving average-based trend recognition with volume threshold analysis to provide clear buy and sell signals. Additionally, it includes divergence filtering and correlation analysis to enhance the accuracy of signals, making it suitable for traders who want to identify strong trends and high-probability trading opportunities.
🟪 Indicator Components
🔹Trend Moving Average (MA):
The indicator calculates a moving average based on the closing prices to identify the overall trend. Various moving average types are available for customization:
Simple Moving Average (SMA)
Exponential Moving Average (EMA)
Weighted Moving Average (WMA)
Hull Moving Average (HMA)
The length of the moving average can be adjusted via the Trend MA Length input to adapt to different market conditions.
🔹Volume Analysis:
A volume moving average is calculated over a specified period (Volume MA Length), with a volume threshold derived by multiplying this average by a user-defined Volume Threshold Factor.
This threshold helps to classify volume as either high or low, which plays a crucial role in signal generation.
🔹Divergence Detection:
The indicator can filter out signals when there is a divergence between the price movement and volume changes. Divergence occurs when the price moves in one direction while the volume moves in the opposite direction, indicating a potential weakening of the trend.
🔹Correlation Analysis:
The correlation between price and volume changes is calculated over the same length as the trend moving average. The user can enable this filter to ensure that buy or sell signals are only generated when the correlation exceeds a specified threshold (Correlation Threshold).
🟪 Signals and Alerts
🔹Buy Signal: Generated when the price is above the trend moving average (indicating an uptrend), and the current volume exceeds the volume threshold (indicating high volume). The signal can be filtered based on divergence or correlation settings.
🔹Sell Signal: Triggered when the price is below the trend moving average (indicating a downtrend), and the volume is above the threshold. Similarly, the signal is affected by divergence and correlation filters.
🔹Visual Indicators:
The trend line is plotted on the chart for easy trend identification.
Buy and sell signals are displayed using green and red labels, respectively.
Background highlighting is used to mark areas of high volume on the chart.
🟪 Customizable Inputs
🔹Trend MA Length: Adjusts the moving average length used to detect trends.
🔹Volume MA Length: Sets the length for the volume moving average calculation.
🔹MA Type for Trend: Select the type of moving average for trend detection (SMA, EMA, WMA, HMA).
🔹Volume Threshold Factor: Multiplier used to define high-volume conditions based on the volume moving average.
🔹Enable Divergence Filter: Allows the user to filter out signals where divergence between price and volume is detected.
🔹Enable Correlation Filter: Enables filtering of signals based on the correlation between price and volume changes.
🔹Correlation Threshold: Sets the minimum correlation value required for a signal to be considered valid.
🟪 Alerts
The indicator provides alert conditions for buy and sell signals, allowing traders to receive notifications when new trading opportunities arise.
🟪 Usage Tips
🔹Adjust Moving Average Lengths: Shorter lengths can make the indicator more sensitive to recent market changes, while longer lengths provide a smoother, more reliable trend signal.
🔹Volume Threshold Factor: Increasing this factor raises the volume required to generate high-volume signals, which can help filter.
🟪 Disclaimer:
The "TechniTrend: Trend and Volume Indicator" is a technical analysis tool intended for educational and informational purposes only. It is not a guarantee of future performance or a recommendation to buy, sell, or hold any financial instrument. Trading involves significant risk, and past performance is not indicative of future results. Users should conduct their own research and seek advice from a qualified financial professional before making any investment decisions. The creators of this indicator are not liable for any financial losses or damages incurred through its use.

Profit & Risk CalculatorThe "Profit & Risk Calculator" script in Pine Script (TradingView) is designed to help users calculate potential profit and risk when trading, and to provide alerts when specific price levels are reached (such as entry price, take profit, or stop loss). It includes several components as described below:
1. Input Fields:
The user can manually input various prices: entry price, stop loss price, and take profit price, with steps of 0.25.
There is also an option to input a custom value (e.g., for personal lot sizing) and a total investment amount.
2. Dynamic Lines:
The script draws dynamic horizontal lines for the input prices: entry line (white), stop loss line (red), and take profit line (green).
These lines are automatically updated based on the entered price levels.
3. Labels for the Lines:
Labels are added to the lines to visually indicate the entry, stop loss, and take profit levels on the chart.
4. Long and Short Position Calculations:
The script calculates potential profit and loss for both long (profit if the price goes up) and short (profit if the price goes down) positions.
It also calculates the distance between entry and take profit, and distance between entry and stop loss, along with the risk/reward ratio (RR).
5. Alerts:
The script generates alerts when one of the following conditions is met:
Entry Condition: The price touches or exceeds the entry price (high >= entryPrice).
Stop Loss Condition: The price touches or drops below the stop loss price (low <= stopLossPrice).
Take Profit Condition: The price touches or exceeds the take profit price (high >= takeProfitPrice).
6. Lot Calculations:
The script calculates both micro and mini lot sizes based on a preset table and the custom value.
The results are displayed in a table on the chart.
7. Profit/Risk Table:
The script shows two tables:
One table calculates the profit, loss, and risk/reward ratio based on the input entry price.
A second table shows the same calculations based on the current price.
8. Chart Display:
The script places tables and other visual data on the chart, such as preset values, profit and loss calculations, and the distance from take profit and stop loss to the entry price.
English Explanation of Each Part of the Script
1. Input Fields
The script starts with several input fields where the user can specify the entry price, stop loss price, take profit price, custom value, and investment amount. These values help define the parameters for risk/reward calculations.
2. Dynamic Horizontal Lines
Three horizontal lines are drawn on the chart, representing the entry price, stop loss price, and take profit price. These lines update dynamically based on user input.
3. Dynamic Line Updates
As the user adjusts their inputs, the position of the lines is updated in real-time to match the new price levels. This keeps the chart visually accurate.
4. Labels for Lines
Labels are placed on the chart next to each price line, allowing the user to clearly see which line represents which price level.
5. Long and Short Position Calculations
The script calculates the potential profit or loss for both long (prices go up) and short (prices go down) positions, providing users with an idea of their potential gains or losses.
6. **6. Risk/Reward Ratio Calculation
This calculates the Risk/Reward Ratio (RR) by dividing the distance between the take profit and entry price by the distance between the entry and stop loss price. This gives the trader an idea of how much risk they're taking relative to the potential reward.
7. Alert Conditions
The alert conditions are defined based on the price hitting the set levels:
Entry Condition: If the price goes up and touches the entry level, the alert is triggered.
Stop Loss Condition: If the price drops and hits the stop loss level, the alert is triggered.
Take Profit Condition: If the price rises and reaches the take profit level, the alert is triggered.
8. Alert Configuration
Each condition is linked to an alert that sends a message when the specific price level is touched. The alerts notify the user when the entry, stop loss, or take profit levels are hit.
9. Lot Calculations
The script includes a function that calculates micro and mini lot sizes based on a preset table and a custom value input by the user. This is useful for adjusting lot sizes to the desired amount and determining position sizes for trades.
10. Entry Price-Based Profit & Loss Table
A table is generated on the chart that displays detailed information about the profit, loss, and risk/reward ratio based on the entry price. It helps traders see the potential outcomes for different lot sizes.
11. Current Price-Based Profit & Loss Table
This second table provides similar information as the first but calculates profit, loss, and risk/reward based on the current price. This allows the trader to see how their position performs as the market price changes in real time.
long&short signal Smart Money Concepts (SMC) with MACD Signals Smart Money Concepts (SMC) with MACD Signals
Advanced SMC and MACD Integration for Precision Trading
The "Smart Money Concepts (SMC) with MACD Signals" indicator is a powerful and versatile tool designed to enhance trading strategies by integrating two highly effective technical analysis methods into a single, cohesive indicator. This advanced script combines the Smart Money Concepts (SMC) methodology with the Moving Average Convergence Divergence (MACD) indicator to provide traders with a comprehensive trading solution that identifies key market trends and potential trading opportunities.
What It Does:
Smart Money Concepts (SMC):
The SMC component of this indicator identifies significant price levels and zones where market participants, particularly institutional investors, may be active. It calculates high and low anchor levels based on historical price data, creating zones that help traders understand where price action may encounter support or resistance. These anchor levels are used to plot background colors on the chart, highlighting critical areas of interest where price might react, and generating buy (long) and sell (short) signals based on price interactions with these levels.
MACD (Moving Average Convergence Divergence):
The MACD component provides insights into market momentum and trend strength. By calculating the difference between two moving averages and comparing it to a signal line, the MACD indicator helps traders identify potential changes in trend direction. The script plots the MACD line, signal line, and histogram, offering a clear visual representation of market momentum. Buy (long) and sell (short) signals are generated when the MACD line crosses above or below the signal line, providing timely alerts to potential trading opportunities.
Why It’s Special:
This indicator stands out for its dual functionality, combining the price level analysis of SMC with the momentum-based insights of MACD. The integration allows traders to benefit from both trend and price level analysis, offering a more robust and accurate trading tool. The SMC component highlights critical price zones and provides context for price action, while the MACD component confirms the strength and direction of market trends.
By using this combined approach, traders can make more informed decisions based on comprehensive market analysis. The indicator not only helps in identifying significant price levels and potential market reversals but also provides real-time signals to capitalize on these opportunities. Whether you are a day trader or a swing trader, the "Smart Money Concepts (SMC) with MACD Signals" indicator is designed to enhance your trading strategy with precision and clarity.
This unique combination of SMC and MACD offers a powerful toolset for traders looking to refine their trading strategies and improve their market analysis. With its user-friendly visualizations and signal generation, this indicator is an essential addition to any trader’s toolkit.

Fibonacci Retracements & Trend Following Strategy V2This Pine Script strategy generates trading signals using Fibonacci levels and trend-following indicators.
1. Strategy Summary
This strategy analyzes price movements using a combination of Fibonacci levels and trend-following indicators, providing potential trading signals. The strategy includes Fibonacci levels as well as EMA (Exponential Moving Average) and ADX (Average Directional Index) indicators.
2. Indicators and Parameters
Fibonacci Levels
Fibonacci Level 1, Level 2, Level 3, Level 4: Used as Fibonacci retracement levels. These levels are typically set at 0.236, 0.382, 0.618, and 0.786. Users can adjust these values according to their preferences.
Trend-Following Indicator
Trend Length: The period for calculating the EMA used as the trend-following indicator. For example, if set to 20, the EMA will be calculated over 20 periods.
ADX (Average Directional Index)
ADX Length: The period for calculating the ADX. ADX measures the strength of the price trend and is usually set to 14 periods.
ADX Threshold: A threshold value for the ADX. This value determines when trading signals will be activated.
3. Usage Steps
Displaying the Indicator on the Chart:
On the TradingView platform, paste the code into the Pine Editor and click the "Add to Chart" button to add it to the chart.
Analyzing the Indicators:
Fibonacci Levels: Show retracement levels of price movements. When the price reaches one of these levels, potential reversals may occur.
Trend-Following Indicator: EMAs determine the direction of the trend. Green EMA represents an uptrend, while red EMA represents a downtrend.
ADX: Measures the strength of the trend. When ADX surpasses the threshold value, it indicates a strong trend.
Trading Signals:
Long Signal: Generated when the price is above the second Fibonacci level and the trend is upward. Additionally, the ADX value must be above the set threshold.
Short Signal: Generated when the price is below the second Fibonacci level and the trend is downward. Additionally, the ADX value must be above the set threshold.
Target Prices:
Long Targets: Determines upward targets based on Fibonacci levels. These targets indicate expected prices if the price reverses from Fibonacci levels.
Short Targets: Determines downward targets based on Fibonacci levels. These targets indicate expected prices if the price reverses from Fibonacci levels.
4. Chart Displays
Trend Up (Green Line): Shows the rising EMA.
Trend Down (Red Line): Shows the falling EMA.
Fibonacci Levels (Blue Lines): Shows Fibonacci retracement levels.
Long Targets (Green Circles): Shows targets for long positions.
Short Targets (Red Circles): Shows targets for short positions.
Long Signal (Green Label): Buy signal.
Short Signal (Red Label): Sell signal.
5. Important Notes
Retracement and Target Levels: Fibonacci levels can act as potential retracement or support/resistance levels. However, they should always be used in conjunction with other technical analysis tools.
Trend and ADX: ADX is used to determine the strength of the trend. Be aware that when ADX is low, trends may be weak.
6. Example Scenarios
Example 1: If the trend is upward (green EMA) and the price is above the second Fibonacci level, you may receive a long position signal. If the ADX value is above the threshold, the signal may be stronger.
Example 2: If the trend is downward (red EMA) and the price is below the second Fibonacci level, you may receive a short position signal. If the ADX value is above the threshold, the signal may be stronger.
This updated version contains significant improvements in both technical aspects and user experience. Innovations such as ADX calculations and dynamic Fibonacci levels make the strategy more robust and flexible. The code's readability and comprehensibility have been enhanced, and errors have been corrected.
This guide will help you understand the basic operation of the strategy. It is always recommended to conduct your own research and test the strategy before using it.
GOOD LUCK. // halilvarol

Market Cycle Phases IndicatorOverview
The Market Cycle Phases Indicator is a powerful tool designed to help traders identify and visualize the different phases of market cycles. By distinguishing between Accumulation, Uptrend, Distribution, and Downtrend phases, this indicator provides a clear and color-coded representation of market conditions, aiding in better decision-making and strategy development. It is especially useful for long-term investors to observe and understand market cycles over extended periods. The phases are color-coded for easy identification: Green for Accumulation, Blue for Uptrend, Yellow for Distribution, and Red for Downtrend.
Key Features
Identifies four key market phases: Accumulation, Uptrend, Distribution, and Downtrend
Uses a combination of moving averages and volatility measures
Color-coded background for easy visualization of market phases
Adjustable parameters for moving average length, volatility length, and volatility threshold
Plots the moving average and Average True Range (ATR) for reference
Suitable for both short-term trading and long-term investing
Concepts Underlying the Calculations
The calculations behind the Market Cycle Phases Indicator are straightforward, combining the principles of moving averages and volatility measures:
Moving Average (MA): A simple moving average is used to determine the overall trend direction.
Average True Range (ATR): This measures market volatility over a specified period.
Volatility Threshold: A multiplier is applied to the ATR to distinguish between high and low volatility conditions.
How It Works
The indicator first calculates a moving average (MA) of the closing prices and the Average True Range (ATR) to measure market volatility. Based on the position of the price relative to the MA and the current volatility level, the indicator determines the current market phase:
Accumulation Phase: Price is below the MA, and volatility is low (Green background). This phase often indicates a period of consolidation and potential buying interest before an uptrend.
Uptrend Phase: Price is above the MA, and volatility is high (Blue background). This phase represents a strong upward movement in price, often driven by increased buying activity.
Distribution Phase: Price is above the MA, and volatility is low (Yellow background). This phase suggests a period of consolidation at the top of an uptrend, where selling interest may start to increase.
Downtrend Phase: Price is below the MA, and volatility is high (Red background). This phase indicates a strong downward movement in price, often driven by increased selling activity.
How Traders Can Use It
Traders can use the Market Cycle Phases Indicator to:
Identify potential entry and exit points based on market phase transitions.
Confirm trends and avoid false signals by considering both trend direction and volatility.
Develop and refine trading strategies tailored to specific market conditions.
Enhance risk management by recognizing periods of high and low volatility.
Observe long-term market cycles to make informed investment decisions.
Example Usage Instructions
Add the Market Cycle Phases Indicator to your chart.
Adjust the input parameters as needed:
Base Length: Default is 50.
Volatility Length: Default is 14.
Volatility Threshold: Default is 1.5.
Observe the color-coded background to identify the current market phase
Use the identified phases to inform your trading decisions:
Consider buying during the Accumulation or Uptrend phases.
Consider selling or shorting during the Distribution or Downtrend phases.
Combine with other indicators and analysis techniques for comprehensive market insights.
By incorporating the Market Cycle Phases Indicator into your trading toolkit, you can gain a clearer understanding of market dynamics and enhance your ability to navigate different market conditions, making it a valuable asset for long-term investing.

Fisher Transform on RSIOverview
The Fisher Transform on RSI indicator combines the Relative Strength Index (RSI) with the Fisher Transform to offer a refined tool for identifying market turning points and trends. By applying the Fisher Transform to the RSI, this indicator converts RSI values into a Gaussian normal distribution, enhancing the precision of detecting overbought and oversold conditions. This method provides a clearer and more accurate identification of potential market reversals than the standard RSI.
Key/Unique Features
Fisher Transform Applied to RSI : Transforms RSI values into a Gaussian normal distribution, improving the detection of overbought and oversold conditions.
Smoothing : Applies additional smoothing to the Fisher Transform, reducing noise and providing clearer signals.
Signal Line : Includes a signal line to identify crossover points, indicating potential buy or sell signals.
Custom Alerts : Built-in alert conditions for bullish and bearish crossovers, keeping traders informed of significant market movements.
Visual Enhancements : Background color changes based on crossover conditions, offering immediate visual cues for potential trading opportunities.
How It Works
RSI Calculation : The indicator calculates the Relative Strength Index (RSI) based on the selected source and period length.
Normalization : The RSI values are normalized to fit within a range of -1 to 1, which is essential for the Fisher Transform.
Fisher Transform : The normalized RSI values undergo the Fisher Transform, converting them into a Gaussian normal distribution.
Smoothing : The transformed values are smoothed using a simple moving average to reduce noise and provide more reliable signals.
Signal Line : A signal line, which is a simple moving average of the smoothed Fisher Transform, is plotted to identify crossover points.
Alerts and Visuals : Custom alert conditions are set for bullish and bearish crossovers, and the background color changes to indicate these conditions.
Usage Instructions
Trend Identification : Use the Fisher Transform on RSI to identify overbought and oversold conditions with enhanced precision, aiding in spotting potential trend reversals.
Trade Signals : Monitor the crossovers between the smoothed Fisher Transform and the signal line. A bullish crossover suggests a potential buying opportunity, while a bearish crossover indicates a potential selling opportunity.
Alerts : Set custom alerts based on the built-in conditions to receive notifications when important crossover events occur, ensuring you never miss a trading opportunity.
Visual Cues : Utilize the background color changes to quickly identify bullish (green) and bearish (red) conditions, providing immediate visual feedback on market sentiment.
Complementary Analysis : Combine this indicator with other technical analysis tools and indicators to enhance your overall trading strategy and make more informed decisions.

HilalimSBHilalimSB A Wedding Gift 🌙
HilalimSB - Revealing the Secrets of the Trend
HilalimSB is a powerful indicator designed to help investors analyze market trends and optimize trading strategies. Designed to uncover the secrets at the heart of the trend, HilalimSB stands out with its unique features and impressive algorithm.
Hilalim Algorithm and Fixed ATR Value:
HilalimSB is equipped with a special algorithm called "Hilalim" to detect market trends. This algorithm can delve into the depths of price movements to determine the direction of the trend and provide users with the ability to predict future price movements. Additionally, HilalimSB uses its own fixed Average True Range (ATR) value. ATR is an indicator that measures price movement volatility and is often used to determine the strength of a trend. The fixed ATR value of HilalimSB has been tested over long periods and its reliability has been proven. This allows users to interpret the signals provided by the indicator more reliably.
ATR Calculation Steps
1.True Range Calculation:
+ The True Range (TR) is the greatest of the following three values:
1. Current high minus current low
2. Current high minus previous close (absolute value)
3. Current low minus previous close (absolute value)
2.Average True Range (ATR) Calculation:
-The initial ATR value is calculated as the average of the TR values over a specified period
(typically 14 periods).
-For subsequent periods, the ATR is calculated using the following formula:
ATRt=(ATRt−1×(n−1)+TRt)/n
Where:
+ ATRt is the ATR for the current period,
+ ATRt−1 is the ATR for the previous period,
+ TRt is the True Range for the current period,
+ n is the number of periods.
Pine Script to Calculate ATR with User-Defined Length and Multiplier
Here is the Pine Script code for calculating the ATR with user-defined X length and Y multiplier:
//@version=5
indicator("Custom ATR", overlay=false)
// User-defined inputs
X = input.int(14, minval=1, title="ATR Period (X)")
Y = input.float(1.0, title="ATR Multiplier (Y)")
// True Range calculation
TR1 = high - low
TR2 = math.abs(high - close )
TR3 = math.abs(low - close )
TR = math.max(TR1, math.max(TR2, TR3))
// ATR calculation
ATR = ta.rma(TR, X)
// Apply multiplier
customATR = ATR * Y
// Plot the ATR value
plot(customATR, title="Custom ATR", color=color.blue, linewidth=2)
This code can be added as a new Pine Script indicator in TradingView, allowing users to calculate and display the ATR on the chart according to their specified parameters.
HilalimSB's Distinction from Other ATR Indicators
HilalimSB emerges with its unique Average True Range (ATR) value, presenting itself to users. Equipped with a proprietary ATR algorithm, this indicator is released in a non-editable form for users. After meticulous testing across various instruments with predetermined period and multiplier values, it is made available for use.
ATR is acknowledged as a critical calculation tool in the financial sector. The ATR calculation process of HilalimSB is conducted as a result of various research efforts and concrete data-based computations. Therefore, the HilalimSB indicator is published with its proprietary ATR values, unavailable for modification.
The ATR period and multiplier values provided by HilalimSB constitute the fundamental logic of a trading strategy. This unique feature aids investors in making informed decisions.
Visual Aesthetics and Clear Charts:
HilalimSB provides a user-friendly interface with clear and impressive graphics. Trend changes are highlighted with vibrant colors and are visually easy to understand. You can choose colors based on eye comfort, allowing you to personalize your trading screen for a more enjoyable experience. While offering a flexible approach tailored to users' needs, HilalimSB also promises an aesthetic and professional experience.
Strong Signals and Buy/Sell Indicators:
After completing test operations, HilalimSB produces data at various time intervals. However, we would like to emphasize to users that based on our studies, it provides the best signals in 1-hour chart data. HilalimSB produces strong signals to identify trend reversals. Buy or sell points are clearly indicated, allowing users to develop and implement trading strategies based on these signals.
For example, let's imagine you wanted to open a position on BTC on 2023.11.02. You are aware that you need to calculate which of the buying or selling transactions would be more profitable. You need support from various indicators to open a position. Based on the analysis and calculations it has made from the data it contains, HilalimSB would have detected that the graph is more suitable for a selling position, and by producing a sell signal at the most ideal selling point at 08:00 on 2023.11.02 (UTC+3 Istanbul), it would have informed you of the direction the graph would follow, allowing you to benefit positively from a 2.56% decline.
Technology and Innovation:
HilalimSB aims to enhance the trading experience using the latest technology. With its innovative approach, it enables users to discover market opportunities and support their decisions. Thus, investors can make more informed and successful trades. Real-Time Data Analysis: HilalimSB analyzes market data in real-time and identifies updated trends instantly. This allows users to make more informed trading decisions by staying informed of the latest market developments. Continuous Update and Improvement: HilalimSB is constantly updated and improved. New features are added and existing ones are enhanced based on user feedback and market changes. Thus, HilalimSB always aims to provide the latest technology and the best user experience.
Social Order and Intrinsic Motivation:
Negative trends such as widespread illegal gambling and uncontrolled risk-taking can have adverse financial effects on society. The primary goal of HilalimSB is to counteract these negative trends by guiding and encouraging users with data-driven analysis and calculable investment systems. This allows investors to trade more consciously and safely.

RSI Multi Strategies With Overlay SignalsHello everyone,
In this indicator, you will find 6 different entry and exit signals based on the RSI :
Entry into overbought and oversold zones
Exit from overbought and oversold zones
Crossing the 50 level
RSI cross RSI MA below or above the 50 level
RSI cross RSI MA in the overbought or oversold zones
RSI Divergence
With the signals identified, you can create your own strategy . (If you have any suggestions, please mention them in the comments).
Beyond these signals, you can set SL (Stop Loss) and TP (Take Profit) levels to better manage your positions.
SL Methods:
Percentage: The stop loss is determined by the percentage you specify.
ATR : The stop level is determined based on the Average True Range (ATR).
TP Methods:
Percentage: The take profit is determined by the percentage you specify.
RR ( Risk Reward ): The take profit level is determined based on the distance from the stop level.
You can mix and match these options as you like.
What makes the indicator unique and effective is its ability to display the RSI in the bottom chart and the signals, SL (Stop Loss), and TP (Take Profit) levels in the overlay chart simultaneously. This feature allows you to manage your trading quickly and easily without the need for using two separate indicators.
Let's try out a few strategies together.
My entry signal: RSI Entered OS (Oversold) Zone
My exit signal: RSI Entered OB (Overbought) Zone
I'm not using a stoploss for this strategy ("Fortune favors the brave").
Let's keep ourselves safe by adding a stop loss.
I'm adding an ATR-based stop loss.
I think it's better now.
If you have any questions or suggestions about the indicator, you can contact me.
Cheers

Bitcoin Leverage Sentiment - Strategy [presentTrading]█ Introduction and How it is Different
The "Bitcoin Leverage Sentiment - Strategy " represents a novel approach in the realm of cryptocurrency trading by focusing on sentiment analysis through leveraged positions in Bitcoin. Unlike traditional strategies that primarily rely on price action or technical indicators, this strategy leverages the power of Z-Score analysis to gauge market sentiment by examining the ratio of leveraged long to short positions. By assessing how far the current sentiment deviates from the historical norm, it provides a unique lens to spot potential reversals or continuation in market trends, making it an innovative tool for traders who wish to incorporate market psychology into their trading arsenal.
BTC 4h L/S Performance
local
█ Strategy, How It Works: Detailed Explanation
🔶 Data Collection and Ratio Calculation
Firstly, the strategy acquires data on leveraged long (**`priceLongs`**) and short positions (**`priceShorts`**) for Bitcoin. The primary metric of interest is the ratio of long positions relative to the total of both long and short positions:
BTC Ratio=priceLongs / (priceLongs+priceShorts)
This ratio reflects the prevailing market sentiment, where values closer to 1 indicate a bullish sentiment (dominance of long positions), and values closer to 0 suggest bearish sentiment (prevalence of short positions).
🔶 Z-Score Calculation
The Z-Score is then calculated to standardize the BTC Ratio, allowing for comparison across different time periods. The Z-Score formula is:
Z = (X - μ) / σ
Where:
- X is the current BTC Ratio.
- μ is the mean of the BTC Ratio over a specified period (**`zScoreCalculationPeriod`**).
- σ is the standard deviation of the BTC Ratio over the same period.
The Z-Score helps quantify how far the current sentiment deviates from the historical norm, with high positive values indicating extreme bullish sentiment and high negative values signaling extreme bearish sentiment.
🔶 Signal Generation: Trading signals are derived from the Z-Score as follows:
Long Entry Signal: Occurs when the BTC Ratio Z-Score crosses above the thresholdLongEntry, suggesting bullish sentiment.
- Condition for Long Entry = BTC Ratio Z-Score > thresholdLongEntry
Long Exit/Short Entry Signal: Triggered when the BTC Ratio Z-Score drops below thresholdLongExit for exiting longs or below thresholdShortEntry for entering shorts, indicating a shift to bearish sentiment.
- Condition for Long Exit/Short Entry = BTC Ratio Z-Score < thresholdLongExit or BTC Ratio Z-Score < thresholdShortEntry
Short Exit Signal: Happens when the BTC Ratio Z-Score exceeds the thresholdShortExit, hinting at reducing bearish sentiment and a potential switch to bullish conditions.
- Condition for Short Exit = BTC Ratio Z-Score > thresholdShortExit
🔶Implementation and Visualization: The strategy applies these conditions for trade management, aligning with the selected trade direction. It visualizes the BTC Ratio Z-Score with horizontal lines at entry and exit thresholds, illustrating the current sentiment against historical norms.
█ Trade Direction
The strategy offers flexibility in trade direction, allowing users to choose between long, short, or both, depending on their market outlook and risk tolerance. This adaptability ensures that traders can align the strategy with their individual trading style and market conditions.
█ Usage
To employ this strategy effectively:
1. Customization: Begin by setting the trade direction and adjusting the Z-Score calculation period and entry/exit thresholds to match your trading preferences.
2. Observation: Monitor the Z-Score and its moving average for potential trading signals. Look for crossover events relative to the predefined thresholds to identify entry and exit points.
3. Confirmation: Consider using additional analysis or indicators for signal confirmation, ensuring a comprehensive approach to decision-making.
█ Default Settings
- Trade Direction: Determines if the strategy engages in long, short, or both types of trades, impacting its adaptability to market conditions.
- Timeframe Input: Influences signal frequency and sensitivity, affecting the strategy's responsiveness to market dynamics.
- Z-Score Calculation Period: Affects the strategy’s sensitivity to market changes, with longer periods smoothing data and shorter periods increasing responsiveness.
- Entry and Exit Thresholds: Set the Z-Score levels for initiating or exiting trades, balancing between capturing opportunities and minimizing false signals.
- Impact of Default Settings: Provides a balanced approach to leverage sentiment trading, with adjustments needed to optimize performance across various market conditions.

Crypto MVRV ZScore - Strategy [PresentTrading]█ Introduction and How it is Different
The "Crypto Valuation Extremes: MVRV ZScore - Strategy " represents a cutting-edge approach to cryptocurrency trading, leveraging the Market Value to Realized Value (MVRV) Z-Score. This metric is pivotal for identifying overvalued or undervalued conditions in the crypto market, particularly Bitcoin. It assesses the current market valuation against the realized capitalization, providing insights that are not apparent through conventional analysis.
BTCUSD 6h Long/Short Performance
Local
█ Strategy, How It Works: Detailed Explanation
The strategy leverages the Market Value to Realized Value (MVRV) Z-Score, specifically designed for cryptocurrencies, with a focus on Bitcoin. This metric is crucial for determining whether Bitcoin is currently undervalued or overvalued compared to its historical 'realized' price. Below is an in-depth explanation of the strategy's components and calculations.
🔶Conceptual Foundation
- Market Capitalization (MC): This represents the total dollar market value of Bitcoin's circulating supply. It is calculated as the current price of Bitcoin multiplied by the number of coins in circulation.
- Realized Capitalization (RC): Unlike MC, which values all coins at the current market price, RC is computed by valuing each coin at the price it was last moved or traded. Essentially, it is a summation of the value of all bitcoins, priced at the time they were last transacted.
- MVRV Ratio: This ratio is derived by dividing the Market Capitalization by the Realized Capitalization (The ratio of MC to RC (MVRV Ratio = MC / RC)). A ratio greater than 1 indicates that the current price is higher than the average price at which all bitcoins were purchased, suggesting potential overvaluation. Conversely, a ratio below 1 suggests undervaluation.
🔶 MVRV Z-Score Calculation
The Z-Score is a statistical measure that indicates the number of standard deviations an element is from the mean. For this strategy, the MVRV Z-Score is calculated as follows:
MVRV Z-Score = (MC - RC) / Standard Deviation of (MC - RC)
This formula quantifies Bitcoin's deviation from its 'normal' valuation range, offering insights into market sentiment and potential price reversals.
🔶 Spread Z-Score for Trading Signals
The strategy refines this approach by calculating a 'spread Z-Score', which adjusts the MVRV Z-Score over a specific period (default: 252 days). This is done to smooth out short-term market volatility and focus on longer-term valuation trends. The spread Z-Score is calculated as follows:
Spread Z-Score = (Market Z-Score - MVVR Ratio - SMA of Spread) / Standard Deviation of Spread
Where:
- SMA of Spread is the simple moving average of the spread over the specified period.
- Spread refers to the difference between the Market Z-Score and the MVRV Ratio.
🔶 Trading Signals
- Long Entry Condition: A long (buy) signal is generated when the spread Z-Score crosses above the long entry threshold, indicating that Bitcoin is potentially undervalued.
- Short Entry Condition: A short (sell) signal is triggered when the spread Z-Score falls below the short entry threshold, suggesting overvaluation.
These conditions are based on the premise that extreme deviations from the mean (as indicated by the Z-Score) are likely to revert to the mean over time, presenting opportunities for strategic entry and exit points.
█ Practical Application
Traders use these signals to make informed decisions about opening or closing positions in the Bitcoin market. By quantifying market valuation extremes, the strategy aims to capitalize on the cyclical nature of price movements, identifying high-probability entry and exit points based on historical valuation norms.
█ Trade Direction
A unique feature of this strategy is its configurable trade direction. Users can specify their preference for engaging in long positions, short positions, or both. This flexibility allows traders to tailor the strategy according to their risk tolerance, market outlook, or trading style, making it adaptable to various market conditions and trader objectives.
█ Usage
To implement this strategy, traders should first adjust the input parameters to align with their trading preferences and risk management practices. These parameters include the trade direction, Z-Score calculation period, and the thresholds for long and short entries. Once configured, the strategy automatically generates trading signals based on the calculated spread Z-Score, providing clear indications for potential entry and exit points.
It is advisable for traders to backtest the strategy under different market conditions to validate its effectiveness and adjust the settings as necessary. Continuous monitoring and adjustment are crucial, as market dynamics evolve over time.
█ Default Settings
- Trade Direction: Both (Allows for both long and short positions)
- Z-Score Calculation Period: 252 days (Approximately one trading year, capturing a comprehensive market cycle)
- Long Entry Threshold: 0.382 (Indicative of moderate undervaluation)
- Short Entry Threshold: -0.382 (Signifies moderate overvaluation)
These default settings are designed to balance sensitivity to market valuation extremes with a pragmatic approach to trade execution. They aim to filter out noise and focus on significant market movements, providing a solid foundation for both new and experienced traders looking to exploit the unique insights offered by the MVRV Z-Score in the cryptocurrency market.

ETP SignalManager🔍 Overview:
This indicator is a trader's tool used to generate long/short signals. These signals are crafted by customizing specific conditions set up by the trader, depending on their trading system.
🔑 Key Features:
Signal Types: Generates both long and short signals.
Custom Conditions: Users can define up to 10 conditions via SignalManager in order to generate a signal.
Comparison: You can establish conditions by:
Comparing two indicators.
Comparing an indicator against a fixed value.
Comparing default sources such as low, high, close, and open – either between two sources or pairing a source with another indicator.
Using relational operators like >, <, >=, <=, crossing above, and crossing below.
Indicator Selection: For the indicators used in conditions, you can choose from any loaded indicator on your chart.
Condition Relationships: Combine up to 10 conditions using AND or OR.
Visual Alerts: These alerts activate when the specific conditions are met. They can be displayed or hidden using the dedicated options in the indicator settings. The options for visual alerts are:
Background coloring and
Chart-shape drawings
💡 Benefits:
Eliminate the need for programming skills.
Ability to backtest trading signals before investing real funds or before commissioning full programming.
Save on costs from hiring external programming services.
🎯 In Summary:
Combine indicators to obtain the desired trading signal and backtest your trading idea without any programming skill or expertise.
📊 Chart Example:
In the chart below, we utilized a combination of four indicators to generate trading signals:
Indicators Used:
Short-term Smoothed Moving Average (SMMA)
Long-term Smoothed Moving Average (SMMA)
Relative Strength Index (RSI)
On-Balance Volume (OBV)
Additional Rule:
The relation between the close of the current bar and the close of the previous bar.
🔧 Signal Manager Configuration:
For a Long Signal:
Short-term SMMA crosses above the long-term SMMA. This indicates a potential bullish trend.
Simultaneously, RSI is below 70. This condition ensures that the market is not overbought, making it suitable for a long trade.
The OBV blue line is above the OBV orange line from 3 bars back. This 3-bar offset accounts for the lag in the orange line, and it confirms increasing buying pressure following the SMMA crossover.
The close of the current bar should be above the close of the previous bar. This rule adds an extra layer of confirmation to the long trade setup.
For a Short Signal:
Short-term SMMA crosses below the long-term SMMA. This suggests a potential bearish trend.
Simultaneously, RSI is above 30. This condition ensures that the market is not oversold, making it suitable for a short trade.
The OBV blue line is below the OBV orange line from 3 bars back. This 3-bar offset accounts for the lag in the orange line and confirms increasing selling pressure following the SMMA crossover.
The close of the current bar should be below the close of the previous bar. This rule adds an extra layer of confirmation to the short trade setup.
🚨 Visual Alerts: As you can see on the chart, both visual alerts are active: background coloring and chart-shape drawing. Whenever the conditions mentioned above are met, the visual alert will appear on the bar that satisfies those conditions. This visual feedback enhances your ability to identify potential trade setups quickly and effectively.
This example illustrates a combination of indicators employed to generate trading signals. However, it's essential to recognize that the possibilities are vast when it comes to using indicators to create trading conditions. You can leverage any indicator you have loaded on your chart to establish criteria for trade signals. The key lies in understanding your selected indicators and crafting a strategy that aligns with your trading objectives and market analysis.
Please make sure to check your TradingView plan to determine the number of different indicators you can load on your chart. Your plan will dictate how many indicators you can effectively combine within the Signal Manager. Understanding your plan's limitations is crucial to optimizing your trading strategy.
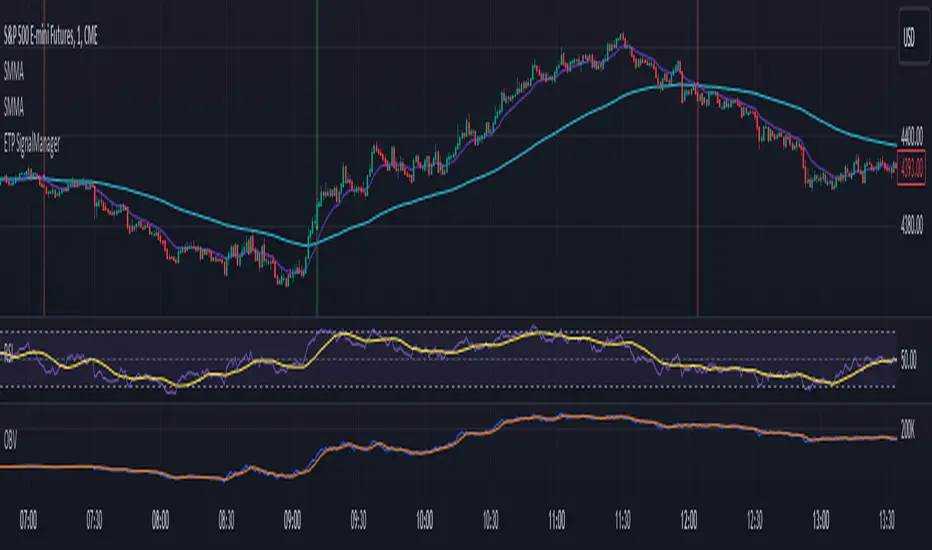
RSI PRECISION v.3RSI PRECISION v.3 (MACD, StochRSI, SMA Signals)
Developed by Giorgos Protonotarios (2021-2023)
RSI PRECISION is an alternative to the classic Relative Strength Index (RSI). The indicator aims to enhance the classic RSI and make it more accurate on longer timeframes. Additionally, the indicator works as an advanced signaling machine, offering five different categories of leading trading signals. RSI PRECISION is an ideal tool for analyzing highly volatile markets, such as cryptocurrency and small-cap stocks.
In this 3rd version, the core formula remains the same, however, there are new trading signals and a great number of new parameters. Traders have the opportunity to fully customize the indicator according to their needs.
What is new ?
The RSI formula remains the same, however, there are additional features:
• Selected StochRSI signals
• Low-timeframe SMA signal (<60 minutes)
• High-timeframe SMA signal (>60 minutes)
• SMA on the RSI PRECISION readings
• Ability to customize everything in settings (tooltips added)
Note: You can turn off any trading signal by unselecting it in Settings>Style.
□ NEW TRADING SIGNALS (v.3)
■ SELECTED STOCHRSI SIGNALS
The selected StochRSI signals are visualized by a cross (+) on the top and bottom of the indicator. The settings for StochRSI are the classic 8.5.3 (customizable). By default, the crossover is generated when StochRSI crosses above 25, and the crossunder when StochRSI crosses below 75.
(i) Bullish StochRSI cross
• Symbol: Cross (+) on the Top
• Event: StochRSI crosses above level 25
(ii) Bearish StochRSI cross
• Symbol: Cross (+) on the Bottom
• Event: StochRSI crosses below level 75
■ SMA CROSSOVERS (LOW/HIGH TIMEFRAMES)
These trading signals are generated when the price of an asset crosses above or below a preset SMA.
There are two different SMAs, one shown on low timeframes, and one on high timeframes. You can adjust the periods for both, by default 200 periods.
(i) Low-Timeframe SMA Cross (<60 minutes)
• Symbol: Bullish (↥) on the top of the indicator and bearish (↧) on the bottom
• Event: The price crosses above or below the selected SMA on low timeframes
(ii) High-Timeframe SMA Cross (>60 minutes)
• Symbol: Bullish (↥) on the top of the indicator and bearish (↧) on the bottom
• Event: The price crosses above or below the selected SMA on high timeframes
■ SMA LINE ON RSI PRECISION
This is just a simple SMA line on the RSI PRECISION readings. By default, it is set at 50 periods.
• SMA Line (blue-dashed)
You can turn it off by unselecting it in Settings>Style.
□ OLDER TRADING SIGNALS
The 3rd version of RSI PRECISION also includes all previous signals.
■ RSI PRECISION CROSSES
This signal corresponds to a bullish/bearish RSI PRECISION cross. By default, it is 5 for a bullish crossover and 100 for a bearish crossunder. These numbers are indicative and can be customized.
(i) Bullish RSI PRECISION Cross
• Symbol: Green arrow (▲) on the Top
• Event: RSI PRECISION crosses above level 5
(ii) Bearish RSI PRECISION Cross
• Symbol: Red arrow (▼) on the Bottom
• Event: RSI PRECISION crosses below level 100
■ MACD CROSSOVER SIGNALS
The MACD signals are visualized by a green/red dot (•). The default settings are the standard MACD settings (12,6,9).
(i) Bullish MACD cross
• Symbol: Green Dot (•) on the Top
• Event: MACD crosses above its signal line
(ii) Bearish MACD cross
• Symbol: Red Dot (•) on the Bottom
• Event: MACD crosses below its signal line
NOTE: In lower timeframes, MACD generates too many signals. You can switch off “MACD BULLISH & BEARISH CROSSOVERS” by clicking on ‘SETTINGS’, then ‘STYLE’, and then unselecting ‘Bullish MACD Cross’ and ‘Bearish MACD Cross’.
■ GOLDEN/DEATH CROSSES (SMA CROSSOVERS)
The cross of the 50-day moving average above the 200-day moving average is called a golden cross, and it is considered a bullish signal. The cross of the 50-day moving average below the 200-day moving average is called a death cross, and it is considered a bearish signal.
The Golden/Death crosses are visualized by (X). By default, 50 periods for the fast SMA and 200 periods for the slow SMA (both are customizable).
(i) Bullish SMA Cross
• Symbol: (X) on the Top
• Event: The fast SMA crosses above the Slow SMA
(ii) Bearish RSI Cross
• Symbol: (X) on the Bottom
• Event: The fast SMA crosses below the Slow SMA
□ More about the Indicator
■ MISSION
Enhancing the classic Relative Strength Index (RSI) and making it more accurate on longer timeframes, during choppy market conditions, and especially near market tops/bottoms.
■ OBJECTIVES
(1) Creating a better RSI that works as an “All-in-one” indicator
(2) Identifying overbought/oversold market levels in a simple and user-friendly manner
(3) Making precise calculations near market tops and bottoms, where price volatility is always booming
(4) Making precise calculations on longer timeframes (weekly, monthly) where the classic RSI readings are hardly readable
(5) Offering five different categories of trading signals (RSI, StochRSI, MACD, Golden/Death Crosses, SMAs) in a single indicator
■ RSI PRECISION CALCULATIONS
The RSI PRECISION formula consists of three (3) different components:
(a) Relative Strength Index component (the classic RSI)
(b) Periodic Price Volatility component (PPV, essential)
(c) RSI Volatility component (less important)
RSI PRECISION FORMULA ADJUSTMENTS
(i) CLASSIC RSI
This measurement corresponds to the classic RSI. If the other two components of the formula are set to zero (0%), then by entering 100% here, the RSI PRECISION becomes identical to the classic RSI.
-By default, 100%
(ii) PERIODIC PRICE VOLATILITY -PPV
The Periodic Price Volatility (PPV) is an advanced measurement of price volatility and an essential component of the core RSI PRECISION formula. You can easily adjust the weight of PPV in the formula.
-By default, 100%
(iii) RSI VOLATILITY
This is an extra measurement of volatility. This time the focus is exclusively on periodic RSI volatility, not on price volatility.
-By default, 5%
■ FINAL THOUGHTS
RSI PRECISION v.3 is an improved RSI indicator offering five leading trading signals. Everything is combined in one place to create an all-in-one TA tool. I have been using it as my only indicator for quite some time.
As always, happy trading, and remember, if you want to rule the world, create code, not war.
□ Giorgos Protonotarios,
Financial Analyst, Building Web
(October 5th 2023)

Bitcoin to GOLD [presentTrading]**Introduction and How it is Different**
Unlike traditional indicators, the BTGR offers a unique perspective on market sentiment and asset valuation by juxtaposing two seemingly disparate assets: Bitcoin, the digital gold, and Gold, the traditional store of value. This article introduces an advanced version of this ratio, complete with upper and lower bands calculated using standard deviations. These bands add an extra layer of analytical depth, allowing for more nuanced trading strategies.
BTCUSD 12h bigger picture
**Economic Principles**
The BTGR is rooted in the economic principles of asset valuation and market sentiment. Gold has long been considered a safe haven asset, a place where investors park their money during times of economic uncertainty. Bitcoin, on the other hand, is often viewed as a high-risk, high-reward investment. By comparing the two, the BTGR provides insights into the broader market sentiment.
- Risk Appetite: A high BTGR indicates a bullish sentiment towards riskier assets like Bitcoin.
- Market Uncertainty: A low BTGR suggests a bearish sentiment and a flight to the safety of Gold.
- Asset Diversification: The BTGR can be used as a tool for portfolio diversification, helping investors balance risk and reward.
**How to Use It**
Setting Up the Indicator
- Platform: The indicator is designed for use on TradingView.
- Time Frame: A 480-minute time frame is recommended for more accurate signals.
- Parameters: The moving average is set at 200 periods, and the standard deviation is calculated over the same period.
**Trading Signal**
Long Entry: Consider going long when the BTGR crosses above the upper band.
Short Entry: Consider going short when the BTGR crosses below the lower band.
Note: Due to the issue that the number of trading is less than about 100 times, the corresponding strategy is not allowed to publish.
