Relative Performance Indicator by ComLucro - 2025_V01The "Relative Performance Indicator by ComLucro - 2025_V01" is a powerful tool designed to analyze an asset's performance relative to a benchmark index over multiple timeframes. This indicator provides traders with a clear view of how their chosen asset compares to a market index in short, medium, and long-term periods.
Key Features:
Customizable Lookback Periods: Analyze performance across three adjustable periods (default: 20, 50, and 200 bars).
Relative Performance Analysis: Calculate and visualize the difference in percentage performance between the asset and the benchmark index.
Dynamic Summary Label: Displays a detailed breakdown of the asset's and index's performance for the latest bar.
User-Friendly Interface: Includes customizable colors and display options for clear visualization.
How It Works:
The script fetches closing prices of both the asset and a benchmark index.
It calculates percentage changes over the selected lookback periods.
The indicator then computes the relative performance difference between the asset and the index, plotting it on the chart for easy trend analysis.
Who Is This For?:
Traders and investors who want to compare an asset’s performance against a benchmark index.
Those looking to identify trends and deviations between an asset and the broader market.
Disclaimer:
This tool is for educational purposes only and does not constitute financial or trading advice. Always use it alongside proper risk management strategies and backtest thoroughly before applying it to live trading.
Chart Recommendation:
Use this script on clean charts for better clarity. Combine it with other technical indicators like moving averages or trendlines to enhance your analysis. Ensure you adjust the lookback periods to match your trading style and the timeframe of your analysis.
Additional Notes:
For optimal performance, ensure the benchmark index's data is available on your TradingView subscription. The script uses fallback mechanisms to avoid interruptions when index data is unavailable. Always validate the settings and test them to suit your trading strategy.
Trading

Phase Cross Strategy with Zone### Introduction to the Strategy
Welcome to the **Phase Cross Strategy with Zone and EMA Analysis**. This strategy is designed to help traders identify potential buy and sell opportunities based on the crossover of smoothed oscillators (referred to as "phases") and exponential moving averages (EMAs). By combining these two methods, the strategy offers a versatile tool for both trend-following and short-term trading setups.
### Key Features
1. **Phase Cross Signals**:
- The strategy uses two smoothed oscillators:
- **Leading Phase**: A simple moving average (SMA) with an upward offset.
- **Lagging Phase**: An exponential moving average (EMA) with a downward offset.
- Buy and sell signals are generated when these phases cross over or under each other, visually represented on the chart with green (buy) and red (sell) labels.
2. **Phase Zone Visualization**:
- The area between the two phases is filled with a green or red zone, indicating bullish or bearish conditions:
- Green zone: Leading phase is above the lagging phase (potential uptrend).
- Red zone: Leading phase is below the lagging phase (potential downtrend).
3. **EMA Analysis**:
- Includes five commonly used EMAs (13, 26, 50, 100, and 200) for additional trend analysis.
- Crossovers of the EMA 13 and EMA 26 act as secondary buy/sell signals to confirm or enhance the phase-based signals.
4. **Customizable Parameters**:
- You can adjust the smoothing length, source (price data), and offset to fine-tune the strategy for your preferred trading style.
### What to Pay Attention To
1. **Phases and Zones**:
- Use the green/red phase zone as an overall trend guide.
- Avoid taking trades when the phases are too close or choppy, as it may indicate a ranging market.
2. **EMA Trends**:
- Align your trades with the longer-term trend shown by the EMAs. For example:
- In an uptrend (price above EMA 50 or EMA 200), prioritize buy signals.
- In a downtrend (price below EMA 50 or EMA 200), prioritize sell signals.
3. **Signal Confirmation**:
- Consider combining phase cross signals with EMA crossovers for higher-confidence trades.
- Look for confluence between the phase signals and EMA trends.
4. **Risk Management**:
- Always set stop-loss and take-profit levels to manage risk.
- Use the phase and EMA zones to estimate potential support/resistance areas for exits.
5. **Whipsaws and False Signals**:
- Be cautious in low-volatility or sideways markets, as the strategy may generate false signals.
- Use additional indicators or filters to avoid entering trades during unclear market conditions.
### How to Use
1. Add the strategy to your chart in TradingView.
2. Adjust the input settings (e.g., smoothing length, offsets) to suit your trading preferences.
3. Enable the strategy tester to evaluate its performance on historical data.
4. Combine the signals with your own analysis and risk management plan for best results.
This strategy is a versatile tool, but like any trading method, it requires proper understanding and discretion. Always backtest thoroughly and trade with discipline. Let me know if you need further assistance or adjustments to the strategy!

Relative Trend Navigator Pro [QuantAlgo]Upgrade your trend-following investing and trading strategy with Relative Trend Navigator Pro by QuantAlgo , a sophisticated technical indicator that combines adaptive trend recognition with dynamic momentum analysis to deliver high quality market insights. Whether you're a medium- to long-term investor focusing on sustained moves or an active trader seeking high-probability entries, this indicator's multi-layered approach offers valuable strategic advantages that you don't want to miss out on!
🟢 Core Architecture
The foundation of this indicator lies in its innovative Relative Trend Index (RTI) calculation and dynamic state management system. By implementing a unique array-based analysis alongside statistical volatility measures, each price movement is evaluated against its historical context while maintaining responsiveness to current market conditions. This sophisticated approach helps distinguish genuine trend developments from market noise across various timeframes and instruments.
🟢 Technical Foundation
Three key components power this indicator are:
Dynamic Trend Boundaries: Utilizes standard deviation-based channels to establish adaptive price ranges
Array-Based Historical Analysis: A comprehensive dynamic momentum system that processes and sorts historical data for trend context
Relative Trend Index (RTI): A normalized calculation that measures current price position relative to historical boundaries
🟢 Key Features & Signals
The Relative Trend Navigator Pro delivers market insights through:
Color-adaptive RTI line that reflects trend strength and direction
Dynamic threshold levels for bull and bear signal generation
Smart fill coloring between RTI and zero line for enhanced visualization
Clear entry and exit markers for validated trend changes
Intelligent bar coloring that highlights current trend state
Customizable alert system for both bullish and bearish setups
🟢 Practical Usage Tips
Here's how to maximize your use of the Relative Trend Navigator Pro :
1/ Setup:
Add the indicator to your favorites ⭐️
Begin with the default historical lookback for balanced analysis
Use the default sensitivity setting for optimal signal generation
Start with standard threshold levels
Customize visualization colors to match your chart preferences
Enable both bar coloring and signal markers for complete visual feedback
2/ Reading Signals:
Watch for signal markers - they indicate validated trend transitions
Monitor RTI line color changes for trend direction confirmation
Observe the fill color between RTI and zero line for trend strength
Use the built-in alert system to stay informed of potential trend changes
🟢 Pro Tips
Adjust Historical Lookback Period based on your preferred timeframe:
→ Lower values (20-50) for more responsive signals
→ Higher values (100-200) for more stable trend identification
Fine-tune Sensitivity based on market conditions:
→ Higher values (95-100) for choppy markets
→ Lower values (85-95) for trending markets
Optimize Threshold Levels for your strategy:
→ Increase thresholds for stronger trend confirmation
→ Decrease thresholds for earlier entries
Combine with:
→ Volume analysis for trade confirmation
→ Multiple timeframe analysis for strategic context
→ Support/resistance levels for entry/exit refinement
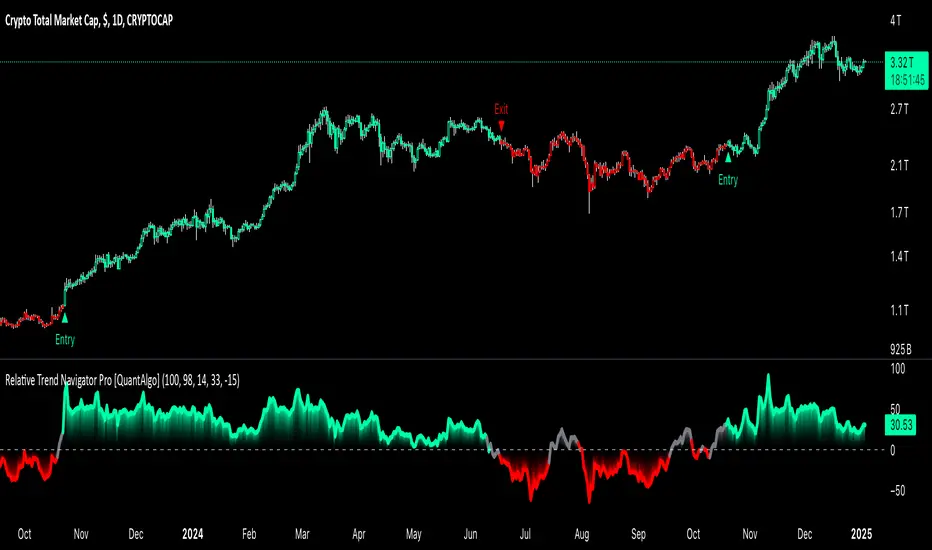
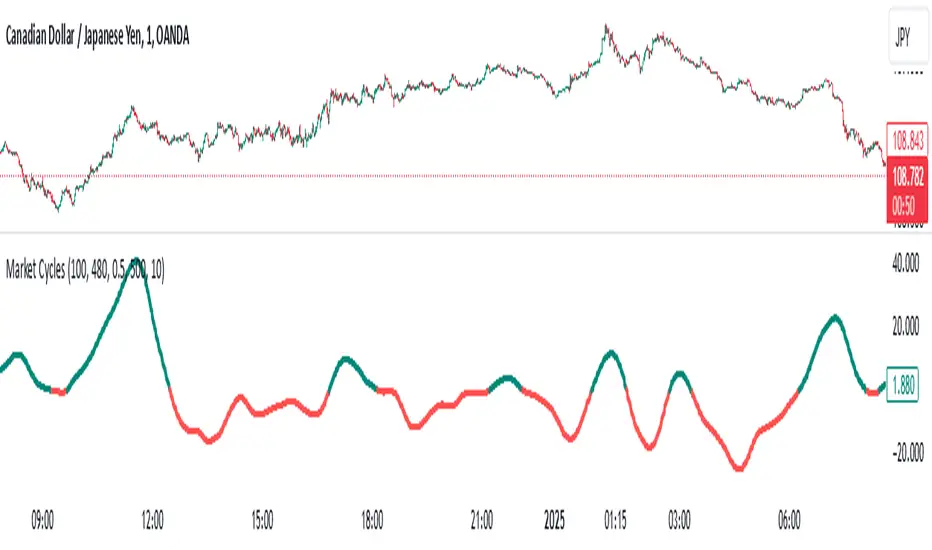
Market Cycles
The Market Cycles indicator transforms market price data into a stochastic wave, offering a unique perspective on market cycles. The wave is bounded between positive and negative values, providing clear visual cues for potential bullish and bearish trends. When the wave turns green, it signals a bullish cycle, while red indicates a bearish cycle.
Designed to show clarity and precision, this tool helps identify market momentum and cyclical behavior in an intuitive way. Ideal for fine-tuning entries or analyzing broader trends, this indicator aims to enhance the decision-making process with simplicity and elegance.
Dual Bayesian For Loop [QuantAlgo]Discover the power of probabilistic investing and trading with Dual Bayesian For Loop by QuantAlgo , a cutting-edge technical indicator that brings statistical rigor to trend analysis. By merging advanced Bayesian statistics with adaptive market scanning, this tool transforms complex probability calculations into clear, actionable signals—perfect for both data-driven traders seeking statistical edge and investors who value probability-based confirmation!
🟢 Core Architecture
At its heart, this indicator employs an adaptive dual-timeframe Bayesian framework with flexible scanning capabilities. It utilizes a configurable loop start parameter that lets you fine-tune how recent price action influences probability calculations. By combining adaptive scanning with short-term and long-term Bayesian probabilities, the indicator creates a sophisticated yet clear framework for trend identification that dynamically adjusts to market conditions.
🟢 Technical Foundation
The indicator builds on three innovative components:
Adaptive Loop Scanner: Dynamically evaluates price relationships with adjustable start points for precise control over historical analysis
Bayesian Probability Engine: Transforms market movements into probability scores through statistical modeling
Dual Timeframe Integration: Merges immediate market reactions with broader probability trends through custom smoothing
🟢 Key Features & Signals
The Adaptive Dual Bayesian For Loop transforms complex calculations into clear visual signals:
Binary probability signal displaying definitive trend direction
Dynamic color-coding system for instant trend recognition
Strategic L/S markers at key probability reversals
Customizable bar coloring based on probability trends
Comprehensive alert system for probability-based shifts
🟢 Practical Usage Tips
Here's how you can get the most out of the Dual Bayesian For Loop :
1/ Setup:
Add the indicator to your TradingView chart by clicking on the star icon to add it to your favorites ⭐️
Start with default source for balanced price representation
Use standard length for probability calculations
Begin with Loop Start at 1 for complete price analysis
Start with default Loop Lookback at 70 for reliable sampling size
2/ Signal Interpretation:
Monitor probability transitions across the 50% threshold (0 line)
Watch for convergence of short and long-term probabilities
Use L/S markers for potential trade signals
Monitor bar colors for additional trend confirmation
Configure alerts for significant trend crossovers and reversals, ensuring you can act on market movements promptly, even when you’re not actively monitoring the charts
🟢 Pro Tips
Fine-tune loop parameters for optimal sensitivity:
→ Lower Loop Start (1-5) for more reactive analysis
→ Higher Loop Start (5-10) to filter out noise
Adjust probability calculation period:
→ Shorter lengths (5-10) for aggressive signals
→ Longer lengths (15-30) for trend confirmation
Strategy Enhancement:
→ Compare signals across multiple timeframes
→ Combine with volume for trade validation
→ Use with support/resistance levels for entry timing
→ Integrate other technical tools for even more comprehensive analysis

Range Channel by Atilla YurtsevenThis script creates a dynamic channel around a user-selected moving average (MA). It calculates the relative difference between price and the MA, then finds the average of the positive differences and the negative differences separately. Using these averages, it plots upper and lower bands around the MA as well as a histogram-like oscillator to show when price moves above or below the average thresholds.
How It Works
Moving Average Selection
The indicator allows you to choose among multiple MA types (SMA, EMA, WMA, Linear Regression, etc.). Depending on your preference, it calculates the chosen MA for the selected lookback period.
Relative Difference Calculation
It then computes the percentage difference between the source (typically the closing price) and the MA. (diff = (src / ma - 1) * 100)
Positive & Negative Averages
- Positive differences are averaged and represent how far the price typically moves above the MA.
- Negative differences are similarly averaged for when price moves below the MA.
Range Channel & Oscillator
- The channel is plotted around the MA using the average positive and negative differences (Upper Edge and Lower Edge).
- The “Untrended” histogram plots the difference (diff). Green bars occur when price is above the MA on average, and red bars when below. Two additional lines mark the upper and lower average thresholds on this histogram.
How to Use
Identify Overbought/Oversold Zones: The upper edge can serve as a dynamic overbought level, while the lower edge can suggest potential oversold conditions. When the histogram approaches or crosses these levels, it may signal price extremes relative to its average movement.
Trend Confirmation: Compare price action relative to the channel. If price and the histogram consistently remain above the MA and upper threshold, it could indicate a stronger bullish trend. If they remain below, it might signal a prolonged bearish trend.
Entry/Exit Timings:
- Entry: Traders can look for moments when price breaks back inside the channel from an extreme, anticipating a mean reversion.
- Exit: Watching how price interacts with these dynamic edges can help define stop-loss or take-profit points.
Because these thresholds adapt over time based on actual price behavior, they can be more responsive than fixed-percentage bands. However, like all indicators, it’s most effective when used in conjunction with other technical and fundamental tools.
Disclaimer
This script is provided for educational and informational purposes only. It does not guarantee any specific outcome or profit. Use it at your own discretion and risk.
Trade smart, stay safe.
Atilla Yurtseven

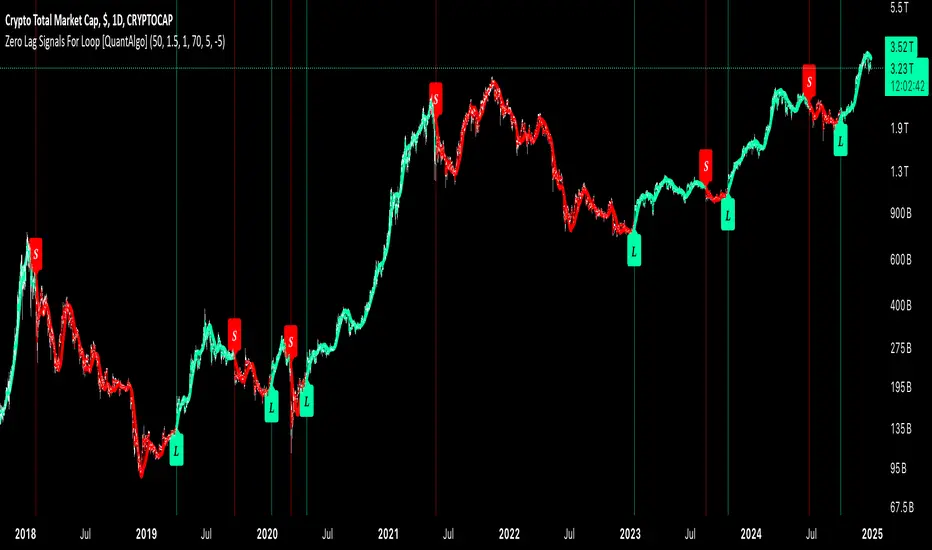
Zero Lag Signals For Loop [QuantAlgo]Elevate your trend-following investing and trading strategy with Zero Lag Signals For Loop by QuantAlgo , a simple yet effective technical indicator that merges advanced zero-lag mechanism with adaptive trend analysis to bring you a fresh take on market momentum tracking. Its aim is to support both medium- to long-term investors monitoring broader market shifts and precision-focused traders seeking quality entries through its dual-focused analysis approach!
🟢 Core Architecture
The foundation of this indicator rests on its zero-lag implementation and dynamic trend assessment. By utilizing a loop-driven scoring system alongside volatility-based filtering, each market movement is evaluated through multiple historical lenses while accounting for current market conditions. This multi-layered approach helps differentiate between genuine trend movements and market noise across timeframe and asset classes.
🟢 Technical Foundation
Three distinct components of this indicator are:
Zero Lag EMA : An enhanced moving average calculation designed to minimize traditional lag effects
For Loop Scoring System : A comprehensive scoring mechanism that weighs current price action against historical contexts
Dynamic Volatility Analysis : A sophisticated ATR-based filter that adjusts signal sensitivity to market conditions
🟢 Key Features & Signals
The Zero Lag Signals For Loop provides market insights through:
Color-coded Zero Lag line that adapts to trend direction
Dynamic fills between price and Zero Lag basis for enhanced visualization
Trend change markers (L/S) that highlight potential reversal points
Smart bar coloring that helps visualize market momentum
Background color changes with vertical lines at significant trend shifts
Customizable alerts for both bullish and bearish reversals
🟢 Practical Usage Tips
Here's how you can get the most out of the Zero Lag Signals For Loop :
1/ Setup:
Add the indicator to your TradingView chart by clicking on the star icon to add it to your favorites ⭐️
Start with the default Zero Lag length for balanced sensitivity
Use the standard volatility multiplier for proper filtering
Keep the default loop range for comprehensive trend analysis
Adjust threshold levels based on your investing and/or trading style
2/ Reading Signals:
Watch for L/S markers - they indicate validated trend reversals
Pay attention to Zero Lag line color changes - they confirm trend direction
Monitor bar colors for additional trend confirmation
Configure alerts for trend changes in both bullish and bearish directions, ensuring you can act on significant technical developments promptly.
🟢 Pro Tips
Fine-tune the Zero Lag length based on your timeframe:
→ Lower values (20-40) for more responsive signals
→ Higher values (60-100) for stronger trend confirmation
Adjust volatility multiplier based on market conditions:
→ Increase multiplier in volatile markets
→ Decrease multiplier in stable trending markets
Combine with:
→ Volume analysis for trade validation
→ Multiple timeframe analysis for broader context
→ Other technical tools for comprehensive analysis
Relative Moving Average (RMA) For Loop [QuantAlgo]Introducing the Relative Moving Averages (RMA) For Loop by QuantAlgo , an innovative technical indicator that combines the smoothness of RMA with an advanced loop-based trend scoring system. Whether you're a day trader looking for high-probability entries or a medium- to long-term investor seeking trend confirmations, this indicator offers a fresh perspective and high-quality signals on market momentum!
💫 Core Architecture
At its heart, the RMA For Loop uses a unique approach to trend detection. Unlike traditional moving average systems that only look at current price relationships, this indicator employs a loop-based scoring mechanism that analyzes historical RMA relationships. Think of it as having multiple trend-confirmation checkpoints - each bar is evaluated against its predecessors to build a comprehensive trend score. This smart scoring system helps filter out market noise while catching meaningful trend reversals.
📊 Technical Foundation
The indicator combines two powerful components:
1/ Relative Moving Average (RMA): A sophisticated moving average that provides smoother price action interpretation than simple or exponential moving averages
2/ For Loop Analysis: A dynamic scoring system that evaluates how current RMA values stack up against historical levels, creating a momentum-based trend score
The magic happens when these components work together:
→ The RMA smooths out price action, reducing false signals
→ The For Loop system analyzes multiple historical points to validate trend strength
→ Crossover confirmations add an extra layer of validation
→ Visual cues provide instant feedback on trend direction and changes
📈 Key Features & Signals
The RMA For Loop provides clear, actionable signals through:
Color-coded RMA line that adapts to trend direction
Dynamic fills between price and RMA for enhanced visualization
Trend change markers (⌽) that pinpoint potential reversal points
Smart bar coloring that helps you "feel" the market's pulse
Customizable alerts for both bullish and bearish reversals
🎯 Practical Usage Tips
Here's how to get the most out of the RMA For Loop:
1/ Initial Setup:
Add the indicator to your TradingView chart by clicking on the star icon to add it to your favorites ⭐️
Start with the default RMA length of 55 for balanced sensitivity
Use the standard loop range (1-70) for comprehensive trend analysis
Adjust threshold levels based on your trading style (higher for fewer but stronger signals)
2/ Reading Signals:
Watch for trend change markers (⌽) - they indicate validated trend reversals
Pay attention to RMA line color changes - they confirm trend direction
Monitor bar colors for additional trend confirmation
Configure alerts for trend changes in both bullish and bearish directions, ensuring you never miss significant technical developments.
⚡️ Pro Tips
Fine-tune the RMA length based on your timeframe:
→ Lower values (20-40) for more responsive signals
→ Higher values (60-100) for stronger trend confirmation
Adjust threshold levels based on market volatility:
→ Increase thresholds in choppy markets
→ Standard settings work well in trending markets
Combine with volume analysis and/or other system(s) for additional confirmation
Use multiple timeframes for a complete market picture

Advanced Trend Navigator Suite [QuantAlgo]Elevate your investing and trading with Advanced Trend Navigator Suite by QuantAlgo! 💫📈
The Advanced Trend Navigator Suite is a versatile technical indicator designed to empower investors and traders across all experience levels with clear, actionable market insights. Built on the proven Hull Moving Average framework and enhanced with proprietary trend scoring technology, this premium tool offers flexible integration with existing strategies while maintaining effectiveness as a standalone system. By combining reduced-lag HMA mechanics with dynamic state management, it provides investors and traders the ability to identify and capitalize on trending opportunities while maintaining robust protection against market noise. Whether your focus is on position trading, swing trading, or long term investing, the Advanced Trend Navigator Suite adapts to various market conditions and asset classes through its customizable parameters and intuitive visual feedback system.
🏛️ Indicator Architecture
The Advanced Trend Navigator Suite provides a sophisticated framework for assessing market trends through a harmonious blend of HMA dynamics and state-based calculations. Unlike traditional moving average systems that use fixed parameters, this indicator incorporates smart trend scoring measurements to automatically adjust its sensitivity to market conditions. The core algorithm employs an optimized HMA system combined with multi-window trend evaluation, creating a self-adjusting mechanism that adapts based on market momentum. This adaptive approach allows the indicator to maintain its effectiveness across different market phases - from ranging to trending conditions. The trend scoring system acts as dynamic confirmation levels, while the gradient fills between HMA and price provide instant visual feedback on trend direction and strength.
📊 Technical Composition and Calculation
The Advanced Trend Navigator Suite is composed of several technical components that create a dynamic trending system:
Hull Moving Average System: Utilizes weighted calculations for primary trend detection
Trend Score Integration: Computes and evaluates momentum across multiple time windows
Dynamic State Management: Creates adaptive boundaries for trend validation
Gradient Visualization: Provides progressive visual feedback on trend strength
📈 Key Indicators and Features
The Advanced Trend Navigator Suite utilizes customizable length parameters for both HMA and trend calculations to adapt to different investing and trading styles. The trend detection component evaluates price action relative to the dynamic state system to validate signals and identify potential reversals.
The indicator incorporates multi-layered visualization with:
Color-coded HMA lines adapting to trend direction
Dynamic gradient fills between HMA and price
State-based candle coloring system
Clear trend reversal signals (▲/▼)
Precise entry/exit point markers
Programmable alerts for trend changes
⚡️ Practical Applications and Examples
✅ Add the Indicator: Add the indicator to your TradingView chart by clicking on the star icon to add it to your favorites ⭐️
👀 Monitor Trends: Watch the HMA line and gradient fills to identify trend direction and strength. The dynamic color transitions and candle coloring provide immediate visual feedback on market conditions.
🎯 Track Signals: Pay attention to the trend reversal markers that appear on the chart:
→ Long signals (▲) appear when price action confirms a bullish trend reversal
→ Short signals (▼) indicate validated bearish trend reversals
🔔 Set Alerts: Configure alerts for trend changes in both bullish and bearish directions, ensuring you never miss significant technical developments.
🌟 Summary and Tips
The Advanced Trend Navigator Suite by QuantAlgo is a sophisticated technical tool designed to support trend-following strategies across different market environments and asset classes. By combining HMA analysis with dynamic trend scoring, it helps traders and investors identify significant trend changes while filtering out market noise, providing validated signals. The tool's adaptability through customizable HMA lengths, trend scoring, and threshold settings makes it suitable for various trading/investing timeframes and styles, allowing users to capture trending opportunities while maintaining protection against false signals.
Key parameters to optimize for your investing and/or trading style:
HMA Length: Adjust for more or less sensitivity to trend changes
Analysis Period: Fine-tune trend calculations for signal stability
Window Range: Balance between quick signals and stability
Threshold Values: Customize trend validation levels
Visual Settings: Customize appearance with color and display options
The Advanced Trend Navigator Suite by QuantAlgo is particularly effective for:
Identifying sustained market trends
Detecting trend reversals with confirmation
Measuring trend strength and duration
Filtering out market noise and false signals
Remember to:
Allow the indicator to validate trend changes before taking action
Combine with volume and other form of analysis and/or system for additional confirmation
Consider multiple timeframes for a complete market view
Adjust thresholds based on market volatility conditions

Adaptive Trend Flow [QuantAlgo]Adaptive Trend Flow 📈🌊
The Adaptive Trend Flow by QuantAlgo is a sophisticated technical indicator that harnesses the power of volatility-adjusted EMAs to navigate market trends with precision. By seamlessly integrating a dynamic dual-EMA system with adaptive volatility bands, this premium tool enables traders and investors to identify and capitalize on sustained market moves while effectively filtering out noise. The indicator's unique approach to trend detection combines classical technical analysis with modern adaptive techniques, providing traders and investors with clear, actionable signals across various market conditions and asset class.
💫 Indicator Architecture
The Adaptive Trend Flow provides a sophisticated framework for assessing market trends through a harmonious blend of EMA dynamics and volatility-based boundary calculations. Unlike traditional moving average systems that use fixed parameters, this indicator incorporates smart volatility measurements to automatically adjust its sensitivity to market conditions. The core algorithm employs a dual EMA system combined with standard deviation-based volatility bands, creating a self-adjusting mechanism that expands and contracts based on market volatility. This adaptive approach allows the indicator to maintain its effectiveness across different market phases - from ranging to trending conditions. The volatility-adjusted bands act as dynamic support and resistance levels, while the gradient visualization system provides instant visual feedback on trend strength and duration.
📊 Technical Composition and Calculation
The Adaptive Trend Flow is composed of several technical components that create a dynamic trending system:
Dual EMA System: Utilizes fast and slow EMAs for primary trend detection
Volatility Integration: Computes and smooths volatility for adaptive band calculation
Dynamic Band Generation: Creates volatility-adjusted boundaries for trend validation
Gradient Visualization: Provides progressive visual feedback on trend strength
📈 Key Indicators and Features
The Adaptive Trend Flow utilizes customizable length parameters for both EMAs and volatility calculations to adapt to different trading styles. The trend detection component evaluates price action relative to the dynamic bands to validate signals and identify potential reversals.
The indicator incorporates multi-layered visualization with:
Color-coded basis and trend lines (bullish/bearish)
Adaptive volatility-based bands
Progressive gradient background for trend duration
Clear trend reversal signals (𝑳/𝑺)
Smooth fills between key levels
Programmable alerts for trend changes
⚡️ Practical Applications and Examples
✅ Add the Indicator: Add the indicator to your TradingView chart by clicking on the star icon to add it to your favorites ⭐️
👀 Monitor Trends: Watch the basis line and trend band interactions to identify trend direction and strength. The gradient background intensity indicates trend duration and conviction.
🎯 Track Signals: Pay attention to the trend reversal markers that appear on the chart:
→ Long signals (𝑳) appear when price action confirms a bullish trend reversal
→ Short signals (𝑺) indicate validated bearish trend reversals
🔔 Set Alerts: Configure alerts for trend changes in both bullish and bearish directions, ensuring you never miss significant technical developments.
🌟 Summary and Tips
The Adaptive Trend Flow by QuantAlgo is a sophisticated technical tool designed to support trend-following strategies across different market environments and asset class. By combining dual EMA analysis with volatility-adjusted bands, it helps traders and investors identify significant trend changes while filtering out market noise, providing validated signals. The tool's adaptability through customizable EMA lengths, volatility smoothing, and sensitivity settings makes it suitable for various trading timeframes and styles, allowing users to capture trending opportunities while maintaining protection against false signals.
Key parameters to optimize for your trading and/or investing style:
Main Length: Adjust for more or less sensitivity to trend changes (default: 10)
Smoothing Length: Fine-tune volatility calculations for signal stability (default: 14)
Sensitivity: Balance band width for trend validation (default: 2.0)
Visual Settings: Customize appearance with color and display options
The Adaptive Trend Flow is particularly effective for:
Identifying sustained market trends
Detecting trend reversals with confirmation
Measuring trend strength and duration
Filtering out market noise and false signals
Remember to:
Allow the indicator to validate trend changes before taking action
Use the gradient background to gauge trend strength
Combine with volume analysis for additional confirmation
Consider multiple timeframes for a complete market view
Adjust sensitivity based on market volatility conditions

Quantum RSI Signals Suite [QuantAlgo]Introducing Quantum RSI Signals Suite 🎯💫
The Quantum RSI Signals Suite by QuantAlgo is a sophisticated technical indicator that combines statistical z-score analysis with enhanced trend following to identify market trends and reversals. This premium system integrates normalized RSI readings with multi-timeframe statistical measurements to help traders and investors identify trend direction and potential reversals. By evaluating both RSI dynamics and directional trend analysis together, this tool enables users to make data-driven trading decisions with statistical validation.
🌊 Indicator Architecture
The Quantum RSI Signals Suite provides a unique framework for assessing market trends through a blend of normalized RSI and dynamic trend-weighted z-score calculations. Unlike traditional RSI indicators that use fixed overbought/oversold levels, this system incorporates statistical measurements and directional trend analysis to adjust sensitivity automatically. By combining normalized RSI values with adaptive z-score zones and trend following analysis, it evaluates both current market conditions and historical context, while the statistical parameters ensure stable yet responsive signals. This quantum approach allows users to identify trending conditions while remaining aware of statistical extremes, enhancing both trend-following and mean-reversion strategies.
📊 Technical Composition and Calculation
The Quantum RSI Signals Suite is composed of several technical components that create a dynamic trending system:
RSI Normalization: Utilizes scaled RSI values (-1 to 1) for balanced momentum representation
Z-Score Analysis: Computes statistical significance of RSI movements to determine dynamic zones
Trend Following Analysis: Analyzes historical z-score movements to identify persistent trends
Signal Amplification: Combines z-score with trend analysis for enhanced signal generation
📈 Key Indicators and Features
The Quantum RSI Signals Suite utilizes normalized RSI with customizable length and z-score parameters to adapt to different trading styles. Advanced calculations are applied to determine statistical significance levels, providing context-aware boundaries for trend identification. The trend following component evaluates historical z-score movements to validate signals and identify potential reversals.
The indicator incorporates multi-layered visualization with:
Color-coded histogram and trend representation (bullish/bearish)
Combined statistical and trend-based signals
Dynamic trend-weighted scoring system
Mean reversion signals with distinct markers (⤻/↷)
Gradient fills for better visual clarity
Programmable alerts for trend changes
⚡️ Practical Applications and Examples
✅ Add the Indicator: Add the indicator to your TradingView chart by clicking on the star icon to add it to your favorites ⭐️
👀 Monitor Signals: Watch the final score's position relative to the zero line to identify trend direction and potential reversals. The combined histogram and line visualization makes trend changes clearly visible.
🎯 Track Signals: Pay attention to the mean reversion markers that appear above and below the price chart:
→ Upward triangles (⤻) signal potential bullish reversals when final score crosses above zero
→ X crosses (↷) indicate potential bearish reversals when final score crosses below zero
🔔 Set Alerts: Configure alerts for trend changes in both bullish and bearish directions, ensuring you can act on significant technical developments promptly.
🌟 Summary and Tips
The Quantum RSI Signals Suite by QuantAlgo is a sophisticated technical tool, designed to support both trend following and mean reversion strategies across different market environments. By combining normalized RSI analysis with statistical z-score measurements and trend following analysis, it helps traders and investors identify significant trend changes while measuring statistical extremes, providing validated signals. The tool's adaptability through customizable RSI length, z-score parameters, and trend analysis settings makes it suitable for various trading timeframes and styles, allowing users to capture opportunities while maintaining awareness of statistical market conditions.
Key parameters to optimize for your trading or investing style:
RSI Length: Adjust for more or less sensitivity to price changes (default: 14)
Z-Score Length: Fine-tune the statistical window for signal stability (default: 20)
Trend Analysis Range: Balance historical context with current market conditions
Source Data: Customize price input for specialized strategies

skX FVG Enhanced Indicator [1m,5m] skX FVG Indicator
Fair Value Gaps (FVGs) are particularly effective for scalping altcoins due to their tendency to fill price inefficiencies. These gaps occur during strong momentum moves where price leaves an 'empty' zone that often acts as a magnet for price to return to. In the volatile alt market, these gaps frequently present high-probability scalping opportunities.
Why FVGs Work in Alts:
• Quick price movements create more gaps
• Higher volatility increases gap frequency
• Institutional algorithms tend to fill these inefficiencies
• Works especially well in lower timeframes (1-5m)
Key Features:
✓ Automatic FVG detection with size filtering
✓ Smart timeframe adaptation (1m, 5m, Custom settings)
✓ Trend detection using 8/21/55 EMA system
✓ Dynamic TP/SL levels based on ATR
✓ Risk:Reward ratio automation
✓ Visual signals that stick to price levels
✓ Clear information display panel
✓ Built-in alerts system
How to Use:
1. Select your preferred timeframe (1m or 5m recommended)
2. Watch for triangle signals (▲ bullish, ▼ bearish)
3. Confirm with trend direction (shown in panel)
4. Use provided TP/SL levels for trade management
5. Set alerts for new FVG formations
Settings Explained:
• Auto Mode: Adjusts gap size to timeframe
• Custom Gap Size: Manual gap size control
• ATR Period: Volatility measurement window
• ATR Multiplier: Stop loss distance
• Risk:Reward: Take profit ratio
Best Practices:
• Use in conjunction with support/resistance
• Trade in direction of main trend
• Monitor higher timeframe structure
• Start with recommended settings
• Backtest before live trading
Note: This indicator works best in volatile market conditions and should be used as part of a complete trading strategy.
Good luck trading!
-skX

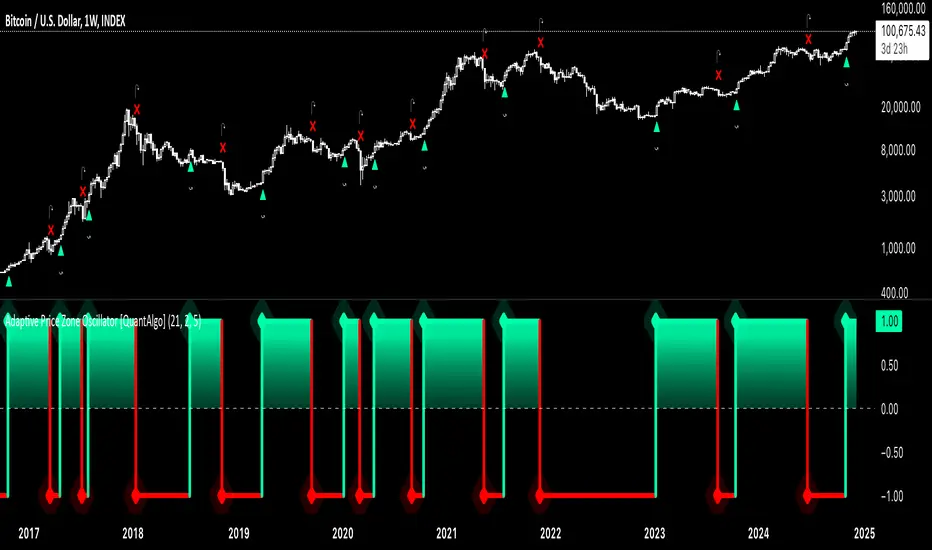
Adaptive Price Zone Oscillator [QuantAlgo]Adaptive Price Zone Oscillator 🎯📊
The Adaptive Price Zone (APZ) Oscillator by QuantAlgo is an advanced technical indicator designed to identify market trends and reversals through adaptive price zones based on volatility-adjusted bands. This sophisticated system combines typical price analysis with dynamic volatility measurements to help traders and investors identify trend direction, potential reversals, and market volatility conditions. By evaluating both price action and volatility together, this tool enables users to make informed trading decisions while adapting to changing market conditions.
💫 Dynamic Zone Architecture
The APZ Oscillator provides a unique framework for assessing market trends through a blend of smoothed typical prices and volatility-based calculations. Unlike traditional oscillators that use fixed parameters, this system incorporates dynamic volatility measurements to adjust sensitivity automatically, helping users determine whether price movements are significant relative to current market conditions. By combining smoothed price trends with adaptive volatility zones, it evaluates both directional movement and market volatility, while the smoothing parameters ensure stable yet responsive signals. This adaptive approach allows users to identify trending conditions while remaining aware of volatility expansions and contractions, enhancing both trend-following and mean-reversion strategies.
📊 Indicator Components & Mechanics
The APZ Oscillator is composed of several technical components that create a dynamic trending system:
Typical Price: Utilizes HLC3 (High, Low, Close average) as a balanced price representation
Volatility Measurement: Computes exponential moving average of price changes to determine dynamic zones
Smoothed Calculations: Applies additional smoothing to reduce noise while maintaining responsiveness
Trend Detection: Evaluates price position relative to adaptive zones to determine market direction
📈 Key Indicators and Features
The APZ Oscillator utilizes typical price with customizable length and threshold parameters to adapt to different trading styles. Volatility calculations are applied to determine zone boundaries, providing context-aware levels for trend identification. The trend detection component evaluates price action relative to the adaptive zones, helping validate trends and identify potential reversals.
The indicator also incorporates multi-layered visualization with:
Color-coded trend representation (bullish/bearish)
Clear trend state indicators (+1/-1)
Mean reversion signals with distinct markers
Gradient fills for better visual clarity
Programmable alerts for trend changes
⚡️ Practical Applications and Examples
✅ Add the Indicator : Add the indicator to your TradingView chart by clicking on the star icon to add it to your favorites ⭐️
👀 Monitor Trend State : Watch the oscillator's position relative to the zero line to identify trend direction and potential reversals. The step-line visualization with diamonds makes trend changes clearly visible.
🎯 Track Signals : Pay attention to the mean reversion markers that appear above and below the price chart:
→ Upward triangles (⤻) signal potential bullish reversals
→ X crosses (↷) indicate potential bearish reversals
🔔 Set Alerts : Configure alerts for trend changes in both bullish and bearish directions, ensuring you can act on significant technical developments promptly.
🌟 Summary and Tips
The Adaptive Price Zone Oscillator by QuantAlgo is a versatile technical tool, designed to support both trend following and mean reversion strategies across different market environments. By combining smoothed typical price analysis with dynamic volatility-based zones, it helps traders and investors identify significant trend changes while measuring market volatility, providing reliable technical signals. The tool's adaptability through customizable length, threshold, and smoothing parameters makes it suitable for various trading timeframes and styles, allowing users to capture opportunities while maintaining awareness of changing market conditions.
Key parameters to optimize for your trading style:
APZ Length: Adjust for more or less sensitivity to price changes
Threshold: Fine-tune the volatility multiplier for wider or narrower zones
Smoothing: Balance noise reduction with signal responsiveness
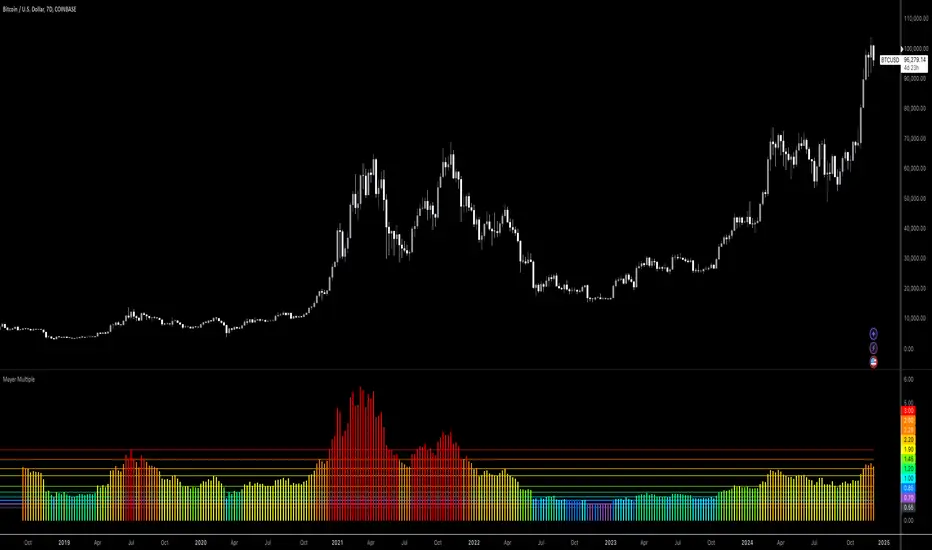
Bitcoin: Mayer MultipleMayer Multiple Indicator
The Mayer Multiple is a powerful tool designed to help traders assess market conditions and identify optimal buying or selling opportunities. It calculates the ratio between the current price and its 200-day simple moving average (SMA), visualizing key thresholds that indicate value zones, caution areas, and overheated markets.
Key Features:
Dynamic Market Zones: Clearly marked levels like "Smash Buy," "Boost DCA," and "Extreme Euphoria" to guide your trading decisions.
Customizable Input: Adjust the SMA length to fit your strategy.
Color-Coded Signals: Intuitive visualization of market sentiment for quick analysis.
Comprehensive Thresholds: Historical insights into price behavior with plotted reference levels based on probabilities.
This indicator is ideal for traders aiming to enhance their long-term strategies and improve decision-making in volatile markets. Use it to gain an edge in identifying potential turning points and managing risk effectively.
EMA Volatility Channel [QuantAlgo]EMA Volatility Channel 🌊📈
The EMA Volatility Channel by QuantAlgo is an advanced technical indicator designed to capture price volatility and trend dynamics through adaptive channels based on exponential moving averages. This sophisticated system combines EMA-based trend analysis with dynamic volatility-adjusted bands to help traders and investors identify trend direction, potential reversals, and market volatility conditions. By evaluating both price momentum and volatility together, this tool enables users to make informed trading decisions while adapting to changing market conditions.
💫 Dynamic Channel Architecture
The EMA Volatility Channel provides a unique framework for assessing market trends through a blend of exponential moving averages and volatility-based channel calculations. Unlike traditional channel indicators that use fixed-width bands, this system incorporates dynamic volatility measurements to adjust channel width automatically, helping users determine whether price movements are significant relative to current market conditions. By combining smooth EMA trends with adaptive volatility bands, it evaluates both directional movement and market volatility, while the smoothing parameters ensure stable yet responsive channel adjustments. This adaptive approach allows users to identify trending conditions while remaining aware of volatility expansions and contractions, enhancing both trend-following and reversal strategies.
📊 Indicator Components & Mechanics
The EMA Volatility Channel is composed of several technical components that create a dynamic channel system:
EMA Midline: Calculates a smoothed exponential moving average that serves as the channel's centerline, providing a clear reference for trend direction.
Volatility Measurement: Computes average price movement to determine dynamic channel width, adapting to changing market conditions automatically.
Smooth Band Calculation: Applies additional smoothing to the channel bands, reducing noise while maintaining responsiveness to significant price movements.
📈 Key Indicators and Features
The EMA Volatility Channel combines various technical tools to deliver a comprehensive analysis of market conditions.
The indicator utilizes exponential moving averages with customizable length and smoothing parameters to adapt to different trading styles. Volatility calculations are applied to determine channel width, providing context-aware boundaries for price movement. The trend detection component evaluates price action relative to the channel bands, helping validate trends and identify potential reversals.
The indicator incorporates multi-layered visualization with color-coded channels and bars to signal both trend direction and market position. These adaptive visual cues, combined with programmable alerts for channel breakouts, help traders and investors track both trend changes and volatility conditions, supporting both trend-following and mean-reversion strategies.
⚡️ Practical Applications and Examples
✅ Add the Indicator: Add the indicator to your TradingView chart by clicking on the star icon to add it to your favorites ⭐️
👀 Monitor Channel Position: Watch the price position relative to the channel bands to identify trend direction and potential reversals. When price moves outside the channel, consider potential trend changes or extreme conditions.
🔔 Set Alerts: Configure alerts for channel breakouts and trend changes, ensuring you can act on significant technical developments promptly.
🌟 Summary and Tips
The EMA Volatility Channel by QuantAlgo is a versatile technical tool, designed to support both trend following and volatility analysis across different market environments. By combining smooth EMA trends with dynamic volatility-based channels, it helps traders and investors identify significant price movements while measuring market volatility, providing reliable technical signals. The tool's adaptability across timeframes makes it suitable for both trend-following and reversal strategies, allowing users to capture opportunities while maintaining awareness of changing market conditions.

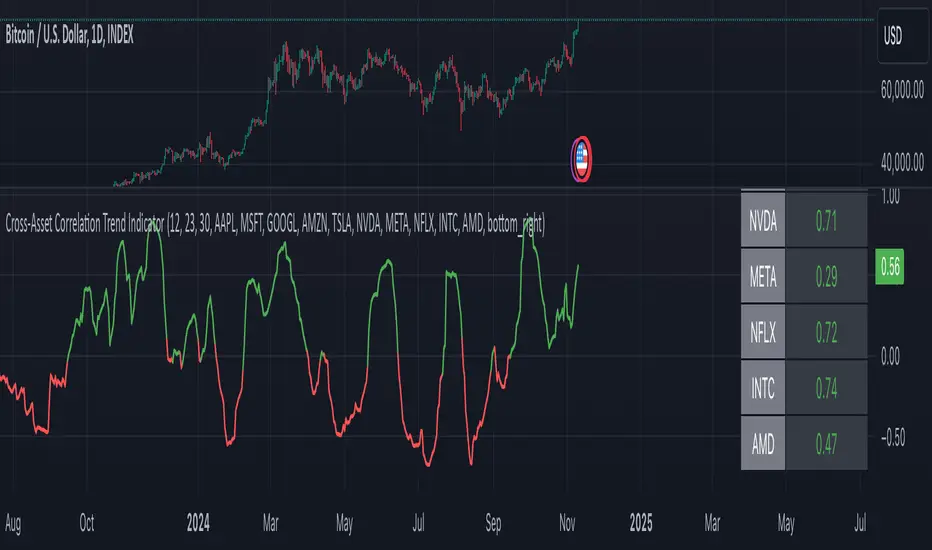
Adapted RSI w/ Multi-Asset Regime Detection v1.1The relative strength index (RSI) is a momentum indicator used in technical analysis. RSI measures the speed and magnitude of an asset's recent price changes to detect overbought or oversold conditions in the price of said asset.
In addition to identifying overbought and oversold assets, the RSI can also indicate whether your desired asset may be primed for a trend reversal or a corrective pullback in price. It can signal when to buy and sell.
The RSI will oscillate between 0 and 100. Traditionally, an RSI reading of 70 or above indicates an overbought condition. A reading of 30 or below indicates an oversold condition.
The RSI is one of the most popular technical indicators. I intend to offer a fresh spin.
Adapted RSI w/ Multi-Asset Regime Detection
Our Adapted RSI makes necessary improvements to the original Relative Strength Index (RSI) by combining multi-timeframe analysis with multi-asset monitoring and providing traders with an efficient way to analyse market-wide conditions across different timeframes and assets simultaneously. The indicator automatically detects market regimes and generates clear signals based on RSI levels, presenting this data in an organised, easy-to-read format through two dynamic tables. Simplicity is key, and having access to more RSI data at any given time, allows traders to prepare more effectively, especially when trading markets that "move" together.
How we calculate the RSI
First, the RSI identifies price changes between periods, calculating gains and losses from one look-back period to the next. This look-back period averages gains and losses over 14 periods, which in this case would be 14 days, and those gains/losses are calculated based on the daily closing price. For example:
Average Gain = Sum of Gains over the past 14 days / 14
Average Loss = Sum of Losses over the past 14 days / 14
Then we calculate the Relative Strength (RS):
RS = Average Gain / Average Loss
Finally, this is converted to the RSI value:
RSI = 100 - (100 / (1 + RS))
Key Features
Our multi-timeframe RSI indicator enhances traditional technical analysis by offering synchronised Daily, Weekly, and Monthly RSI readings with automatic regime detection. The multi-asset monitoring system allows tracking of up to 10 different assets simultaneously, with pre-configured major pairs that can be customised to any asset selection. The signal generation system provides clear market guidance through automatic regime detection and a five-level signal system, all presented through a sophisticated visual interface with dynamic RSI line colouring and customisable display options.
Quick Guide to Use it
Begin by adding the indicator to your chart and configuring your preferred assets in the "Asset Comparison" settings.
Position the two information tables according to your preference.
The main table displays RSI analysis across three timeframes for your current asset, while the asset table shows a comparative analysis of all monitored assets.
Signals are colour-coded for instant recognition, with green indicating bullish conditions and red for bearish conditions. Pay special attention to regime changes and signal transitions, using multi-timeframe confluence to identify stronger signals.
How it Works (Regime Detection & Signals)
When we say 'Regime', a regime is determined by a persistent trend or in this case momentum and by leveraging this for RSI, which is a momentum oscillator, our indicator employs a relatively simple regime detection system that classifies market conditions as either Bullish (RSI > 50) or Bearish (RSI < 50). Our benchmark between a trending bullish or bearish market is equal to 50. By leveraging a simple classification system helps determine the probability of trend continuation and the weight given to various signals. Whilst we could determine a Neutral regime for consolidating markets, we have employed a 'neutral' signal generation which will be further discussed below...
Signal generation occurs across five distinct levels:
Strong Buy (RSI < 15)
Buy (RSI < 30)
Neutral (RSI 30-70)
Sell (RSI > 70)
Strong Sell (RSI > 85)
Each level represents different market conditions and probability scenarios. For instance, extreme readings (Strong Buy/Sell) indicate the highest probability of mean reversion, while neutral readings suggest equilibrium conditions where traders should focus on the overall regime bias (Bullish/Bearish momentum).
This approach offers traders a new and fresh spin on a popular and well-known tool in technical analysis, allowing traders to make better and more informed decisions from the well presented information across multiple assets and timeframes. Experienced and beginner traders alike, I hope you enjoy this adaptation.

simple swing indicator-KTRNSE:NIFTY
1. Pivot High/Low as Lines:
Purpose: Identifies local peaks (pivot highs) and troughs (pivot lows) in price and draws horizontal lines at these levels.
How it Works:
A pivot high occurs when the price is higher than the surrounding bars (based on the pivotLength parameter).
A pivot low occurs when the price is lower than the surrounding bars.
These pivots are drawn as horizontal lines at the price level of the pivot.
Visualization:
Pivot High: A red horizontal line is drawn at the price level of the pivot high.
Pivot Low: A green horizontal line is drawn at the price level of the pivot low.
Example:
Imagine the price is trending up, and at some point, it forms a peak. The script identifies this peak as a pivot high and draws a red line at the price of that peak. Similarly, if the price forms a trough, the script will draw a green line at the low point.
2. Moving Averages (20-day and 50-day):
Purpose: Plots the 20-day and 50-day simple moving averages (SMA) on the chart.
How it Works:
The 20-day SMA smooths the closing price over the last 20 days.
The 50-day SMA smooths the closing price over the last 50 days.
These lines provide an overview of short-term and long-term price trends.
Visualization:
20-day SMA: A blue line showing the 20-day moving average.
50-day SMA: An orange line showing the 50-day moving average.
Example:
When the price is above both moving averages, it indicates an uptrend. If the price crosses below these averages, it might signal a downtrend.
3. Supertrend:
Purpose: The Supertrend is an indicator based on the Average True Range (ATR) and is used to track the market trend.
How it Works:
When the market is in an uptrend, the Supertrend line will be green.
When the market is in a downtrend, the Supertrend line will be red.
Visualization:
Uptrend: The Supertrend line will be plotted in green.
Downtrend: The Supertrend line will be plotted in red.
Example:
If the price is above the Supertrend, the market is considered to be in an uptrend, and if the price is below the Supertrend, the market is in a downtrend.
4. Momentum (Rate of Change):
Purpose: Measures the rate at which the price changes over a set period, showing if the momentum is positive or negative.
How it Works:
The Rate of Change (ROC) measures how much the price has changed over a certain number of periods (e.g., 14).
Positive ROC indicates upward momentum, and negative ROC indicates downward momentum.
Visualization:
Positive ROC: A purple line is plotted above the zero line.
Negative ROC: A purple line is plotted below the zero line.
Example:
If the ROC line is above zero, it means the price is increasing, suggesting bullish momentum. If the ROC is below zero, it indicates bearish momentum.
5. Volume:
Purpose: Displays the volume of traded assets, giving insight into the strength of price movements.
How it Works:
The script will color the volume bars based on whether the price closed higher or lower than the previous bar.
Green bars indicate bullish volume (closing price higher than the previous bar), and red bars indicate bearish volume (closing price lower than the previous bar).
Visualization:
Bullish Volume: Green volume bars when the price closes higher.
Bearish Volume: Red volume bars when the price closes lower.
Example:
If you see a green volume bar, it suggests that the market is participating in an uptrend, and the price has closed higher than the previous period. Red bars indicate a downtrend or selling pressure.
6. MACD (Moving Average Convergence Divergence):
Purpose: The MACD is a trend-following momentum indicator that shows the relationship between two moving averages of the price.
How it Works:
The MACD Line is the difference between the 12-period EMA (Exponential Moving Average) and the 26-period EMA.
The Signal Line is the 9-period EMA of the MACD Line.
The MACD Histogram shows the difference between the MACD line and the Signal line.
Visualization:
MACD Line: A blue line representing the difference between the 12-period and 26-period EMAs.
Signal Line: An orange line representing the 9-period EMA of the MACD line.
MACD Histogram: A red or green histogram that shows the difference between the MACD line and the Signal line.
Example:
When the MACD line crosses above the Signal line, it’s considered a bullish signal. When the MACD line crosses below the Signal line, it’s considered a bearish signal.
Full Chart Example:
Imagine you're looking at a price chart with all the indicators:
Pivot High/Low Lines are drawn as red and green horizontal lines.
20-day and 50-day SMAs are plotted as blue and orange lines, respectively.
Supertrend shows a green or red line indicating the trend.
Momentum (ROC) is shown as a purple line oscillating around zero.
Volume bars are green or red based on whether the close is higher or lower.
MACD appears as a blue line and orange line, with a red or green histogram showing the MACD vs. Signal line difference.
How the Indicators Work Together:
Trend Confirmation: If the price is above the Supertrend line and both SMAs are trending up, it indicates a strong bullish trend.
Momentum: If the ROC is positive and the MACD line is above the Signal line, it further confirms bullish momentum.
Volume: Increasing volume, especially with green bars, suggests that the trend is being supported by active participation.
By using these combined indicators, you can get a comprehensive view of the market's trend, momentum, and potential reversal points (via pivot highs and lows).

Simple Moving Average with Regime Detection by iGrey.TradingThis indicator helps traders identify market regimes using the powerful combination of 50 and 200 SMAs. It provides clear visual signals and detailed metrics for trend-following strategies.
Key Features:
- Dual SMA System (50/200) for regime identification
- Colour-coded candles for easy trend visualisation
- Metrics dashboard
Core Signals:
- Bullish Regime: Price < 200 SMA
- Bearish Regime: Price > 200 SMA
- Additional confirmation: 50 SMA Cross-over or Cross-under (golden cross or death cross)
Metrics Dashboard:
- Current Regime Status (Bull/Bear)
- SMA Distance (% from price to 50 SMA)
- Regime Distance (% from price to 200 SMA)
- Regime Duration (bars in current regime)
Usage Instructions:
1. Apply the indicator to your chart
2. Configure the SMA lengths if desired (default: 50/200)
3. Monitor the color-coded candles:
- Green: Bullish regime
- Red: Bearish regime
4. Use the metrics dashboard for detailed analysis
Settings Guide:
- Length: Short-term SMA period (default: 50)
- Source: Price calculation source (default: close)
- Regime Filter Length: Long-term SMA period (default: 200)
- Regime Filter Source: Price source for regime calculation (default: close)
Trading Tips:
- Use bullish regimes for long positions
- Use bearish regimes for capital preservation or short positions
- Consider regime duration for trend strength
- Monitor distance metrics for potential reversals
- Combine with other systems for confluence
#trend-following #moving average #regime #sma #momentum
Risk Management:
- Not a standalone trading system
- Should be used with proper position sizing
- Consider market conditions and volatility
- Always use stop losses
Best Practices:
- Monitor multiple timeframes
- Use with other confirmation tools
- Consider fundamental factors
Version: 1.0
Created by: iGREY.Trading
Release Notes
// v1.1 Allows table overlay customisation
// v1.2 Update to v6 pinescript

GP - SRSI ChannelGP - SRSI Channel Indicator
The GP - SRSI Channel is a channel indicator derived from the Stochastic RSI (SRSI) oscillator. It combines SRSI data from multiple timeframes to analyze minimum, maximum, and closing values, forming a channel based on these calculations. The goal is to identify overbought and oversold zones with color coding and highlight potential trading opportunities by indicating trend reversal points.
How It Works
SRSI Calculation: The indicator calculates the Stochastic RSI values using open, high, low, and close prices from the selected timeframes.
Channel Creation: Minimum and maximum values derived from these calculations are combined across multiple timeframes. The midpoint is calculated as the average of these values.
Color Coding: Zones within the channel are color-coded with a gradient from red to green based on the ratios. Green zones typically indicate selling opportunities, while red zones suggest buying opportunities.
Visual Elements:
The channel boundaries (min/max) are displayed as lines.
Overbought/oversold regions (95-100 and 0-5) are highlighted with shaded areas.
Additional explanatory labels are placed on key levels to guide users.
How to Use
Trading Strategy: This indicator can be used for both trend following and identifying reversal points. Selling opportunities can be evaluated when the channel reaches the upper green zone, while buying opportunities can be considered in the lower red zone.
Timeframe Selection: Users can analyze multiple timeframes simultaneously to gain a broader perspective.
Customization: RSI and Stochastic RSI parameters are adjustable, allowing users to tailor the indicator to their trading strategies.
Important Note
This indicator is for informational purposes only and should not be used as a sole basis for trading decisions. Please validate the results of the indicator with your own analysis.

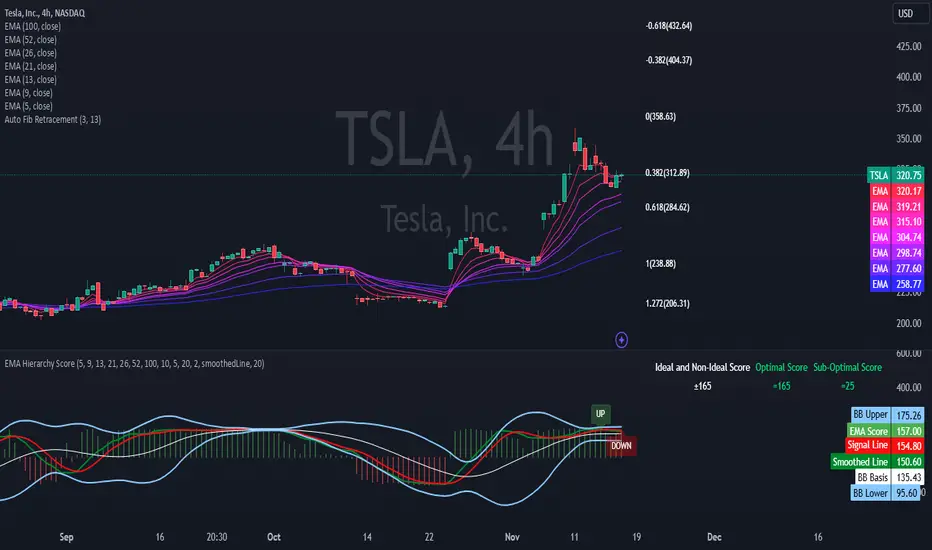
EMA Hierarchy Score V.1.0
EMA Hierarchy Score V.1.0
Purpose
The EMA Hierarchy Score indicator assesses the relative positioning of multiple Exponential Moving Averages (EMAs) for a financial asset. This tool provides insights into trend strength by calculating ideal and non-ideal configurations of EMAs, allowing for effective interpretation when used alongside standard EMA charts.
Variables and Inputs
The indicator organizes a set of EMAs and other metrics into a hierarchy for scoring:
* Primary Variables (A–J):
A: Close price
B: Open price
C: Previous close price
D to J: EMAs of configurable periods (5, 9, 13, 21, 26, 52, 100).
* User Inputs:
* Customizable periods for each EMA, allowing users to adjust the indicator’s sensitivity.
* Customizable period and standard deviation multiplier for Bollinger Bands, enabling further control over the indicator’s analysis.
Mathematical Method
The EMA Hierarchy Score calculates how closely the current EMA structure aligns with an “ideal” configuration through a structured scoring system:
1- Hierarchy Scoring:
* Ideal Order: Defined as A > B > C > D > E > F > G > H > I > J, representing a strong upward trend where each EMA progressively increases.
* Non-Ideal Order: Defined as J > I > H > G > F > E > D > C > B > A, indicating a weak or downward trend where each EMA progressively decreases.
* Optimal Order: Calculated based on achieving maximum alignment with the ideal configuration for each EMA across the chosen period.
* Sub-Optimal Order: The least-aligned structure across the same period.
2- Score Calculation:
* The indicator calculates a score by comparing all EMA pairs in values. For each comparison, a score increment of +1 (ideal) or -1 (non-ideal) is applied.
* The final score reflects the EMA configuration’s deviation from the ideal order:
- Positive Score: Indicates closer alignment with the ideal structure.
- Negative Score: Indicates deviation toward a non-ideal structure.
3- Smoothed and Signal Lines:
* A smoothed score is created using a Simple Moving Average (SMA) of the raw hierarchy score.
* A signal line (an SMA of the smoothed score) further aids in tracking directional shifts in the score.
4- Trend Labels and Bollinger Bands:
* Trend Labels: Display "UP" or "DOWN" based on the smoothed score’s relationship to the signal line.
* Bollinger Bands: Plotted around a selected source (smoothedLine, signalLine, or score) to analyze score volatility and deviations from the mean. The period and standard deviation multiplier for Bollinger Bands are user-configurable.
Result Definition
The Ideal and Non-Ideal Scores represent the upper and lower bounds of achievable configurations, ensuring the score does not exceed these values.
1- Ideal and Non-Ideal Result:
* Calculated based on how closely the current EMA configuration follows the “ideal” ascending or descending order.
* Ideal Score: Defined as +165, representing perfect alignment with the ideal configuration.
* Non-Ideal Score: Defined as -165, indicating full alignment with the descending, non-ideal structure.
* The score is bounded by these values and will not go above or below this range.
2- Optimal and Sub-Optimal Scores:
* Optimal Score: The highest score over the selected scoring period, calculated with the same period as the Bollinger Bands. Using consistent periods reinforces the reliability of the score by aligning with the period already used to gauge volatility.
* Sub-Optimal Score: The lowest score over the same period, capturing points of minimal alignment with the ideal order.
Interpretation and Analysis
1- Use with EMA Charts:
* This indicator is designed to be used alongside EMA charts, as its results provide insights into the relative order of EMAs and their alignment with trend strength.
* The EMA Hierarchy Score interprets the underlying EMA structure, offering additional context on whether current trends are aligned with optimal or non-optimal EMA configurations.
2- Ideal and Non-Ideal Analysis:
* A positive EMA Hierarchy Score indicates an orderly, ideal upward trend, suggesting stronger alignment with the ideal structure.
* A negative score signals a potential downward trend or deviation from the ideal structure.
3 - Trend Indicators and Bands:
* Trend Labels: The "UP" and "DOWN" labels offer real-time feedback on trend direction shifts, based on the smoothed score and signal line relationship.
* Bollinger Bands: Visualize the range of score fluctuations, helping to identify breakout or breakdown points.
4 - Optimal and Sub-Optimal Scores:
* Use the Optimal Score to understand peak trend alignment and Sub-Optimal Score to spot potential reversal or correction zones.
* A consistently high score over time indicates trend stability, while variations may suggest instability.
Quick Reference Table
The table displayed at the top right provides an at-a-glance view of key metrics:
* Ideal and Non-Ideal Score: Fixed at ±165 to represent the calculated ideal and non-ideal configuration.
* Optimal and Sub-Optimal Scores: Show maximum and minimum scores over the scoring period, color-coded green for positive and red for negative values.
This concise table helps users quickly assess indicator values, reducing the need to interpret multiple chart lines and making it easier to understand overall trend strength.
Disclaimer
The EMA Hierarchy Score V.1.0 is a technical analysis tool designed to assist in understanding the alignment and strength of trends as defined by EMA configurations. This indicator does not constitute investment advice, nor does it make specific recommendations for buying or selling assets. Users should consult with a financial advisor before making any trading decisions, as past performance or technical signals do not guarantee future results. The developers of this indicator disclaim all liability for potential financial losses arising from reliance on this tool. Users assume full responsibility for interpreting and applying the indicator’s outputs in their investment decisions.
Anchored Average Trading PriceThis "Anchored Average Trading Price" indicator allows users to anchor the calculation of the average trading price to a specific candle. By selecting an anchor date and time, the indicator begins calculating the average trading price from that point forward. This tool is particularly helpful for traders who want to analyze the price action relative to a key event or a particular point in time on the chart.
Key Features:
1. Flexible Anchoring: The indicator lets you set an anchor time, which determines the specific candle from which the average trading price calculation starts.
2. Customizable Calculation Method: You have the option to choose the basis of the average calculation:
- Open Price
- Close Price
- Average Daily Traded Price (calculated as `(Open + High + Low + Close) / 4`)
3. Automatic Updating: Once the anchor is set, the indicator dynamically updates on each new candle to continuously reflect the average trading price since the anchor point.
Potential Uses and Functionality Expansions:
- Trend Analysis: By observing the average trading price over time, you can gauge market sentiment and track trends from a particular event or time in the market.
- Support and Resistance: Anchoring this indicator to major highs, lows, or significant events could help identify dynamic support and resistance levels as the market interacts with the average price line.
- Customization Options: Future updates could allow additional flexibility, such as:
- A reset feature for users to easily re-anchor without changing the timestamp.
- Additional price calculation methods, like VWAP (Volume Weighted Average Price) for volume-based insights.
- Alerts when price crosses above or below the anchored average, signaling potential entry or exit points.

AI x Meme Impulse Tracker [QuantraSystems]AI x Meme Impulse Tracker
Quantra Systems guarantees that the information created and published within this document and on the Tradingview platform is fully compliant with applicable regulations, does not constitute investment advice, and is not exclusively intended for qualified investors.
Important Note!
The system equity curve presented here has been generated as part of the process of testing and verifying the methodology behind this script.
Crucially, it was developed after the system was conceptualized, designed, and created, which helps to mitigate the risk of overfitting to historical data. In other words, the system was built for robustness, not for simply optimizing past performance.
This ensures that the system is less likely to degrade in performance over time, compared to hyper-optimized systems that are tailored to past data. No tweaks or optimizations were made to this system post-backtest.
Even More Important Note!!
The nature of markets is that they change quickly and unpredictably. Past performance does not guarantee future results - this is a fundamental rule in trading and investing.
While this system is designed with broad, flexible conditions to adapt quickly to a range of market environments, it is essential to understand that no assumptions should be made about future returns based on historical data. Markets are inherently uncertain, and this system - like all trading systems - cannot predict future outcomes.
Introduction
The AI x Meme Impulse Tracker is a cutting-edge, fast-acting rotational algorithm designed to capitalize on the strength of assets within pre-selected categories. Using a custom function built on top of the RSI Pulsar, the system measures momentum through impulses rather than traditional trend following methods. This allows for swifter reallocations based on short bursts of strength.
This system focuses on precision and agility - making it highly adaptable in volatile markets. The strategy is built around three independent asset categories - with allocations only made to the strongest asset in each - ensuring that capital movement (in particular between blockchains) is kept to a minimum for efficiency purposes while maintaining exposure to the highest performing tokens.
Legend
Token Inputs:
The Impulse Tracker is designed with dynamic asset selection - allowing traders to customize the inputs for each category. This feature enables flexible system management, as the number of active tokens within each category can be adjusted at any time. Whether the user chooses the default of 13 tokens per category, or fewer, the system will automatically recalibrate. This ensures that all calculations, from relative strength to individual performance assessments, adjust as required. Disabled tokens are treated by the system as if they don’t exist - seamlessly updating performance metrics and the Impulse Tracker’s allocation behavior to maintain the highest level of efficiency and accuracy.
System Equity Curve:
The Impulse Tracker plots both the rotational system’s equity and the Buy-and-Hold (or ‘HODL’) benchmark of Bitcoin for comparison. While the HODL approach allocates the entire portfolio to Bitcoin and functions as an index to compare to, the Impulse Tracker dynamically allocates based on strength impulses within the chosen tokens and categories. The system equity curve is representative of adding an equal capital split between the strongest assets of each category. The relative strength system does handle ‘ties’ of strength - in this situation multiple tokens from a single category can be included in the final equity curve, with the allocated weight to that category split between the tied assets.
TABLES:
Equity Stats:
This table is held in Quantra System's typical UI design language. It offers a comprehensive snapshot of the system’s performance, with key metrics organized to help traders quickly assess both short-term and cumulative results. The left side provides details on individual asset performance, while the right side presents a comparison of the system’s risk-adjusted metrics against a simple BTC Hodl strategy.
The leftmost column of the Equity Stats table showcases performance indicators for the system’s current allocations. This provides quick identification of the current strongest tokens, based on confirmed and non-repainting data as soon as the current opens and the last bar closes.
The right-hand side compares the performance differences between the system and Hodl profits, both on a cumulative basis and analyzing only the previous bar. The total number of position changes is also tracked in this table - an important metric when calculating total slippage and should be used to determine how ‘hands-on’ the strategy will be on the current timeframe.
The lower part of the table highlights a direct comparison of the AI x Memes Impulse strategy with buy-and-hold Bitcoin. The risk adjusted performance ratios, Sharpe, Sortino and Omega, are shown side by side, as well as the maximum drawdown experienced by both strategies within the set testing window.
Screener Table:
This table provides a detailed breakdown of the performance for each asset that has been the strongest in its category at some point and thus received an allocation. The table tracks several key metrics for each asset - including returns, volatility, Sharpe ratio, Sortino ratio, Omega ratio, and maximum drawdown. It also displays the signals for both current and previous periods, as well as the assets weight in the theoretical portfolio. Assets that have never received a signal are also included, giving traders an overview of which assets have contributed to the portfolio's performance and which have not played a role so far.
The position changes cell also offers important insights, as it shows the frequency of not just total position changes, but also rebalancing events.
Detailed Slippage Table:
The Detailed Slippage Table provides a comprehensive breakdown of the calculated slippage and fees incurred throughout the strategy’s operations. It contains several key metrics that give traders a granular view of the costs associated with executing the system:
Selected Slippage - Displays the current slippage rate, as defined in the input menu.
Removal Slippage - This accounts for any slippage or fees incurred when removing an allocation from a token.
Reallocation Slippage - Tracks the slippage or fees when reallocating capital to existing positions.
Addition Slippage - Measures the slippage or fees incurred when allocating capital to new tokens.
Final Slippage - Is the sum of all the individual slippage points and provides a quick view of the total slippage accounted for by the system.
The table is also divided into two columns:
Last Transaction Slippage + Fees - Displays any slippage or fees incurred based on position changes within the current bar.
Total Slippage + Fees - Shows the cumulative slippage and fees incurred since the portfolio’s selected start date.
Visual Customization:
Several customizable features are included within the input menu to enhance user experience. These include custom color palettes, both preloaded and user-selectable. This allows traders to personalize the visual appearance of the tables, ensuring clarity and consistency with their preferred interface themes and background coloring.
Additionally, users can adjust both the position and sizes of all the tables - enabling complete tailoring to the trader’s layout and specific viewing preferences and screen configurations. This level of customization ensures a more intuitive and flexible interaction with the system’s data.
Core Features and Methodologies
Advanced Risk Management - A Unique Filtering Approach:
The Equity Curve Activation Filter introduces an innovative way to dynamically manage capital allocation, aligning with periods of market trend strength. This filter is rooted in the understanding that markets move cyclically - altering between periods trending and mean-reverting periods. This cycle is especially pronounced in the crypto markets, where strong uptrends are often followed by prolonged periods of sideways movements or corrections as participants take profits and momentum fades.
The Cyclical Nature of Markets and Trend Following:
Financial markets do not trend indefinitely. Each uptrend or downtrend, whether over high and low timeframes, tends to culminate in a phase where momentum exhausts - leading to the sideways or corrective phases. This cycle results from the natural dynamics of market participants: during extended trends, more participants jump in, riding the momentum until profit taking causes the trend to slow down or reverse. This cyclical behavior occurs across all timeframes and in all markets - making it essential to adapt trading strategies in attempt to minimize losses during less favorable conditions.
In a trend following system, profitability often mirrors this cyclical pattern. Trend following strategies thrive when markets are moving directionally, capturing gains as price moves with strength in a single direction. However in phases where the market chops sideways, trend following strategies will usually experience drawdowns and reduced returns due to the impersistent nature of any trends. This fluctuation in trend following profitability can actually serve as one of the best coincident indicators of broader market regime change - when profitability begins to fade, it often signals a transition to drawn out unfavorable trend trading conditions.
The Equity Curve as a Market Signal
Within the Impulse Tracker, a continuous equity curve is calculated based upon the system's allocation to the strongest tokens. This equity curve effectively tracks the system’s performance under all market conditions. However, instead of solely relying on the direct performance of the selected tokens, the system applies additional filters to analyze the trend strength of this equity curve itself.
In the same way you only want to purchase an asset that is moving up in price, you only want to allocate capital to a strategy whose equity curve is trending upwards!
The Equity Curve Activation Filter consistently monitors the trend of this equity curve through various filter indicators, such as the “Wave Pendulum Trend”, the “Quasar QSM” and the “MAQSM” (an aggregate of multiple types of averages). These filters help determine whether the equity curve is trending upwards, signaling a favorable period for trend following. When the equity curve is in a positive trend, capital is allocated to the system as normal - allowing it to capture gains during favorable market conditions, Conversely, when the trend weakens and the equity curves begins to stagnate or decline, the activation filter shifts the system into a “cash” positions - temporarily halting allocations in order to prevent market exposure during choppy or mean reverting phases.
Timing Allocation With Market Conditions
This unique filtering approach ensures that the system is primarily active during periods when market trends are most supportive. By aligning capital allocations with the uptrend in trend following profitability, the system is designed to enter during periods of strong momentum and move to cash when momentum with the equity curve wanes. This approach reduces the risk of overtrading in less favorable conditions and preserves capital for the next favorable trend.
In essence the Equity Curve Allocation Filter serves as a dynamic risk management layer that leverages the cyclicality of trend following profitability in order to navigate shifting market phases.
Sensitivity and Signal Responsiveness:
The Quasar Sensitivity Setting allows users to fine-tune the system’s responsiveness to asset signals. High sensitivity settings lead to quicker position changes, making the system highly reactive to short term strength impulses. This is especially useful in fast moving markets where token strength can shift rapidly. The Sensitive setting might be more applicable to higher volatility or lower market cap assets - as the increased volatility increases the necessity of faster position cutting in order to front run the crowd. Of course - a balanced approach is ideal, as if the signals are too fast there will be too many whips and false signals. (And extra fees + slippage!)
The benefit of this script is because of the advanced slippage calculations, false signals are sufficiently punished (unlike systems without fees or slippage) - so it will become immediately apparent if the false signals have a significantly detrimental impact on the system’s equity curve.
Asset specific signals within each category are re-evaluated after the close of each bar to ensure that capital is always allocated to the highest performing asset. If a token’s momentum begins to fade the system swiftly reallocates to the next strongest asset within that category.
Category Filter - Allocates only to the Strongest Asset per group
One of the core innovations of the AI x Meme Impulse Tracker is the customizable Category Filter, which ensures that only the strongest-performing asset within each predefined group receives capital allocation. This approach not only increases the precision of asset selection but also allows traders to tailor the system to specific token narratives or categories. Sectors can include trending themes such as high-attention meme tokens, AI-driven tokens, or even categorize assets by blockchain ecosystems like Ethereum, Solana, or Base chain. This flexibility enables users to align their strategies with the latest market narratives or to optimize for specific groups, focusing on high-beta tokens within well defined sectors for a more targeted exposure. By keeping the focus on category leaders, the system avoids diluting its impact across underperforming assets, thereby maximizing capital efficiency and reducing unnecessary trading costs.
Dynamic Asset Reallocation:
Dynamic reallocation ensures that the system remains nimble and adapts to changing market conditions. Unlike slower systems, the Quasar method continually monitors for changes in asset strength and reallocates capital accordingly - ensuring that the system is always positioned in the highest performing assets within each category.
Position Changes and Slippage:
The Impulse Tracker places a strong emphasis on realistic simulation, prioritizing accuracy over inflated backtest results. This approach ensures that slippage is accounted for in a more aggressive manner than what may be experienced in real-world execution.
Each position change within the system - whether it’s buying, selling, reallocating, or rebalancing between assets - incurs slippage. Slippage is applied to both ends of every transaction: when a position is entered and exited, and when reallocating capital from one token to another. This dynamic behavior is further enhanced by a customizable slippage/fees input, allowing users to simulate realistic transaction costs based on their own market conditions and execution behaviors.
The slippage model works by applying a weighted slippage to the equity curve, taking into account the actual amount of capital being moved. Slippage is not applied in a blanket manner but rather in proportion to the allocation changes. For example, if the system reallocates from a single 100% position to two 50% allocations, slippage will be applied to the 50% removed from the first asset and the 50% added to the new asset, resulting in a 1x slippage multiplier.
This process becomes more granular when multiple assets are involved. For instance, if reallocating from two 50% positions to three 33% positions, slippage will be incurred on each of the changes, but at a reduced rate (⅔ x slippage), reflecting the smaller percentage of portfolio equity being moved. The slippage model accounts for all types of allocation shifts, whether increasing or decreasing the number of tokens held, providing a realistic assessment of system costs.
Here are some detailed examples to illustrate how slippage is calculated based on different scenarios:
100% → 50% / 50%: 1x slippage applied to both position changes (2 allocation changes).
50% / 50% → 33% / 33% / 33%: ⅔ x slippage multiplier applied across 3 allocation changes.
33% / 33% / 33% → 100%: 4/3 x slippage multiplier applied across 3 allocation changes.
In practice, not every position change will be rebalanced perfectly, leading to a lower number of transactions and lower costs in practice. Additionally, with the use of limit orders, a trader can easily reduce the costs of entering a position, as well as ensuring a competitive entry price.
By simulating slippage in this granular manner, the system captures the absolute maximum level of fees and slippage, in order to ensure that backtest results lean towards an underrepresentation - opposed to inflated results compared with practical execution.
A Special Note on Slippage
In the image above, the system has been applied to four different timeframes - 20h, 15h, 10h, and 5h - using identical settings and a selected slippage amount of 2%. By isolating a recent trend leg, we can illustrate an important concept: while the 15h timeframe is more profitable than the 20h timeframe, this difference stems from a core trading principle. Lower timeframes typically provide more data points and allow for quicker entries and exits in a robust system. This often results in reduced downside and compounding of gains.
However, slippage, fees, and execution constraints are limiting factors, especially in volatile, low-cap cryptocurrencies. Although lower timeframes can improve performance by increasing trade frequency, each trade incurs heavy slippage costs that accumulate - impacting the portfolio’s capital at a compounding rate. In this example, the chosen slippage rate of 2% per trade is designed to reflect the realistic trading costs, emphasizing how lower timeframe trading comes at the cost of increased slippage and fees
Finding the optimal balance between timeframe and slippage impact requires careful consideration of factors such as portfolio size, liquidity of selected tokens, execution speed, and the fee rate of the exchange you execute trades on.
Equity Curve and Performance Calculations
To provide a benchmark, the script also generates a Buy-and-Hold (or "HODL") equity curve that represents a complete allocation to Bitcoin. This allows users to easily compare the performance of the dynamic rotation system with that more traditional benchmark strategy.
The script tracks key performance metrics for both the dynamic portfolio and the HODL strategy, including:
Sharpe Ratio
The Sharpe Ratio is a key metric that evaluates a portfolio’s risk-adjusted return by comparing its ‘excess’ return to its volatility. Traditionally, the Sharpe Ratio measures returns relative to a risk-free rate. However, in our system’s calculation, we omit the risk-free rate and instead measure returns above a benchmark of 0%. This adjustment provides a more universal comparison, especially in the context of highly volatile assets like cryptocurrencies, where a traditional risk-free benchmark, such as the usual 3-month T-bills, is often irrelevant or too distant from the realities of the crypto market.
By using 0% as the baseline, we focus purely on the strategy's ability to generate raw returns in the face of market risk, which makes it easier to compare performance across different strategies or asset classes. In an environment like cryptocurrency, where volatility can be extreme, the importance of relative return against a highly volatile backdrop outweighs comparisons to a risk-free rate that bears little resemblance to the risk profile of digital assets.
Sortino Ratio
The Sortino Ratio improves upon the Sharpe Ratio by specifically targeting downside risk and leaves the upside potential untouched. In contrast to the Sharpe Ratio (which penalizes both upside and downside volatility), the Sortino Ratio focuses only on negative return deviations. This makes it a more suitable metric for evaluating strategies like the AI x Meme Impulse Tracker - that aim to minimize drawdowns without restricting upside capture. By measuring returns relative to a 0% baseline, the Sortino ratio provides a clearer assessment of how well the system generates gains while avoiding substantial losses in highly volatile markets like crypto.
Omega Ratio
The Omega Ratio is calculated as the ratio of gains to losses across all return thresholds, providing a more complete view of how the system balances upside and downside risk even compared to the Sortino Ratio. While it achieves a similar outcome to the Sortino Ratio by emphasizing the system's ability to capture gains while limiting losses, it is technically a mathematically superior method. However, we include both the Omega and Sortino ratios in our metric table, as the Sortino Ratio remains more widely recognized and commonly understood by traders and investors of all levels.
Usage Summary:
While the backtests in this description are generated as if a trader held a portfolio of just the strongest tokens, this was mainly designed as a method of logical verification and not a recommended investment strategy. In practice, this system can be used in multiple ways.
It can be used as above, or as a factor in forming part of a broader asset selection system, or even a method of filtering tokens by strength in order to inform a day trader which tokens might be optimal to look for long-only trading setups on an intrabar timeframe.
Final Summary:
The AI x Meme Impulse Tracker is a powerful algorithm that leverages a unique strength and impulse based approach to asset allocation within high beta token categories. Built with a robust risk management framework, the system’s Equity Curve Activation Filter dynamically manages capital exposure based on the cyclical nature of market trends, minimizing exposure during weaker phases.
With highly customizable settings, the Impulse Tracker enables precise capital allocation to only the strongest assets, informed by real-time metrics and rigorous slippage modeling in order to provide the best view of historical profitability. This adaptable design, coupled with advanced performance analytics, makes it a versatile tool for traders seeking an edge in fast moving and volatile crypto markets.
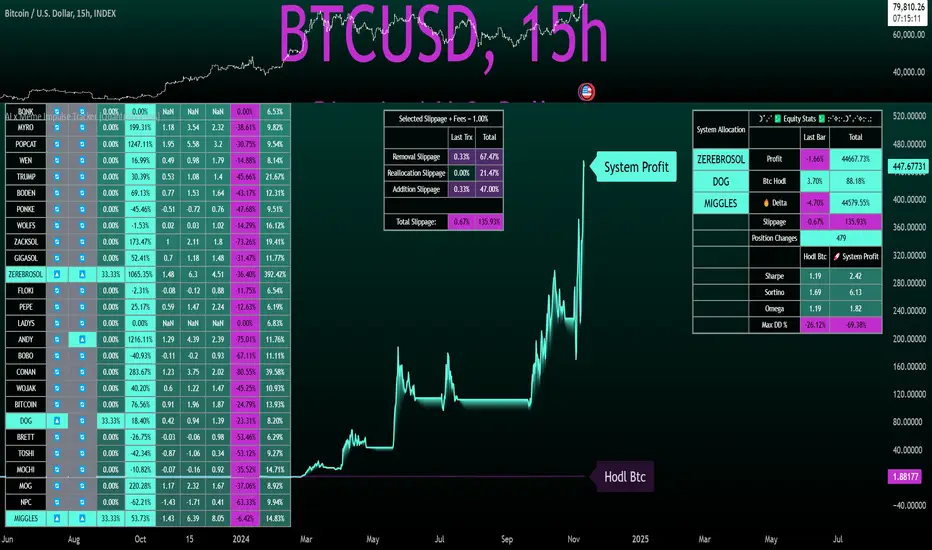
Cross-Asset Correlation Trend IndicatorCross-Asset Correlation Trend Indicator
This indicator uses correlations between the charted asset and ten others to calculate an overall trend prediction. Each ticker is configurable, and by analyzing the trend of each asset, the indicator predicts an average trend for the main asset on the chart. The strength of each asset's trend is weighted by its correlation to the charted asset, resulting in a single average trend signal. This can be a rather robust and effective signal, though it is often slow.
Functionality Overview :
The Cross-Asset Correlation Trend Indicator calculates the average trend of a charted asset based on the correlation and trend of up to ten other assets. Each asset is assigned a trend signal using a simple EMA crossover method (two customizable EMAs). If the shorter EMA crosses above the longer one, the asset trend is marked as positive; if it crosses below, the trend is negative. Each trend is then weighted by the correlation coefficient between that asset’s closing price and the charted asset’s closing price. The final output is an average weighted trend signal, which combines each trend with its respective correlation weight.
Input Parameters :
EMA 1 Length : Sets the period of the shorter EMA used to determine trends.
EMA 2 Length : Sets the period of the longer EMA used to determine trends.
Correlation Length : Defines the lookback period used for calculating the correlation between the charted asset and each of the other selected assets.
Asset Tickers : Each of the ten tickers is configurable, allowing you to set specific assets to analyze correlations with the charted asset.
Show Trend Table : Toggle to show or hide a table with each asset’s weighted trend. The table displays green, red, or white text for each weighted trend, indicating positive, negative, or neutral trends, respectively.
Table Position : Choose the position of the trend table on the chart.
Recommended Use :
As always, it’s essential to backtest the indicator thoroughly on your chosen asset and timeframe to ensure it aligns with your strategy. Feel free to modify the input parameters as needed—while the defaults work well for me, they may need adjustment to better suit your assets, timeframes, and trading style.
As always, I wish you the best of luck and immense fortune as you develop your systems. May this indicator help you make well-informed, profitable decisions!