MTF RSI + Average (Multi-Timeframe) [TH]Multi-Timeframe Relative Strength Index --- MTF RSI
Eliminates having to change time intervals to view a different Time Interval's RSI value (up to 5 time intervals possible through the settings).
The RSI values from Multiple Time Frames can be averaged together to show one single RSI.
A table overlay (info box) makes it easy to quickly identify RSI values on the multiple different time frames.
Timeframe

Multi-timeframe Stochastic RSIThe multi-timeframe stochastic RSI utilizes stochastic RSI signals from 11 different time-frames to indicate whether overbought/oversold signals are in agreement or not across time-frames. Ideally traders should enter and exit when conditions are in agreement as indicated by the intensity of the long (green) or short (red) bands at the top and bottom of the indicator. The intensity of the bands indicates how many of the time-frames are currently overbought/oversold.
EMA Levels, Multi-TimeframeThe exponential moving average (EMA) tracks price over time, giving more importance to recent price data than simple moving average (SMA). EMAs for larger timeframes are generally considered to be stronger supports/resistances for price to move through than smaller timeframes. This indicator allows you to specify two different EMA lengths that you want to track. Additionally, this indicator allows you to display not just the EMA levels of your currently viewed timeframe on the chart, but also shows the EMA levels of up to 4 different timeframes on the same chart. This allows you to quickly see if multiple EMA levels are aligning across different timeframes, which is an even stronger indication that price is going to meet support or resistance when it meets those levels on the chart. There are a lot of nice configuration options, like:
Ability to customize the EMA lengths you want to track
Style customization (color, thickness, size)
Hide any timeframes/levels you aren't interested in
Labels on the chart so you can tell which plots are the EMA levels
Optionally display the plot as a horizontal line if all you care about is the EMA level right now
RSI Levels, Multi-TimeframeThe relative strength index (RSI) is a momentum indicator that measures the magnitude of recent price changes to evaluate overbought or oversold conditions. RSI is normally displayed as an oscillator separately from price and can have a reading from 0 to 100. This indicator takes the RSI and plots the 30 & 70 levels onto the price chart so you can see when price is going to meet the 30 or 70 levels. The reason the 30 & 70 levels are important is because many traders (and bots) use those as signals to buy (at 30 RSI) or sell (at 70 RSI). Additionally, this indicator allows you to display not just the RSI levels of your currently viewed timeframe on the chart, but also shows the RSI levels of up to 6 different timeframes on the same chart. This allows you to quickly see if multiple RSI levels are aligning across different timelines, which is an even stronger indication that price is going to change direction when it meets those levels on the chart. There are a lot of nice configuration options, like:
Style customization (color, thickness, size)
Labels on the chart so you can tell which plots are the RSI levels
Optionally display the plot as a horizontal line if all you care about is the RSI level right now
Toggle overbought (RSI 70) or oversold (RSI 30) on/off completely

ConverterTFLibrary "ConverterTF"
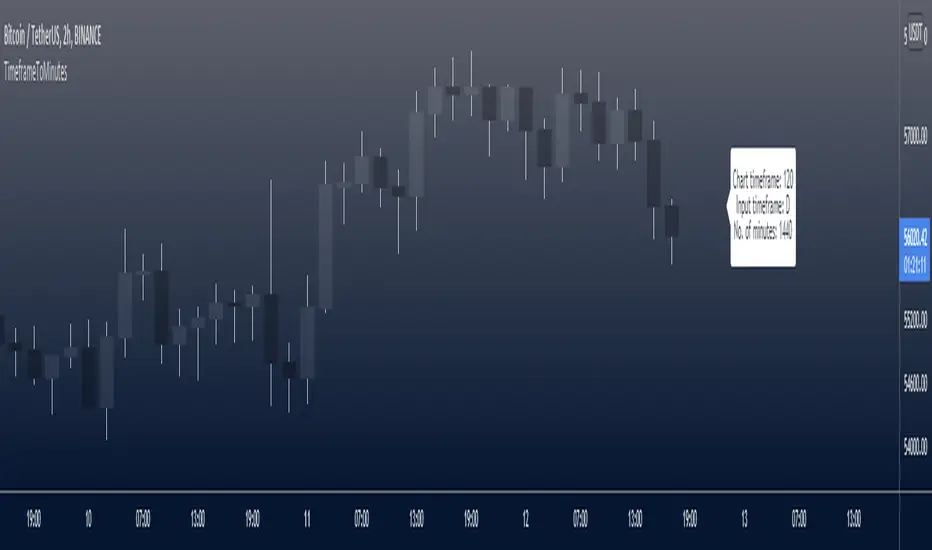
I have found a bug Regarding the timeframe display, on the chart I have found that the display is numeric, for example 4Hr timeframe instead of '4H', but it turns out to be '240', which I want it to be displayed in abbreviated form. And in all other timeframes it's the same. So this library was created to solve those problems. It converts a timeframe from a numeric string type to an integer type by selecting a timeframe manually and displaying it on the chart.
CTF()
str = "240"
X.GetTF( str )
Example
str = input.timeframe(title='Time frame', defval='240')
TimeF = CTF(str)
L=label.new(bar_index, high, 'Before>> Timeframe '+str+' After>> Timeframe '+TimeF,style=label.style_label_down,size=size.large)
label.delete(L )
Custom timeframes can handle this issue as well.
An example from the use. You will find it on the bottom right hand side.
Hopefully it will be helpful to the Tradingview community. :)

+ Donchian ChannelsThis version of Donchian Channels uses two source options so that one can create a channel using highs and lows rather than one or the other or closes. My thinking was that this would create a more accurate portrayal of price action (or at least contain the greatest scope of it) as seen through the lens of a Donchian Channel. This was actually part of the genesis of my idea around my Ultimate Moving Average.
Besides the single top and bottom plot for the DC's extremities, I've enabled the ability to create outer bands with a variable width that the user can adjust to their preference. I think it's quite nice. I use it in the DC in my other non-overlay indicators.
Besides this additional functionality, the indicator has options to plot lines between the basis and the upper and lower bands, so, basically, splitting the upper and lower channel in half.
There is no magic number to the lookback. I chose 233 as default because it's a fibonacci sequence number and I'm more interested in using the DC like a very long period bias indicator, and the longer lookback gives a much wider window (because highs and lows are so spread apart) with which other faster indicators (supertrend, shorter period moving averages, etc.) can work without making the screen a clutter.
The color of the basis may also be made relevant to higher timeframe information. What I mean by this is that you can set it so that the basis of the current timeframe is colored based on the candle close of the higher timeframe of your choosing. If you're looking at an hourly chart, and you set the color to Daily, the basis will be colored based on the candle close (above or below the basis) of the previous day. If the previous daily close was above the basis, that positive color will be reflected in the basis, even if the current hourly candle closes are below the hourly basis. This could potentially be useful for setting a higher timeframe directional bias and reacting off price crossing the lower timeframe basis (or whatever your trigger for entering a trade might be). This is also optional in my Ultimate Moving Average indicator.
You can also set the entire indicator to whatever time frame you want if you want to see where the actual basis, or other levels are on that higher timeframe.
Further additions include fibonacci retracement levels. These are calculated off the high and the low of the Donchian Channels themselves.
You will see that there are only three retracement levels (.786, .705, .382), one of which is not a fib level, but what some people call the 'OTE,' or optimal trade entry. If you want more info on the OTE just web search it. So, why no .618 or .236? Reason being that the .618 overlaps the .382, and the .236 is extremely close to the .786. This sounds confusing, but the retracement levels I'm using are derived from the high and low, so it was unnecessary to have all five levels from each. I could have just calculated from the high, or just from the low, and used all the levels, but I chose to just calculate three levels from the high and three from the low because that gives a sort of mirror image balance, and that appeals to me, and the utility of the indicator is the same.
The plot lines are all colored, and I've filled certain zones between them. There is a center zone filled between both .382 levels, and an upper and lower zone filled between the .786 and either the high or the low.
If you like the colored zones, but don't like the plots because they cause screen compression, turn off the plots under the "style" tab.
There are alerts for candle closes across every line.
I should state that, regarding the fibs, obviously the length of the Channels is going to affect to what levels price retraces to. A shorter lookback means you will see more changes in highs and lows, and therefore retraces are often going to be full retraces within the bands unless price is trending hard. A longer lookback means you will see smaller retraces. Using this in conjunction with key high timeframe levels and/or a moving average can give great confidence in a trade entry. Additionally, if you have a short bias it may help in finding levels or entering a trade on a pullback. It could also be good for trade targets. But again, the lookback you choose for this indicator is going to dictate its use in the system you're building or already have. A 9 EMA and a 200 EMA, while fundamentally the same, are going to be used somewhat differently while doing your chart analysis.
Additional images below.
Same image as main, but with supertrend and my +UMA to help with chart analysis.
Image with the fib stuff turned on.
Zoomed out image with the same.
Shorter lookback period.
Zoomed in image of shorter lookback.

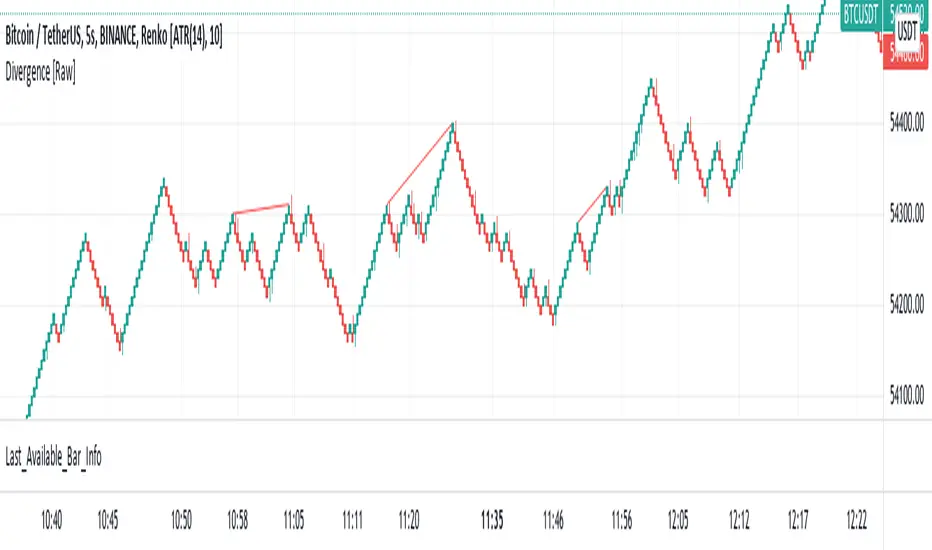
Last Available Bar InfoLibrary "Last_Available_Bar_Info"
getLastBarTimeStamp()
getAvailableBars()
This simple library is built with an aim of getting the last available bar information for the chart. This returns a constant value that doesn't change on bar change.
For backtesting with accurate results on non standard charts, it will be helpful. (Especially if you are using non standard charts like Renko Chart).
Methods
getLastBarTimeStamp()
: Returns Timestamp of the last available bar (Constant)
getAvailableBars()
:Returns Number of Available Bars on the chart (Constant)
Example
import paragjyoti2012/Last_Available_Bar_Info/v1 as LastBarInfo
last_bar_timestamp=LastBarInfo.getLastBarTimeStamp()
no_of_bars=LastBarInfo.getAvailableBars()
If you are using Renko Charts, for backtesting, it's necesary to filter out the historical bars that are not of this timeframe.
In Renko charts, once the available bars of the current timeframe (based on your Tradingview active plan) are exhausted,
previous bars are filled in with historical bars of higher timeframe. Which is detrimental for backtesting, and it leads to unrealistic results.
To get the actual number of bars available of that timeframe, you should use this security function to get the timestamp for the last (real) bar available.
tf=timeframe.period
real_available_bars = request.security(syminfo.ticker, tf , LastBarInfo.getAvailableBars() , lookahead = barmerge.lookahead_off)
last_available_bar_timestamp = request.security(syminfo.ticker, tf , LastBarInfo.getLastBarTimeStamp() , lookahead = barmerge.lookahead_off)
Shade a particular timeframe x3This is to help you shade 3 different time frames, its showing 3 different timeframes. This will help you determine if you are trading in the right time frame that you want to. It is set to default to Eastern time frame. the default setting are set for 1700-0100, 0100-0600 and 0600-1000. You can change the time frames to which ever you would like to trade. This helps the visual learners to recognize which time frame they are trading in.

RM Timeframe ContinuityThis indicator plots a table off to the right of the chart to help with determining timeframe continuity. Per the Strat, a great edge is only taking trades where full timeframe continuity is in place (i.e. if you are going long, make sure other timeframes are also green).
In this script:
Green candles have green colored boxes, red candles have red colored boxes.
Inside bars are represented by a circle - ⬤
Outside bars are represented by a tall rectangle - ▮
2-up bars are indicated by an up arrow - ▲
2-down bars are indicated by a down arrow - ▼
User defined options:
Pick any timeframe for the 4 boxes
Choose whether to plot the highs/lows of the larger timeframe candles as horizontal rays on your chart (along with the associated colors)

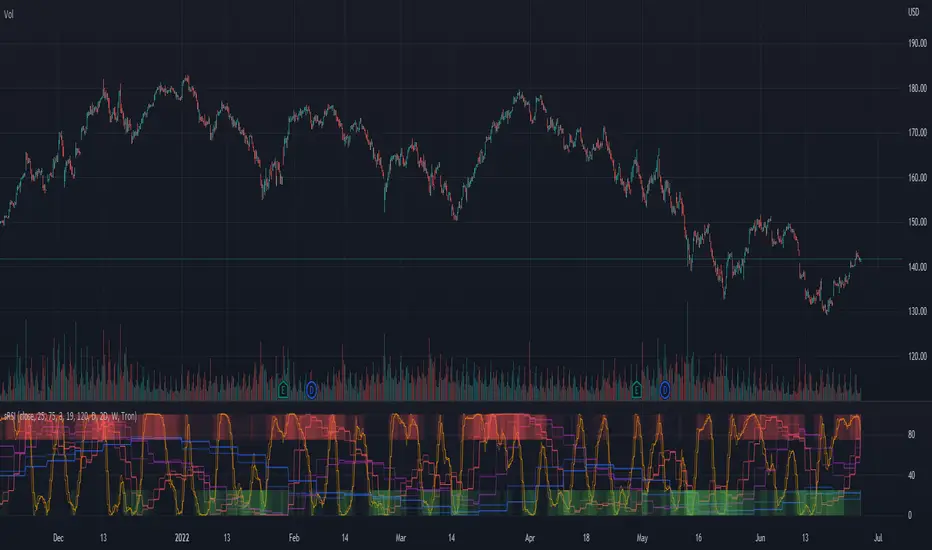
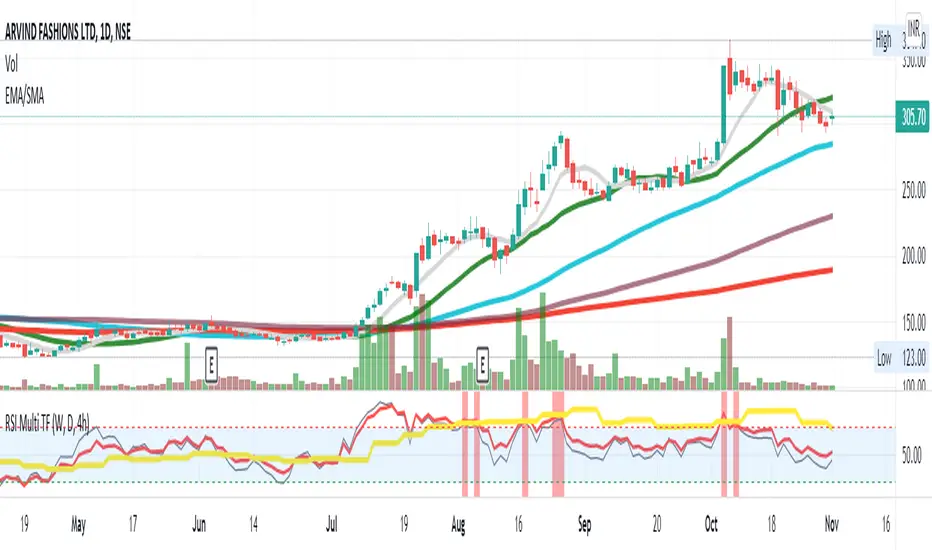
RSI Multi TF strategy
The RSI is a very popular indicator that follows price activity.
It calculates an average of the positive net changes, and an average
of the negative net changes in the most recent bars, and it determines
the ratio between these averages. The result is expressed as a number
between 0 and 100. Commonly it is said that if the RSI has a low value,
for example, 30 or under, the symbol is oversold. And if the RSI has a
high value, 70 for example, the symbol is overbought.
Plots 3 RSI (Weekly, Daily, 4h) at the same time, regardless of the Chart Timeframe.
Highlights in green (or red) if all RSI is oversold (or overbought).
Can trigger custom oversold and overbought alerts when all 3 lines grey(4h), yellow(weekly), and red(daily) go in the oversold or overbought zone. The strongest the curves break the barrier the strongest the alert (vertical red and green bars) shows.
watermarkA little indicator to show what pair your chart is presenting so people can easily see what they are dealing with
you can also put your signature beside it so you can be easily recognizable.
MTF DPO-RSI IndicatorThis indicator uses the principle of taking the RSI of DPO readings across multiple time frames in order to provide trade signals and an overarching view of market conditions to the trader. My hope with creating this indicator was to present more divergence based signals than your typical indicator, while still keeping those signals at a high quality.
In the settings menu, you may specify:
Indicator Timeframe - the chart resolution that is used to calculate values.
Source DPO Length - the number of bars used to calculate the Detrended Price Oscillator value. The DPO value is the source for the RSI calculations.
DPO Hull Smoothing - how much smoothing is applied to the DPO . Smoothing is accomplished by taking a Hull Moving Average of the closing price, and using this to calculate the DPO value.
RSI Length - the number of bars used to calculate the RSI of the DPO value.
Time Multipliers 1 through 6 - use this to define what resolution each plot will represent. A value of 1 will represent the current Indicator Timeframe. A value of 3 will represent 3 times the current Indicator Timeframe, etc.
Show Plot 1 through 6 - toggles the display of plots.
How I trade with this indicator:
A value of under 30 represents an over sold state for that particular plot. A value of over 70 represents an overbought state for that plot.
Identify divergences on a lower timeframe plot which are apparent in overbought or oversold conditions, and confirm the signal with an overbought or oversold condition, or a divergence on a higher timeframe plot. Divergences which begin in oversold or overbought territory and end inside the 30-70 range tend to be more reliable signals, in my experience. Like all indicators, this is best when used in conjunction with other indicators. Trend indicators, such as double EMA's and Supertrend are my favorite pairing, and a stochastic RSI is a good tool to have as well.
This is my first published indicator! If you find unique ways to use it, drop me a message. I'd love to know what you find. :)

Indicator: SMA/EMA (Multi timeframes)This moving average indicator will plot the SMA or EMA sourced from a different timeframe on the current chart.
Applications:
Say you are viewing an hourly chart but you also want to know the ema20 sourced from a higher timeframe (i.e daily) of the same security. The problem with using most built-in indicators is that the MA values are usually calculated from the current chart, so to do that, you will have to toggle between 1h/1D. This script will eliminate this hassle by plotting out the desired alternative timeframe on the same chart.
Dynamic settings
By default the alternative timeframe is 1D, but this can be customized further:
- 1 week chart -> plots out 1 month MA
- 1 day chart -> plots out 1 week MA
- 1 hour chart -> plots out 1 day MA

TimeframeToMinutesLibrary "TimeframeToMinutes"
The timeframeToMinutes() function returns the number of minutes in an arbitrary timeframe string.
timeframeToMinutes()
Returns the number of minutes in the supplied timeframe string, which is arbitrary, i.e. it doesn't have to be the timeframe of the current chart but can be taken from an input.
The sole advantage over the short and neat Pinecoders f_resInMinutes function from their excellent MTF Selection Framework (at ) is that this one doesn't use up a security() call.
To convert the other way, from minutes to timeframe.period format, I would use the f_resFromMinutes function from the Pinecoders' MTF Selection Framework, which does not use security().
ERROR-CHECKING: It has light error-checking to try to make sure the string is in the format timeframe.period, e.g. 15S, 1 (minute), 60 (1H), 1D, 1W, 1M.
It will throw an error for some non-standard timeframes such as 30 hours (1800 minutes). Above 1440 minutes, only whole numbers of days are allowed. This is to be consistent with the security() function.
But it will allow some non-standard timeframes such as 7 hours (420 minutes). Such timeframes must still be supplied in the standard timeframe.period format.
param _tf
The timeframe to convert to minutes. Must be in timeframe.period format.
returns
An integer representing the number of minutes that the timeframe period is equivalent to.
Volume Zones Multi-Timeframe OverlayAt its core, this indicator is a variation of my other indicator, Welkin Advanced Volume Overlay (for VSA )
This version is based on the power of multi-timeframe analysis. The basic functionality is simple: Plot lines from the high and low of candles formed during periods of high volume and fill the space between them. The volume levels for deciding what counts as "high volume" are based on standard deviations of the volume's SMA , and the higher the volume , the brighter the zone. i.e., a volume zone set by a volume level that is 4 standard deviations higher than average will be more "filled in" and less transparent than a volume zone from a 2 standard deviation candle.
These zones tend to act as areas of congestion, and the "ceilings" and "floors" of the zones as support and resistance . Overlapping zones tend to indicate strength and are likely to require more effort to get through. The more timeframes that agree with each other, the stronger the zone, ceiling, or floor.
By default, these zones are drawn based on the chart's timeframe and 1 timeframe higher, automatically set based on some "standard" values:
1m -> 5m
5m -> 15m
10m -> 30m
15m -> 60m
30m -> 60m
60m -> 1d
1d -> 1w
Finally, both the base timeframe and the higher timeframe are customizable; this is intended to make it easy to "double" up copies of the indicator to fit even more timeframes on the chart, creating a sort of heatmap for volume price analysis.
An example of three copies of the indicator, showing volume zones from 6 different timeframes.

Multi timeframe Stochastic RSI Screener by noop42Here is a custom x4 timeframes Stochastic RSI screener to add on your charts.
Options
Repaint mode : if enabled: values are updated in live, if disabled: values are updated once the concerned candle is closed
Default parameters
Timeframes: 1, 5, 15, 60
Repaint mode: enabled
Notes
Use the lowest timeframe configured on the screener to get real values
A classic x3 multi-timeframe Stochastic RSI indicator is also available

MTF StochRSI indicator by noop42Here is a custom x3 timeframes Stochastic RSI indicator.
Main Features (can be disabled)
Average mode : for each timeframe, a single line corresponding to the average value between K and D is printed
Repaint mode : if enabled: values are updated in live, if disabled: values are updated once the concerned candle is closed
Default parameters
Timeframes: 1, 5, 15
Mode : Average value
Repaint mode: enabled

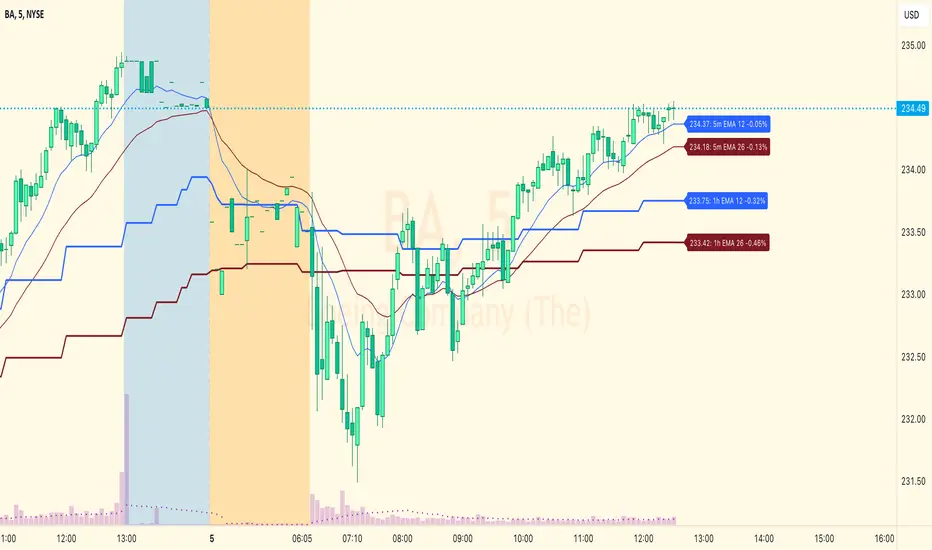
Macd Divergence + MTF EMA MACD Divergence + Multi Time Frame EMA
This Strategy uses 3 indicators: the Macd and two emas in different time frames
The configuration of the strategy is:
Macd standar configuration (12, 26, 9) in 1H resolution
10 periods ema, in 1H resolution
5 periods ema, in 15 minutes resolution
We use the two emas to filter for long and short positions.
If 15 minutes ema is above 1H ema, we look for long positions
If 15 minutes ema is below 1H ema, we look for short positions
We can use an aditional filter using a 100 days ema, so when the 15' and 1H emas are above the daily ema we take long positions
Using this filter improves the strategy
We wait for Macd indicator to form a divergence between histogram and price
If we have a bullish divergence, and 15 minutes ema is above 1H ema, we wait for macd line to cross above signal line and we open a long position
If we have a bearish divergence, and 15 minutes ema is below 1H ema, we wait for macd line to cross below signal line and we open a short position
We close both position after a cross in the oposite direction of macd line and signal line
Also we can configure a Take profit parameter and a trailing stop loss

Hx MTF Sorted MAs Panel with Freeze WarningThis script displays the close price and 4 sorted moving averages of your choice in a small repositionable panel and, when used on a higher timeframe, warns you when values may be different from actual values in the higher timeframe, inciting you to double check the actual values of the moving averages in the higher timeframe the panel is supposed to reflect.
The 4 moving averages and close are sorted together, providing you with a bird’s-eye view of their relative positions, the same way moving averages and last price values are displayed on the right scale.
The black header reminds of:
(1) the timeframe (resolution) used in the panel
(2) the remaining time before a new bar is created in the panel timeframe. Note that this remaining time is different from the one on the right scale, since it is only updated when a new transaction occurs.
Below, price and moving averages are sorted, color coded and followed by:
(1) a trend indicator ↗ or ↘ meaning that last change is up or down
(2) the number of bars since the moving average is above or below close (0 means current bar). This is obviously not displayed after the close price line (white background color).
Use
This panel was basically developed to display higher timeframe data but it can also be used with the same timeframe as chart for example if you do not want to plot moving averages on your chart but are still interested in their trends and relative positions vs price.
If you see something strange (like header is not black and displays NaN), it just means you requested moving averages that are not available in the panel timeframe. This may happen with newly introduced cryptos and “long” MA timeframes.
Different Timeframe
If you choose to use the panel on a different timeframe than the current one, be aware that you should only use timeframes higher than the current one, as per Tradingview recommendations.
If you select a lower timeframe than the current one, the panel timeframe header cell will turn to the alert color you set (fuchsia by default).
After tinkering for a while with the security function, I noticed that sometimes indicator values “freeze” (i.e. stop udating) and I have found no workaround.
What I mean is that when you look at a sma on a 5 minutes timeframe (the reference) and look at this same sma on a 5 minutes timeframe but from a lower timeframe through the security function set with a timeframe of 5 minutes, values returned by the security function are not always up to date and “freeze”. That’s the bad news.
Freeze warning
The better news is that this unexpected behaviour seems to be predictable, at least on minutes timeframes and I implemented an indicator that endeavors to detecting such situations. When the panel believes data may be frozen, the ‘Remaining Time’ header cell will turn to the alert color.
This feature is only implemented on minutes timeframes and can be switched on or off.
Other points of interest in this script
If you code, this function may also interest you:
sortWithIndexes (arrayToSort) returns a tuple (sortedArray, sortedIndexes) and therefore allows multi-dimensional arrays sorting without actually implementing a sorting algorithm 😉.
Default Settings
The default settings provide an example of commonly used moving averages with associated colors ranked from Hot (more nervous) to Cold (less nervous).
These settings are just an example and are NOT meant to be used as a trading system! DYOR!
Hope it will be useful.
Does the Freeze warning work for you? What do you think of my pseudo sorting algorithm?
Enjoy and please let me know what you think in the comments.

MTF Candlestick Patterns Screening [tanayroy]This script displays all candle patterns found in multi-time frames for a given lookback period. Candle pattern screening logic is taken from TradingView’s built-in script. The script works with 5m, 15m, 30m, 1HR, 2HR, 4HR, D, W, M timeframe. Works best with 5m chart.
Options available for trend detection, lookback period, and selecting candle pattern.
Please like, comment, and follow.

OGT RSI MTF IndicatorThe OGT RSI MTF Indicator allows you to see when the RSI is overbought/oversold on multiple timeframes simultaneously.
Indicator settings
You have the ability to customise the RSI period as well as the OB/OS levels. What sets this indicator apart is that it you can select the timeframes which the RSI is OB/OS.
How is this displayed on the chart, and how can I make money with this indicator?
One of the most popular applications of the RSI indicator is that it can be used as a reversal signal when an instrument comes out of OB/OS. You can stack the odds in your favour when multiple timeframes are OB/OS at the same time which can have a higher probability of a pullback.
When the selected timeframes are OB, shaded red lines will appear. This indicates that a possible reversal to the downside is coming and you may want to look for a short position or closing an open position.
When the selected timeframes are OS, shaded green lines will appear. This indicates that a possible reversal to the upside is coming and you may want to look for a short position or closing an open position.
There is also a handy visible grid which shows the current RSI values for the selected timeframes.
The RSI MTF indicator combined with regular divergence and/or support & resistance can be a powerful trading strategy.

CRYPTO TRADING BOT - 1min SCALPING LONG/SHORTHOW IT WORKS
The core concept behind the script is the determination of the current market mood in sense of creating a trendline indicator using EMA / SMA .
By using this trend indication alongside RSI / MACD value range, we are able to enter/exit the market in both directions: LONG and SHORT .
In case of confirmed false signals, we try to catch up the next good opportunity to minimise loss and to close the current trade.
If the chance for a good countertrade is given at this point, the market is going to be entered reversely.
Should the market move incredibly fast against our trade direction, we use proven Stop-loss targets, to bring our children into safety.
As many others, we could tell you now, that we used state-of-the-art machine learning algorithms
as well as highly sophisticated methods to gain our results.
As a fact, we started with an idea, using simple and common trading tools/indicators,
as a solid ground. We did not want to reinvent the wheel and it paid off.
GET A WORKING SCRIPT
The algorithm we are using has initially been created with a self-developed backtesting software.
To be able to deliver gas to our engine, we have bought a huge amount of OHLCV data for the 1min chart.
After many exhausting and frustrating weeks of our workflow-rotation (develop, fail, fix, test, repeat)
we finally got confirmation for all of our conditions/expectations, so we translated our algorithm into pine-code.
THE RESULTS
Since we have been using our Pine-Strategy alongside our backtesting software , we checked all the results provided by TradingView
and our tool to be 100% sure every outcome, every entry and every exit is exactly the same.
We did this for several months and since 2021 June we have been using it with real Alerts, coped to our binance account.
Below, you will find how the performance for the previous months looked like (every trade was made with 100% of the capital, of course using proper stop loss and take profit):
September 2020: 15.18%
October 2020: 36.17%
November 2020: 15.12%
December 2020: 48.58%
January 2021: 150.10%
February 2021: 45.96%
March 2021: 46.48%
April 2021: 4.96%
May 2021: 43.48%
June 2021: -28.99%
Juli 2021: 15.63%
August 2021 (so far): 11.57%
Accumulated Profit: 1,979.01%
To prove our results, we will link an excel sheet for every trade that was made within this timerange.
Link: docs.google.com
ABOUT US
We are two good friends, both incredibly interested in mathematics, software engineering, AI and algorithmics. After getting introduced into the crypto space
by a common friend, we started figuring out that there is a pattern behind every big or small move which happens in an asset.
This is where the passion for creating a CRYPTO TRADING BOT began. It was our goal, to create this script for the 1min Timeframe, so the software can react quickly when a
big or small move is happening - this is why it is called a SCALPING SCRIPT .
We are incredibly proud of this script and would like to share it with this amazing community - just hit us up on TradingView!

Time of Day and Day of Week Buying and Selling StrategyThis strategy allows you to back test longing or shorting or do nothing during time increments of 30 minutes for various days of the week. For example if you want to see if every Saturday if Bitcoin dropped in value from 1600-7000 UTC, this script will allow you to test that.
Make sure you are in the 30 minute time frame while viewing the performance and trade history.
