Volume Profile PremiumHello, my friends, this is a new fine-grained volume profile indicator. As is known to all, the volume profile indicator is a charting tool that shows how much volume has occurred at each price throughout the trading session. The volume profile indicates the prices favored by the market or those ignored by the market, which can give traders clues as to where prices are likely to go shortly.
(1) Indicator description
This indicator is based on the function "request.security_lower_tf". See the related usage note for details if you need it.
Support for obtaining volume from a lower timeframe than the current chart and calculating a more fine-grained volume distribution
Due to the increased complexity of the calculation, you need to set a reasonable timeframe to avoid calculation timeout.
(2) Key parameters
- Support/Resistance Clustering
Max of Lookback Forward: The maximum number of historical K-lines
Min Resolution (Minute): lower timeframe, unit: minute
Display Volume Profile: ways to display volume profile
Rows of Volume Profile: rows of volume profile
Placement of Volume Profile: location of volume profile
Width of Volume Profile: width of volume profile
Horizontal Offset: horizontal offset of volume profile
Happy trading, and enjoy your life!
————————————————————————————————————————
各位朋友大家好,这是一个具有更高细粒度的成交量分布指标。众所周知,成交量分布是一种图表分析工具(或指标),它显示了在整个交易时段内每个价格上发生了多少成交量。 成交量分布指出了受到市场青睐的价格以及被市场忽略的价格,这可以为交易者提供有关近期价格可能走向何方的线索。
(1) 指标说明
该指标基于 request.security_lower_tf 函数,详情可以查看相关使用说明
支持从比当前图表分辨率更低的时间周期获取成交量,并计算更加细粒度的成交量分布
由于增加了计算复杂度,您需要设置合理的时间周期以避免计算超时
(2) 关键参数
- Volume Profile Parameters
Max of Lookback Forward: 用于统计成交量分布的最大回顾的K线数量
Min Resolution (Minute): 细粒度的时间周期
Display Volume Profile: 展示成交量分布的方式
Rows of Volume Profile: 成交量分布的行数
Placement of Volume Profile: 成交量分布的位置
Width of Volume Profile: 成交量分布的宽度
Horizontal Offset: 成交量分布的水平偏移
祝大家交易愉快
Timeframe

Everything Bitcoin [Kioseff Trading]Hello!
This script retrieves most of the available Bitcoin data published by Quandl; the script utilizes the new request.security_lower_tf() function.
Included statistics,
True price
Volume
Difficulty
My Wallet # Of Users
Average Block Size
api.blockchain size
Median Transaction Confirmation Time
Miners' Revenue
Hash Rate
Cost Per Transaction
Cost % of Transaction Volume
Estimated Transaction Volume USD
Total Output Volume
Number Of Transactions Per Block
# of Unique BTC Addresses
# of BTC Transactions Excluding Popular Addresses
Total Number of Transactions
Daily # of Transactions
Total Transaction Fees USD
Market Cap
Total BTC
Retrieved data can be plotted as line graphs; however, the data is initially split between two tables.
The image above shows how the requested Bitcoin data is displayed.
However, in the user inputs tab, you can modify how the data is displayed.
For instance, you can append the data displayed in the floating statistics box to the stagnant statistics box.
The image above exemplifies the instance.
You can hide any and all data via the user inputs tab.
In addition to data publishing, the script retrieves lower timeframe price/volume/indicator data, to which the values of the requested data are appended to center-right table.
The image above shows the script retrieving one-minute bar data.
Up arrows reflect an increase in the more recent value, relative to the immediately preceding value.
Down arrows reflect a decrease in the more recent value relative to the immediately preceding value.
The ascending minute column reflects the number of minutes/hours (ago) the displayed value occurred.
For instance, 15 minutes means the displayed value occurred 15 minutes prior to the current time (value).
Volume, price, and indicator data can be retrieved on lower timeframe charts ranging from 1 minute to 1440 minutes.
The image above shows retrieved 5-minute volume data.
Several built-in indicators are included, to which lower timeframe values can be retrieved.
The image above shows LTF VWAP data. Also distinguished are increases/decreases for sequential values.
The image above shows a dynamic regression channel. The channel terminates and resets each fiscal quarter. Previous channels remain on the chart.
Lastly, you can plot any of the requested data.
The new request.security_lower_tf() function is immensely advantageous - be sure to try it in your scripts!

EsIstTurnt's Relative Value Comparison Multi SymbolCompare the relative valuation of up to 8 tickers. By taking a shorter term moving average and dividing by a longer term moving average(optionally with an offset) we get a value that is either above or below 1. Easy to tell what is undervalued and overvalued with this setup. Useful for comparing different asset classes or sector specific securities looking for outperformers/underperformers. Overvalued and Undervalued levels marked by Red and Green background. Recommended in conjunction with other indicators of your choosing for confirmation of trend changes but this is good for getting a broader view of the market you're interested in. Multiple timeframes, sources available however you should tinker with it to find what gives you the best view for your preferred timeframe.

ALL Ticker ID informationAn example and overview of the syminfo and tickerid functions to be able to access different tools.
Here is an example of accessing the Bitfinex exchange (and requesting "instrument name") when another exchange is open (BINANCE:BTCUSDT)
There is a difference in name between BINANCE:BTCUSDT and BITFINEX:BTCUSD exchanges
Try swapping //
T = "BITFINEX:"+str.tostring(syminfo.basecurrency)+"USDT"
//T = "BITFINEX:"+str.tostring(syminfo.basecurrency)+"USD"
The script will show that this instrument does not exist "Error in the value of the instrument. There is no such currency!"
Implemented Resolve error handling with the ignore_invalid_symbol=true parameter, this gives further processing of the script without errors.
----------------------------------------------------------
Пример и обзор функций syminfo и tickerid для возможности доступа к разным инструментам.
Здесь реализован пример доступа к бирже Bitfinex(и запрос "названия инструмента"), когда открыта другая биржа (BINANCE:BTCUSDT)
Существует разница в названии между биржами BINANCE:BTCUSDT и BITFINEX:BTCUSD
Попробуйте поменять // местами
T = "BITFINEX:"+str.tostring(syminfo.basecurrency)+"USDT"
//T = "BITFINEX:"+str.tostring(syminfo.basecurrency)+"USD"
Скрипт выдаст, что данного инструмента нет "Ошибка в значении инструмента. Такой валюты нет!"
Реализована Обработка ошибки Resolve error с помощью параметра ignore_invalid_symbol=true это дает дальнейшую обработку скрипта без ошибок.

[CP]Pivot Boss Multi Timeframe CPR Inception with MACD and EMAINTRODUCTION:
This indicator combines multi-timeframe CPR bands with MACD Momentum and EMA trend, all projected on the candlestick chart through a novel visualization.
If you have seen my other indicators on TradingView, you would know that I use floor pivots a lot and “Secrets of a Pivot Boss” is my favorite book. While using floor pivots, time and again I have noticed an interesting price behavior,
Trending moves in price typically start from around the Central Pivot Range (CPR). The CPR could be from ANY timeframe. These moves can easily be caught using simple momentum and trend indicators like MACD and EMA crossovers.
Yes, it is that simple. Follow along to understand how to use this indicator.
INDICATOR SETTINGS:
RANGEBOUND MACD AND EMA MARKINGS:
TradingView limits the max number of labels that can be shown on a chart to 500. Therefore, if you go far back enough, you won't see any markings for the MACD or EMA setups. If you are looking to test the efficacy of this indicator in the past, change the start and end dates to your desired timeframe and then select the ‘Mark MACD and EMA Setups in Range?’ option.
MULTI TIMEFRAME CENTRAL PIVOT RANGE:
Here you can select CPRs and their bands from which timeframes are shown on the chart. I will share my favorite settings later in this description.
CPR CONFIGURATION:
Show CPR Labels: CPRs markings can carry labels, so that you don’t confuse between which line is what. Use this setting to toggle them On/Off.
Show Next Time Period Pivots: Check this option if you want to see the CPR of the next time period. This is typically done to figure out the ’Two Day CPR Relationship’ . Read the book, “Secrets of a Pivot Boss”, to understand more.
EMA TREND:
Show EMA on the Chart: EMAs will be plotted on the chart. Standard stuff.
Mark EMA Crossovers on Chart: EMA crossovers will be marked on the chart in diamond shapes. If you are using EMA crossovers, I recommend setting this option to True.
Rest of the EMA settings are fairly obvious.
MACD MOMENTUM:
Projecting MACD parameters directly on the candlesticks is surely going to give you a new perspective about price action and MACD.
Also, in order to better understand the MACD projections on the chart, you can add a standard MACD indicator on the chart with default settings to figure out what my indicator is actually showing you.
Marking MACD Crossovers on Chart: Marks the MACD signal crossovers on the chart. This visualization was a game changer for me.
Show MACD Histogram on Chart: Projects the complete MACD Histogram in a novel fashion (Try it!). You will be able to visually see the ebbs and flow of momentum in the charts.
Mark MACD Histogram Peaks on Chart: Marks only the MACD peaks instead of the complete histogram. Peaks are a great way to enter an ongoing trend and to play an intraday rangebound market.
Rest of the settings are just the standard settings that you will find in a typical MACD indicator.
ALERTS:
Not shown in the settings panel, but I have added alerts for EMA and MACD Crossovers so that you don’t have to sit in front of the charts or constantly check the price all day long.
If you don’t know how to set alerts in TradingView, then please Google it.
INDICATOR USAGE EXAMPLES:
This indicator can be used in intraday as well as in higher timeframes.
There are quite a few variations possible, I personally prefer to use the EMA crossovers in intraday (5m) and MACD on Daily timeframes.
This is just a matter of personal preference, some people might prefer using EMAs only or MACD only in all timeframes.
Here are my personal settings for the intraday 5-minute timeframe:
Turn on all the CPR pivots starting from Yearly all the way to Daily. You can turn on 6 hourly and 4 hourly as well if you want.
Hourly CPR is mostly used when the price is in a strong trend and you missed the entry and don’t know when to enter. Price will typically experience pullbacks towards the Hourly CPR, before resuming in the direction of the trend. That is your chance to hop onto the bandwagon.
For Intraday, I keep the Bands off. Just a personal preference here.
You can turn ON the Show CPR Labels , if you want.
Turn ON both the options in the EMA TREND section. You would want to see the EMA crossovers marked on the chart as well as the EMAs themselves, as the distance between the two EMAs will give you an idea about the strength of the trend.
Keep rest of the settings in the EMA section as default (you can change the colors if you wish). I keep the same EMAs as the ones kept in the MACD indicator. I like to keep things simple.
In the MACD MOMENTUM section, turn ON Mark MACD Histogram Peaks on Chart and all the other options turned OFF. Leave the other settings as default. By the way, these are the default settings of the standard MACD Indicator.
You can set up EMA Bullcross and Bearcross alarms if you like.
Before checking out the examples, remember one super simple rule:
SOME OF THE BEST TRENDING MOVES IN THE MARKET, BE IT INTRADAY OR OTHERWISE, ORIGINATE IN THE VICINITY OF A LARGER TIMEFRAME PIVOT/CPR.
Look for price settling above/below a pivot, and then a move away from the pivot in any direction is typically a trending move.
You can use hourly pivots or MACD Histogram peaks marked on the chart to enter an existing trend, or add to your positions.
Let’s have a look at a few recent intraday examples from the Crypto, Indian, and US equity markets.
I have added my comments in the charts to make you easily understand what is going on.
Understand that both, moving average crossover and MACD, will give out a lot of signals (chop) every day. But almost 70% of them are going to be fake signals. It is the signals that you get when the price is near a Pivot, that tend to convert into gorgeous trending moves that last.
BTC 5m Charts
NIFTY Futures 5m Charts (good intraday trends are hard to find here, as the market is very efficient)
TSLA 5m Charts
Some important points for using this indicator in higher timeframes:
For higher timeframes, my personal preference is to go with the MACD indicator. I personally find MACD to be lethal on daily and weekly timeframes, if you know how to use it well.
The default settings of the indicator are the settings I use for both, Daily and Weekly, timeframes. Additionally, I turn off the CPR labels.
In theory large trending moves still have a big probability to start near an important pivot level, however, in larger timeframes, trending moves can start from anywhere. They need not start in the vicinity of any important pivot (but they often do!).
Weekly pivots can act as great pullback levels when the price is in strong momentum, when trading on the daily timeframe.
Quarterly Pivots act as great pullback levels when the price is in strong momentum, when trading on the weekly timeframe.
BTC Weekly Chart
BTC Daily Chart
Nifty Weekly Chart
Nifty Daily Chart
NASDAQ Weekly Chart
NASDAQ Daily Chart
FINAL WORDS:
Please understand that I have Cherry Picked the examples to showcase the capability of the indicator and its usage.
DO NOT conflate the accuracy of examples with the accuracy of this indicator.
Biggest catch is the fact that this indicator, like every other indicator out there, will have whipsaws. Some I have also marked in the example charts.
You need to come up with your own technique to avoid whipsaws, one technique I have shared here…… big moves typically start near pivots.
Work on avoiding whipsaws and finding you own edge in the markets.
If you really want to learn how to use Pivots, read the book ’Secrets of a Pivot Boss’ . This book can change your life.

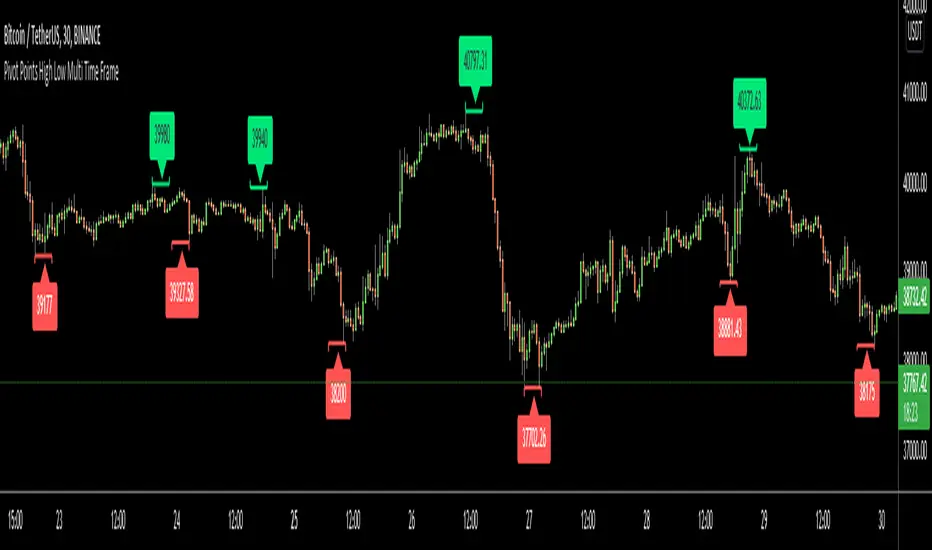
Pivot Points High Low Multi Time FrameHello All,
There are built-in and published Pivot Point High Low indicators in Public Library but as far as I see none of them is for Higher Time frames. so I decided to write & publish this script. I hope it would be useful while trading or developing your own scripts. I also did this to use in one of my future projects (we will see it in a few weeks/months ;) ).
I tried to make all settings optional, so you can play with them as you wish.
P.S. There is no control mechanism if the chart time frame is lower than the time frame in the options. So you better set higher time frame in the options than the chart time frame.
Enjoy!
super SSL [ALZ]This script is designed and optimized for MULTI TIME
by Ali Zebardast (ALZ)
1.in part of ssl
Original Version credits to Mihkel00
Actual Version i just set alerts and change the parameters for BTCUSDT 1min Chart.
He designed for daily time. I tried to optimize 1 min time-frame .
And fix the errors with OTT
"This script has a SSL / Baseline (you can choose between the SSL or MA), a secondary SSL for continiuation trades and a third SSL for exit trades.
Alerts added for Baseline entries, SSL2 continuations, Exits.
Baseline has a Keltner Channel setting for "in zone" Gray Candles
Added "Candle Size > 1 ATR" Diamonds from my old script with the criteria of being within Baseline ATR range."
2.in part of Range
two Filter Buy and Sell for 3min
Wait For Bar close
ssl2 :Be under the candle for buy
and The bar color must confirm the order of purchase (Blue)
3.in part of OTT
when candles close over HOTT, means an UPTREND SIGNAL
and to Fuchia when candles begin closing under LOTT line to indicate a DOWNTREND SIGNAL.
FLAT ZONE is highlighted also to have the maximum concentration on sideways market conditions.
There are three quantitative parameters in this indicator:
The first parameter in the OTT indicator set by the two parameters is the period/length.
OTT lines will be much sensitive to trend movements if it is smaller.
And vice versa, will be less sensitive when it is longer.
As the period increases it will become less sensitive to little trends and price actions.
In this way, your choice of period, will be closely related to which of the sort of trends you are interested in.
The OTT percent parameter in OTT is an optimization coefficient. Just like in the period
small values are better at capturing short term fluctuations, while large values
will be more suitable for long-term trends.
The final adjustable quantitative parameter is HIGHEST and LOWEST length which is the source of calculations.
Credits go to:
SSL Hybrid www.tradingview.com
HIGH and LOW OTT : www.tradingview.com
Range Filter www.tradingview.com

MTF Ichimoku Analysis[tanayroy]Ichimoku can state market conditions better than any indicator or group of indicators(My own perspective). Ichimoku works seamlessly in different timeframes. Analysis of Ichimoku in different timeframes can give you the bigger picture of the market.
This indicator analyzes six different timeframes with Ichimoku in depth. Default timeframes are 5M, 30M, 60M, D, W, and M. You can change the default timeframes from the setting.
As we are dealing with many relations, we can define the relationship with a simple score to get the trend strength.
Ichimoku Analysis:
Relationship of Price(P) with Ichimoku indicators: Here we are analyzing the current price and Ichimoku indicators. The position of price with respect to Ichimoku indicators states the market condition clearly.
Price(P) and Kumo(C): P > C = Bullish (↑). P < C = Bearish (↓). P <> C = consolidation or no trend(↔). Score: ±2
Price(P) and Tenkan Sen(T): P >= T = Bullish (↑). P < T = Bearish (↓). Score: ±0.5
Price(P) and Kijun Sen(K): P >= K = Bullish (↑). P < T = Bearish (↓). Score: ±0.5
Price(26 bars ago) and Chiku(L): L >= P(26) = Bullish (↑). L < P(26) = Bearish (↓). Score: ±0.5
Tenkan Sen and Kijun Sen Relation. Tenkan Sen depicts short-term trends and Kijun depicts mid-term trends. So this relationship is important for analyzing the current trend of the market.
Tenkan Sen(T) and Kijun Sen(K): T >= K = Bullish (↑). T < K = Bearish (↓). Score: ±2
Direction of Ichimoku indicators.
The direction of Ichimoku indicators helps us to understand the trend strength.
Tenkan Sen's(T) direction: Upward slope = Bullish (↑). Downward slope = Bearish (↓). Flat=consolidation or no trend(↔). Score: ±0.5
Kijun Sen's(K) direction: Upward slope = Bullish (↑). Downward slope = Bearish (↓). Flat=consolidation or no trend(↔). Score: ±0.5
Senkou A(A) direction: Upward slope = Bullish (↑). Downward slope = Bearish (↓). Flat=consolidation or no trend(↔). Score: ±0.5
Senkou B(A) direction: Upward slope = Bullish (↑). Downward slope = Bearish (↓). Flat=consolidation or no trend(↔). Score: ±0.5
Cloud and other Ichimoku indicators:
Kumo or Cloud is very important in the Ichimoku system. Analyzing its relation with other indicators is important to detect the overall market condition.
Kumo(C) and Tenkan Sen(T): T >= C = Bullish (↑). T < C = Bearish (↓). T <> C = consolidation or no trend(↔). Score: ±0.5
Kumo(C) and Kijun Sen(K): K >= C = Bullish (↑). K < C = Bearish (↓). K <> C = consolidation or no trend(↔). Score: ±0.5
Kumo(C) and Chiku(L): L >= C = Bullish (↑). L < C = Bearish (↓). L <> C = consolidation or no trend(↔). Score: ±0.5
Kumo(C) Shadow: By analyzing the last 252 bars(you can change this option) we are analyzing the Kumo shadow behind the current price. If Kumo shadow is present behind the price, trend strength will be weakened. Score: ±0.5
Kumo(C) Future (Senkou A(A) and Senkou B(B)): A >= B = Bullish (↑). A < B = Bearish (↓). Score: ±0.5
Chiku(L) Analysis:
Vertical and Horizontal Chiku analysis will tell us about the possible consolidation of the price.
Chiku Vertical: if the price consolidates for the next 5 bars(You can change this option) will it run into the price. Please remember we are placing the current price 26 bars ago and we are interested to see the current price in open space for a clear trend. Score: ±0.5
Chikou Horizontal: If Chiku is in open space (Not running into the price), we want to review Chiku vertically i.e how much percentage of fall or rise of the current price can cause Chiku to run into the price.
So, the maximum trend score is ±10.5.
Ichimoku signals:
We know, that the crossover of Ichimoku indicators provides important signals. In this section, you can see all the crossover i.e when they happened (Bars ago)
Distance between price and Tenkan Sen and Kijun Sen: We know, the price come back to Tenkan/Kijun if it goes far away from Tenkan/Kijun. So it is important to note the distance between Tenkan and Price.
Please note that this indicator is not a strategy or buy/sell signal. It just shows you the picture of Ichimoku in multiple timeframes. I am working on some strategies of Ichimoku and will publish the same when my research is complete.
If you want to analyze Ichimoku in a single timeframe, please review the following indicator.
To maintain the table size you can use the shorthand notation from the setting.
Table with detailed analysis:
Table with shorthand notation:
Please comment if you want any clarification or found any bugs to report.

SuperJump QQE MOD MTFThis is a QQE MOD MTF version.
Mihkel00 modified Glaz's script, I modified Mihkel00 's script again.
This is a QQE Mod original version by Mihkel00 :
I simply changed the above script to update pine script 5.0 and extracted two functions.
Thank you to the two authors for sharing such a great script.

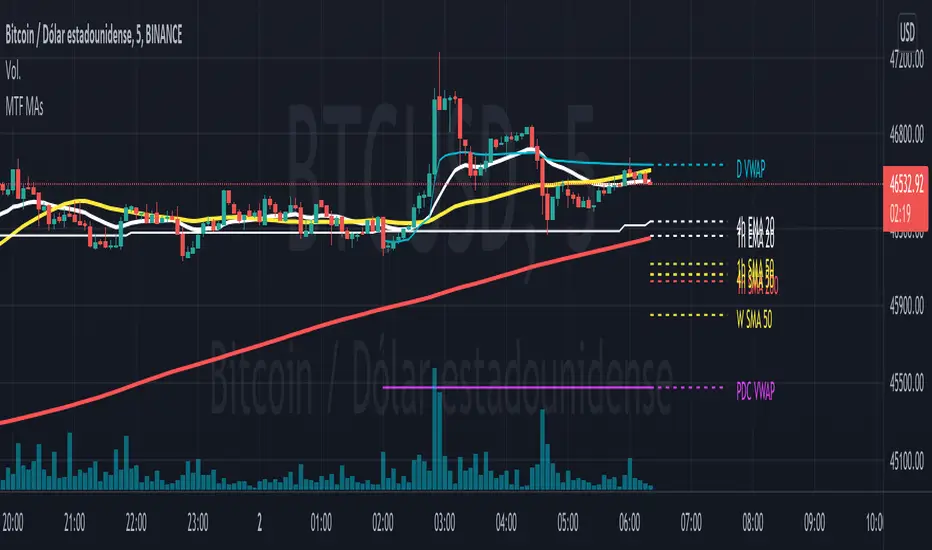
Multi Timeframe Moving AveragesI made this script to keep an eye on most important timeframes (1h, 4h, D, W, M)) moving averages while watching another timeframe. You can select what Ma's you want to be shown for each timeframe and some options to help your analysis (show history, show prices on mouse over label, etc...)
It includes 3 MA's:
- Fast (EMA)
- Middle (SMA)
- Slow (SMA)
You can configure length, source and color for each one.
Also includes a daily VWAP and an option to show the previous day close.
This script includes code from user Frien_dd-DisDev. I am very grateful to him
Thank you for interest.
Pablo.
Multi-Timeframe (MTF) Dashboard by RiTzMulti-Timeframe Dashboard
Shows values of different Indiactors on Multiple-Timeframes for the selected script/symbol
VWAP : if LTP is trading above VWAP then Bullish else if LTP is trading below VWAP then Bearish.
ST(21,1) : if LTP is trading above Supertrend (21,1) then Bullish , else if LTP is trading below Supertrend (21,1) then Bearish.
ST(14,2) : if LTP is trading above Supertrend (14,2) then Bullish , else if LTP is trading below Supertrend (14,2) then Bearish.
ST(10,3) : if LTP is trading above Supertrend (10,3) then Bullish , else if LTP is trading below Supertrend (10,3) then Bearish.
RSI(14) : Shows value of RSI (14) for the current timeframe.
ADX : if ADX is > 75 and DI+ > DI- then "Bullish ++".
if ADX is < 75 but >50 and DI+ > DI- then "Bullish +".
if ADX is < 50 but > 25 and DI+ > DI- then "Bullish".
if ADX is above 75 and DI- > DI+ then "Bearish ++".
if ADX is < 75 but > 50 and DI- > DI+ then "Bearish+".
if ADX is < 50 but > 25 and DI- > DI+ then "Bearish".
if ADX is < 25 then "Neutral".
MACD : if MACD line is above Signal Line then "Bullish", else if MACD line is below Signal Line then "Bearish".
PH-PL : "< PH > PL" means LTP is trading between Previous Timeframes High(PH) & Previous Timeframes Low(PL) which indicates Rangebound-ness.
"> PH" means LTP is trading above Previous Timeframes High(PH) which indicates Bullish-ness.
"< PL" means LTP is trading below Previous Timeframes Low(PL) which indicates Bearish-ness.
Alligator : If Lips > Teeth > Jaw then Bullish.
If Lips < Teeth < Jaw then Bearish.
If Lips > Teeth and Teeth < Jaw then Neutral/Sleeping.
If Lips < Teeth and Teeth > Jaw then Neutral/Sleeping.
Settings :
Style settings :-
Dashboard Location: Location of the dashboard on the chart
Dashboard Size: Size of the dashboard on the chart
Bullish Cell Color: Select the color of cell whose value is showing Bullish-ness.
Bearish Cell Color: Select the color of cell whose value is showing Bearish-ness.
Neutral Cell Color: Select the color of cell whose value is showing Rangebound-ness.
Cell Transparency: Select Transparency of cell.
Column Settings :-
You can select which Indicators values should be displayed/hidden.
Timeframe Settings :-
You can select which timeframes values should be displayed/hidden.
Note :- I'm not a pro Developer/Coder , so if there are any mistakes or any suggestions for improvements in the code then do let me know!
Note :- Use in Live market , might show wrong values for timeframes other than current timeframe in closed market!!

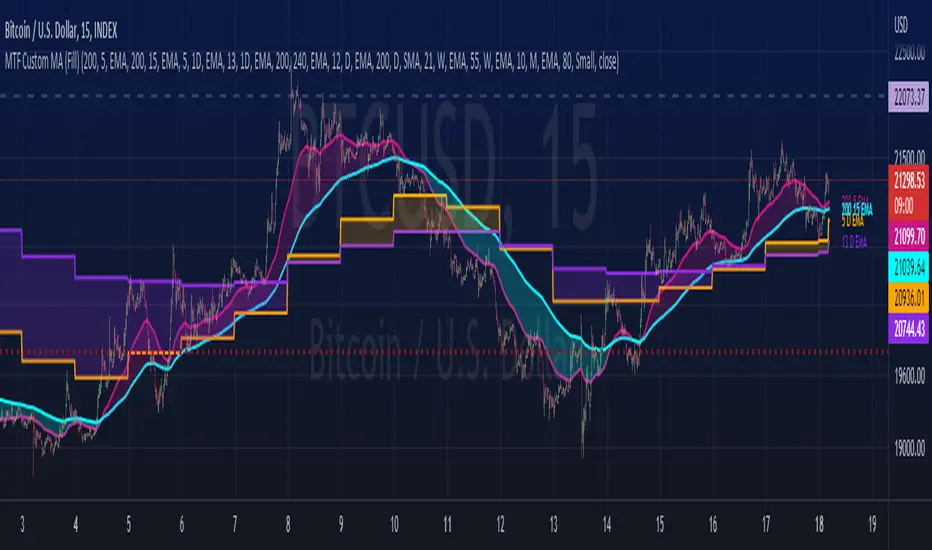
MTF Custom Moving AveragesThis user-friendly indicator allows up to 8 moving averages ( EMA or SMA ) from any timeframe, on any time frame. There are plenty of other MTF MA indicators, each with their own pros and cons. I wanted to make one without the cons:
- Independently set each MA to Exponential or Simple
- No preset lengths
- No preset timeframes
- Optional labels to help keep track of the period/length/type of each plot
- Clean, intuitive input layout
- More than enough MAs available to use one indicator for several use cases... just check/uncheck the ones that are relevant to each chart
Watch for death crosses on the 4hr while monitoring the "Bull Market Support band" (Weekly 21 EMA and 20 SMA ) and checking the Monthly 10 EMA for major support or resistance. Toggle between half of the available MAs for long term BTC trends and use the others for your alts. Use this one indicator to support multiple strategies.
Please leave a comment if you find it useful or have suggestions!
Inspired by the first MTF indicator I found: Weekly Moving Average by TommyTompsen.
Multi-Timeframe 10XIMPORTANT NOTE:
-> The timeframe for this indicator must be set at 1 minute;
-> If the chart timeframe is higher than 1 minute, the results shown in the table for timeframes lower than the chart will not be correct;
-> Tradingview's own documentation explains this as follows: " It is not recommended to request data of a timeframe lower that the current chart timeframe, for example 1 minute data from a 5 minutes chart. The main problem with such a case is that some part of a 1 minute data will be inevitably lost, as it’s impossible to display it on a 5 minutes chart and not to break the time axis. In such cases the behavior of security can be rather unexpected "; and
-> It is therefore recommended that this indicator is placed in a standalone 1min chart window, and the window resized to only show the table to avoid any issues.
Credits:
-> J. Welles Wilder creating the Directional Movement System (DMS) (1978); and
-> John Carter applying the DMS to create the popular Simpler Trading 10X Bars indicator.
Introduction:
Quickly see the quality and strength of a trend based on Directional Movement Index (DMI).
The Average Directional Index (ADX), Minus Directional Indicator (-DI) and Plus Directional Indicator (+DI) represent a group of directional movement indicators that form a trading system developed by Welles Wilder. Although Wilder designed his Directional Movement System with commodities and daily prices in mind, these indicators can also be applied to stocks. Wilder determined directional movement by comparing the difference between two consecutive lows with the difference between their respective highs.
+DI and -DI are derived from smoothed averages of these differences and measure trend direction over time. These two indicators are often collectively referred to as the DMI. ADX is in turn derived from the smoothed averages of the difference between +DI and -DI; it measures the strength of the trend (regardless of direction) over time.
Trade Signals:
-> Green indicates an uptrend i.e. when +DI is above -DI and ADX is greater than 20 - there is more upward pressure than downward pressure in the price;
-> Red indicates a downtrend i.e. when -DI is above +DI and ADX is greater than 20 - there is more downward pressure on the price; and
-> Yellow indicates no strong directional trend and potential for a reversal.
Standalone Indicator:
The 10X Bars version of the indicator can be found here:

Multi-Timeframe TTM Squeeze Pro
IMPORTANT NOTE:
-> The timeframe for this indicator must be set at 1 minute;
-> If the chart timeframe is higher than 1 minute, the results shown in the table for timeframes lower than the chart will not be correct;
-> Tradingview's own documentation explains this as follows: " It is not recommended to request data of a timeframe lower that the current chart timeframe, for example 1 minute data from a 5 minutes chart. The main problem with such a case is that some part of a 1 minute data will be inevitably lost, as it’s impossible to display it on a 5 minutes chart and not to break the time axis. In such cases the behavior of security can be rather unexpected "; and
-> It is therefore recommended that this indicator is placed in a standalone 1min chart window, and the window resized to only show the table to avoid any issues.
Credits:
-> John Carter creating the TTM Squeeze and TTM Squeeze Pro
-> Lazybear's original interpretation of the TTM Squeeze: Squeeze Momentum Indicator
-> Makit0's evolution of Lazybear's script to factor in the TTM Squeeze Pro upgrades - Squeeze PRO Arrows
This is my version of their collective works, with amendments primarily to the Squeeze Conditions to more accurately reflect the color coding used by the official TMM Squeeze Pro indicator.
TTM Squeeze Guide
For those unfamiliar with the TTM Squeeze, it is simply a visual way of seeing how Bollinger Bands (standard deviations from a simple moving average ) relate to Keltner Channels ( average true range bands) compared with the momentum of the price action. The concept is that as Bollinger Bands compress within Keltner Channels , price volatility decreases, giving way for a potential explosive price movement up or down.
Differences between the original TTM Squeeze and TTM Squeeze Pro:
-> Both use a 2 standard deviation Bollinger Band ;
-> The original squeeze only used a 1.5 ATR Keltner Channel; and
-> The pro version uses 1.0, 1.5 and 2.0 ATR Keltner Channels .
The pro version therefore helps differentiate between levels of squeeze (compression) as the Bollinger Bands moves through the Keltner Channels i.e. the greater the compression, the more potential for explosive moves - less compression means more squeezing.
The Histogram shows price momentum whereas the colored dots (along the zeroline) show where the Bollinger Bands are in relation to the Keltner Channels:
-> Cyan Bars = positive, increasing momentum;
-> Blue Bars = positive, decreasing momentum (indication of a reversal in price direction);
-> Red Bars = negative, increasing momentum;
-> Yellow Bars = negative, decreasing momentum (indication of a reversal in price direction);
-> Orange Dots = High Compression / large squeeze (One or both of the Bollinger Bands is inside the 1st (1.0 ATR) Keltner Channel);
-> Red Dots = Medium Squeeze (One or both of the Bollinger Bands is inside the 2nd (1.5 ATR) Keltner Channel);
-> Black Dots = Low compression / wide squeeze (One or both of the Bollinger Bands is inside the 3rd (2.0 ATR) Keltner Channels );
-> Green Dots = No Squeeze / Squeeze Fired (One or both of the Bollinger Bands is outside of the 3rd (2.0 ATR) Keltner Channel).
Ideal Scenario:
As the ticker enters the squeeze, black dots would warn of the beginning of a low compression squeeze. As the Bollinger bands continue to constrict within the Keltner Channels , red dots would highlight a medium compression. As the price action and momentum continues to compress an orange dot shows warning of high compression. As price action leaves the squeeze, the coloring would reverse e.g. orange to red to black to green. Any compression squeeze is considered fired at the first green dot that appears.
Note: This is an ideal progression of the different types of squeezes, however any type of squeeze (and color sequence) may appear at anytime, therefore the focus is primarily on the green dots after any type of compression.
Entry and Exit Guide:
-> John Carter recommends entering a position after at least 5 black dots or wait for 1st green dot ; and
-> Exit on second blue or yellow bar or, alternatively, remain in the position after confirming a continuing trend through a separate indicator.
Standalone Indicator:
The indicator (which can be used on any timeframe) can be found here:

HTF Candles & PivotsThis indicator displays HTF candles and pivot points.
The candles are displayed in a box and you can select Open-Close, High-Low or both.
You can show all of the past, or just "today only" or "previous day only".
You can also shift one previous candle to the current one.
The pivot point is the normal one.
There is an option to display CPR (Central pivot range).
Example: Shift previous to current

Percentage Levels by TimeframePlots the positive and negative percentage levels from a selection of timeframes and sources for any ticker. You can use this within a pullback trading system. For example, if you historically look at the average pullback of large cap stocks and ETF's, you can use this indicator to plot the levels it could pullback to for an entry to go long. It can be used as potential targets when trading a ticker short. Another use for this is to backtest the set percentage targets using TradingView's bar replay feature to see how ETF's and large cap stocks have reacted at these levels. Note: This is intended to be used at timeframes equal to higher than the chart's as it may cause re-painting issues.
Currently percentage levels are statically set to 1, 3, 5, 10, 15, 20, 25, and 30% levels above and below the chosen source (open, high, low, close). You can also display the data based on timeframes from Daily (1D) all the way up to Yearly (12M)
*Not financial advice but in my opinion the current percentage levels set (see above) are best used for ETF's and Large Cap Stocks.
Jan 2
Release Notes: Added the ability to select the historical bars to look back when plotting levels
Jan 2
Release Notes: To get a better display or proper resolution on your charts, change the view settings to "Scale Price Chart Only"
Jan 2
Release Notes: To add % labels for this indicator on the price axis, change your chart settings to include "Indicator Name Label" & "Indicator Last Value". You can find this under the Label section after hitting the gear icon in the bottom right of your chart.
Jan 2
Release Notes: Added: Custom Line Plot Extension Settings. Ideally both values should be equal to display optimal extended lines. To return to a base setting: '1' = Historical Lookback & '0' = Offset Lines. Also note this is dependent on the timeframe you are viewing on the chart.
Jan 2
Release Notes: Removed indicator from example chart that was not needed.
Jan 2
Release Notes: Updated some comments in the Pine Script
Jan 2
Release Notes: Update: Added commentary and instructions in the indicator settings to address recommended line plot settings for Stocks/ETF's vs Futures
Jan 2
Release Notes: Changed title from "Calculation Method" to "Calculation Source"
Jan 4 2021
Normal use of security() dictates that it only be used at timeframes equal to or higher than the chart's as it may cause re-painting

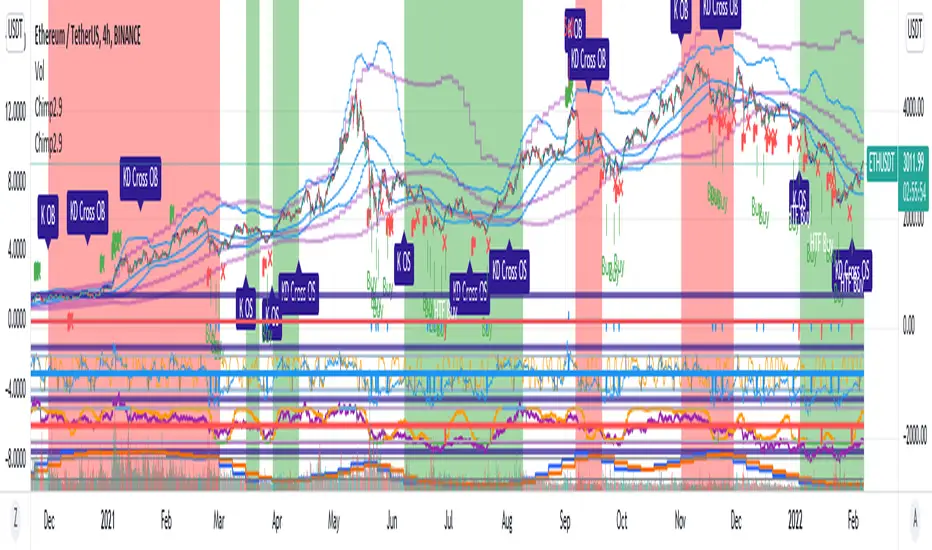
Chimpanzee V2.5 part A by joylay83Hi everyone, I am an amateur pinecoder. I would like to share my script which is coded with the intention of generating signals to send to 3commas webhook. It is still in development and revision.
This collection of indicators use:
Chart: 15m.
Inverse Fisher Transformation of the RSI to detect dips in the 15m timeframe.
Bollinger band (4H) to filter out false signals.
Triple EMA 21: to mimic price action for easier coding alerts. Currently not involved in generating signals. will be incorporated in the future.
StochRSI: As a visual filter. Currently not involved in generating signals. will be incorporated in the future.
Background will be green if stochRSI is low and red if stockRSI is high.
Candlesticks will be marked with a flag is TEMA breached BB.
One would need to play around with timeframes, BB settings and IFTRSI threshold for different signals.
There are 2 Signal Modes (with regards to IFTRSI):
Threshold: When price action falls below BB and IFTRSI hits buy threshold, a buy/sell signal is generated. Eg if IFTRSI buy threshold is set to -0.9, the buy signal will remain continuously positive as long as IFTRSI is < 0.9.
Cross: When price action falls below BB and IFTRSI hits threshold, nothing happens. It will wait until the IFTRSI cross back over the threshold before firing a signal.
There is another identical set of indicators running on a higher time frame (IFTRSI: 4H, BB: D or 3D, TEMA 21 4H) but on the same chart. This tend to generate less signals but are more reliable. A usage example would be to send a larger buy order if the signal comes from this higher time frame, or execute a sell order after multiple buys from the lower time frame.
It comes in 2 parts:
Part A: Contains overlay display. This displays BB, Triple EMA, buy/sell and StochRSI in labels. the labels are self explanatory.
Part B (please search for it): which is actually the same code but contain non-overlay display. You may also put part B overlay=true but scale to LEFT. The advantage of using overlay=true is that you can move the signal right over the candlesticks (mainly for troubleshooting/debugging). This part contains Inverse Fisher RSI, %B, Signal Line. %B is supposedly idential to Bollinger Bands in Part A.
By default, when there is a buy/sell signal:
lower time frame 15m: Signal Line in Part B will turn blue with a value 1 or -1 which corresponds to a buy or sell label in Part A
higher time frame 4H: Signal Line in Part B will turn red with a value 2 or -2 which corresponds to a HTF buy or sell label in Part A
Part A or B may be used to send signal to the webhook. You have to make sure that the settings of Part A and B are identical.
You may choose to un-display some items to reduce clutter.
Current problems:
1. Still too many buy signals
Although many times it will generate excellent buy signal at many swing lows, but there are many buy signals prior to a major swing low. This can be observed in the picture above. It also generate a couple of buy signals prior to the swing lows. I am currently experimenting with 20m and hourly timeframe to address this issue. More filters are needed eg an oscillator or detecting candlestick patterns.
2. Premature sell signals.
The sell signal is often generated at the beginning of a major bull run. My idea to solve this problem is to move to a higher timeframe and sell only when TEMA crossunder the upper bollinger band.
3. Lack of a backtester that can test multiple concurrent deals.
Buy -> Buy (average down) -> Buy (average down) -> Buy (average down) -> Sell
4. Lack of the ability to calculate average purchase price
Probably have to code it as a strategy
5. Display lag
As the browser is running 2 copies of the idential script, it tends to lag when you drag your chart around. So far there are no timeouts or delay in firing alerts to 3commas.
I do welcome any suggestion for improvement and constructive criticism. tqvm.
Credits : Thank you for doing an awesome job. I learnt a lot from your codes and tutorials.
Credits not listed in any order. If your code is used here and did not receive due credit, kindly drop me a note. tq.
Blessing 3 by JTA Today
@ZenAndTheArtOfTrading (extremely-easy-to-understand tutorials eg fixing repainting)
@LazyBear (various codes)
@Galactus-B Argo I
@TheTradingParrot (Inverse Fisher RSI and Gavin's backtester)
@zendog123 (backtester and various codes)
@ydeniz2000 (Bollinger Bands)
TradingView built-in scripts
Volume-based Support & Resistance ZonesThe new and improved Support & Resistance Zones indicator is here. This indicator is based on high volume at fractal lows or fractal highs with the zones based on the size of the wick for that timeframe’s candle.
This helps traders visualize which price levels are of the most significance for either reversals or continuation of the trend when zones are broken and then re-tested.
Original script is thanks to synapticex and additional modifications is thanks to Lij_MC. Credit to both of them for most of the logic behind this script.
Since then I have made many changes to this script as noted below:
Changed default S/R lines from plots to lines, and gave option to user to change between solid line, dashed line, or dotted line for both S/R lines.
Added additional time frame and gave more TF options for TF1 other than current TF. Now you will have 4 time frames to plot S/R zones from.
Gave user option to easily change line thickness for all S/R lines.
Made it easier to change colors of S/R lines and zones by consolidating the options under settings (rather than under style).
Added extensions to active SR Zones to extend all the way right.
Added option to extend or not extend the previous S/R zones up to next S/R zone.
Added optional time frame labels to active S/R zones, with left and right options as well as option to adjust how far to the right label is set.
Fixed issue where the higher time frame S/R zone was not properly starting from the high/low of fractal. Now any higher time frame S/R will begin exactly at the High/Low points. Note that this may not work perfectly on stocks and if a fractal high/low is too many bars in the past, it will revert to a default max bars back to avoid script errors.
Added to script a function that will prevent S/R zones from lower time frames displaying while on a higher time frame. This helps clean up the chart quite a bit.
Created arrays for each time frame's boxes and lines so that the number of S/R zones can be controlled for each time frame and limit memory consumption.
New alert options added and customized alert messages.
- The way this indicator works is it looks for fractal highs or fractal lows with volume that pierces above the volume's Moving Average. This moving average value can be modified in the settings for each time frame.
- The fractal highs will be confirmed with 3 successive higher highs followed by 2 successive lower highs and vice versa for the fractal lows.
- The zone is created from the fractal high/low and the close of the candle for whatever time frame you selected. The bigger the zone, the more significant that zone is.
- You can disable any zone, change the zones to show lines only, and modify all the colors, transparencies, and thickness of lines for all the zones.
- To create alerts, you first want to enable the types of alerts you want for each time frame in the indicator's settings. Then after you apply changes, right click on one of the zones on the chart, and click "Add Alert on Vol S/R Zones". You do not need to add a title as the correct alert messages are already built-in.
- More changes will be coming in the future!
I hope you find this indicator useful, if so please give it a thumbs up!
If you have any suggestions or features you would like to see, just let me know in the comment section. Thanks and enjoy!

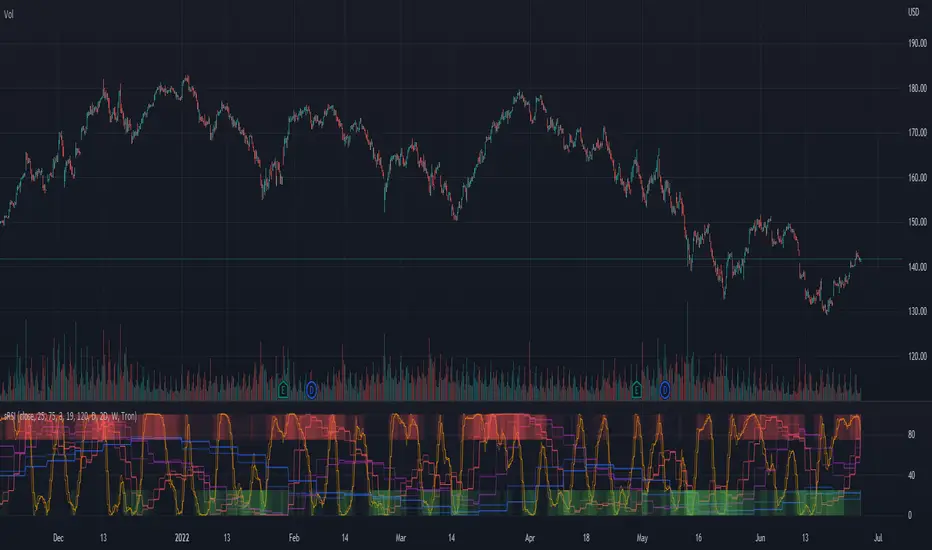
MTF RSI + Average (Multi-Timeframe) [TH]Multi-Timeframe Relative Strength Index --- MTF RSI
Eliminates having to change time intervals to view a different Time Interval's RSI value (up to 5 time intervals possible through the settings).
The RSI values from Multiple Time Frames can be averaged together to show one single RSI.
A table overlay (info box) makes it easy to quickly identify RSI values on the multiple different time frames.

Multi-timeframe Stochastic RSIThe multi-timeframe stochastic RSI utilizes stochastic RSI signals from 11 different time-frames to indicate whether overbought/oversold signals are in agreement or not across time-frames. Ideally traders should enter and exit when conditions are in agreement as indicated by the intensity of the long (green) or short (red) bands at the top and bottom of the indicator. The intensity of the bands indicates how many of the time-frames are currently overbought/oversold.
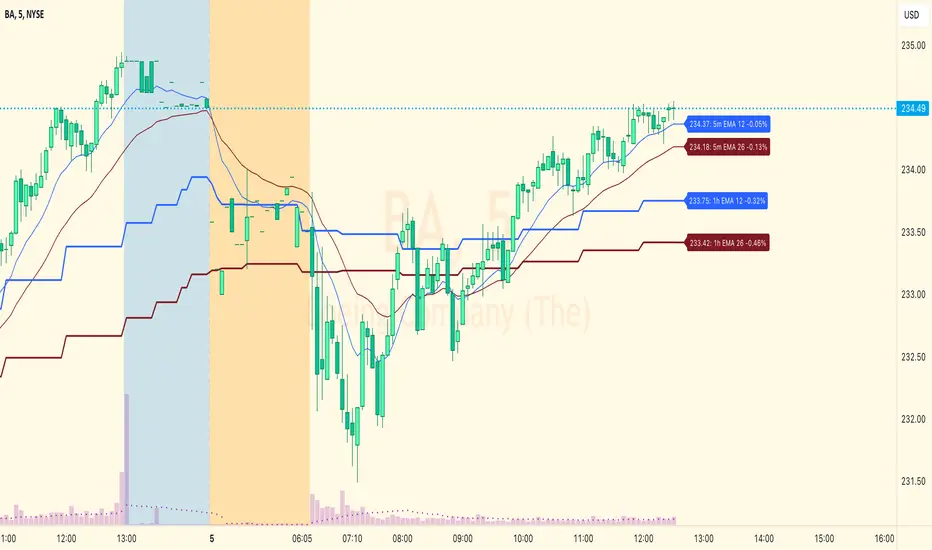
EMA Levels, Multi-TimeframeThe exponential moving average (EMA) tracks price over time, giving more importance to recent price data than simple moving average (SMA). EMAs for larger timeframes are generally considered to be stronger supports/resistances for price to move through than smaller timeframes. This indicator allows you to specify two different EMA lengths that you want to track. Additionally, this indicator allows you to display not just the EMA levels of your currently viewed timeframe on the chart, but also shows the EMA levels of up to 4 different timeframes on the same chart. This allows you to quickly see if multiple EMA levels are aligning across different timeframes, which is an even stronger indication that price is going to meet support or resistance when it meets those levels on the chart. There are a lot of nice configuration options, like:
Ability to customize the EMA lengths you want to track
Style customization (color, thickness, size)
Hide any timeframes/levels you aren't interested in
Labels on the chart so you can tell which plots are the EMA levels
Optionally display the plot as a horizontal line if all you care about is the EMA level right now
RSI Levels, Multi-TimeframeThe relative strength index (RSI) is a momentum indicator that measures the magnitude of recent price changes to evaluate overbought or oversold conditions. RSI is normally displayed as an oscillator separately from price and can have a reading from 0 to 100. This indicator takes the RSI and plots the 30 & 70 levels onto the price chart so you can see when price is going to meet the 30 or 70 levels. The reason the 30 & 70 levels are important is because many traders (and bots) use those as signals to buy (at 30 RSI) or sell (at 70 RSI). Additionally, this indicator allows you to display not just the RSI levels of your currently viewed timeframe on the chart, but also shows the RSI levels of up to 6 different timeframes on the same chart. This allows you to quickly see if multiple RSI levels are aligning across different timelines, which is an even stronger indication that price is going to change direction when it meets those levels on the chart. There are a lot of nice configuration options, like:
Style customization (color, thickness, size)
Labels on the chart so you can tell which plots are the RSI levels
Optionally display the plot as a horizontal line if all you care about is the RSI level right now
Toggle overbought (RSI 70) or oversold (RSI 30) on/off completely

+ Donchian ChannelsThis version of Donchian Channels uses two source options so that one can create a channel using highs and lows rather than one or the other or closes. My thinking was that this would create a more accurate portrayal of price action (or at least contain the greatest scope of it) as seen through the lens of a Donchian Channel. This was actually part of the genesis of my idea around my Ultimate Moving Average.
Besides the single top and bottom plot for the DC's extremities, I've enabled the ability to create outer bands with a variable width that the user can adjust to their preference. I think it's quite nice. I use it in the DC in my other non-overlay indicators.
Besides this additional functionality, the indicator has options to plot lines between the basis and the upper and lower bands, so, basically, splitting the upper and lower channel in half.
There is no magic number to the lookback. I chose 233 as default because it's a fibonacci sequence number and I'm more interested in using the DC like a very long period bias indicator, and the longer lookback gives a much wider window (because highs and lows are so spread apart) with which other faster indicators (supertrend, shorter period moving averages, etc.) can work without making the screen a clutter.
The color of the basis may also be made relevant to higher timeframe information. What I mean by this is that you can set it so that the basis of the current timeframe is colored based on the candle close of the higher timeframe of your choosing. If you're looking at an hourly chart, and you set the color to Daily, the basis will be colored based on the candle close (above or below the basis) of the previous day. If the previous daily close was above the basis, that positive color will be reflected in the basis, even if the current hourly candle closes are below the hourly basis. This could potentially be useful for setting a higher timeframe directional bias and reacting off price crossing the lower timeframe basis (or whatever your trigger for entering a trade might be). This is also optional in my Ultimate Moving Average indicator.
You can also set the entire indicator to whatever time frame you want if you want to see where the actual basis, or other levels are on that higher timeframe.
Further additions include fibonacci retracement levels. These are calculated off the high and the low of the Donchian Channels themselves.
You will see that there are only three retracement levels (.786, .705, .382), one of which is not a fib level, but what some people call the 'OTE,' or optimal trade entry. If you want more info on the OTE just web search it. So, why no .618 or .236? Reason being that the .618 overlaps the .382, and the .236 is extremely close to the .786. This sounds confusing, but the retracement levels I'm using are derived from the high and low, so it was unnecessary to have all five levels from each. I could have just calculated from the high, or just from the low, and used all the levels, but I chose to just calculate three levels from the high and three from the low because that gives a sort of mirror image balance, and that appeals to me, and the utility of the indicator is the same.
The plot lines are all colored, and I've filled certain zones between them. There is a center zone filled between both .382 levels, and an upper and lower zone filled between the .786 and either the high or the low.
If you like the colored zones, but don't like the plots because they cause screen compression, turn off the plots under the "style" tab.
There are alerts for candle closes across every line.
I should state that, regarding the fibs, obviously the length of the Channels is going to affect to what levels price retraces to. A shorter lookback means you will see more changes in highs and lows, and therefore retraces are often going to be full retraces within the bands unless price is trending hard. A longer lookback means you will see smaller retraces. Using this in conjunction with key high timeframe levels and/or a moving average can give great confidence in a trade entry. Additionally, if you have a short bias it may help in finding levels or entering a trade on a pullback. It could also be good for trade targets. But again, the lookback you choose for this indicator is going to dictate its use in the system you're building or already have. A 9 EMA and a 200 EMA, while fundamentally the same, are going to be used somewhat differently while doing your chart analysis.
Additional images below.
Same image as main, but with supertrend and my +UMA to help with chart analysis.
Image with the fib stuff turned on.
Zoomed out image with the same.
Shorter lookback period.
Zoomed in image of shorter lookback.
