2U2DFlipHappy to contribute to the community request for indicators that TheStrat community find useful, I have published the requested 2U/2D flip indicator with built in 'alert' feature.
Adding this indicator to your chart will allow you to use the awesome Tradingview 'alert' functionality to register an alerts when either of these two conditions are true:
- When the candle colour of TheStrat 2U green candle turns RED
- When the candle colour of TheStrat 2D red candle turns GREEN
The significance of this event is an indication that price might have reversed and is more applicable on higher timeframes .
Explanation of 'TheStrat' trading technique
‘TheStrat’ technique works off the basis of labelling whether the focus candle did or did not break any of the previous candles high or low values. There are three possible label definitions; either a 1 candle, 2 candle or a 3 candle.
1 bar (inside) - If price movement on the new candle remains within the high and low of previous candle.
3 bar (outside) – If price movement went above both the high and the low of the previous candle.
2 bar (directional) – If price movement only broke with the high (called a 2-up) or if price movement only broke the low of the previous candle (called a 2-down).
How does the indicator work?
This indicator will allow the user to be alerted when this colour change happens on any ticker and timeframe you have added the indicator to and then register an alert. The key decisions are which TICKER and which TIMEFRAME to register the alert. It will alert for both these conditions within the single alert.
When a registered alert is running it will continually monitor for these conditions and once per bar it will immediately generate the alert notification using the existing built-in TradingView alert feature. This indicator is not market or timeframe specific, in fact this alerting indicator can be used to register alerts on multiple tickers and timeframes simultaneously.
Example of how to use the indicator
Assume you are interested in being alerted for any colour changing candle on AAPL on the 30min timeframe. You would simply go to that chart (APPL on 30 min), add '2U2DFlip' indicator to the chart, then using the built-in TradingView - 'Create Alert' feature to register the alert that will listening to '2U2DFlip' indicator monitored events. In this example the alert will specifically trigger if it finds a 2U candle turning red or a 2D candle turning green and sends the alert allowing you to jump to the chart to review.
Description of the script
The script defines two conditions that incorporate the specific definition of TheStrat 2U and 2D candles, meaning, that in relation to the previous candle it only 'broke' one side of the previous candle and then adds another condition that monitors if the colour changes (close > open) of the current candle.
How is this useful to a trader?
The 2U and 2D candles are known as 'directional' candles in TheStrat community so the fact that a directional candle has 'changed' direction is a significant indication of a reversal. When this event happens a trader would be notified and is in a position to determine if a reversal play might be in order.
Note to moderators
This code is my own code, based on my other popular indicators. It encompasses the definitions of TheStrat community and trading style and was requested by the community users that trade using TheStrat technique. The reason for the source being protected is that it contains my own method of defining TheStrat and source code of my paid indicator.
Good Luck with trading and I hope this indicator helps to increase the profitability of your portfolio. Happy Trading.
Thestrat

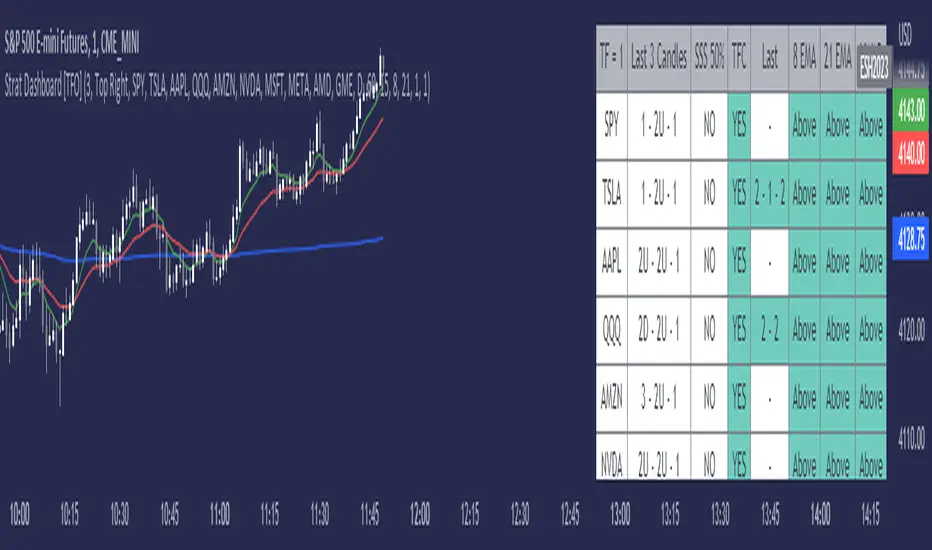
Strat Dashboard [TFO]The Strat Dashboard tracks up to 10 signals while highlighting common strat reversal patterns, the SSS 50% rule, timeframe continuity, and some additional criteria with VWAP and moving averages.
With the strat, all price action bars/candles are simplified into 3 total possibilities: 1 (inside bar), 2 (a bar that takes the previous bar's high OR low), and 3 (outside bar). The first table column for Last X Candles shows the most recent candles according to this notation, for example, 1 - 2D - 2U. This would mean we had an inside bar, followed by a bar that took the previous bar's low, followed then by a bar that took the previous bar's high. Note that the colors in this column are set according to whether the current bar's close exceeds the previous bar's high/low. By default, these colors are green if above the previous bar's highs, or red if below the previous bar's lows. If the current close is in between the previous candle's high and low (even after already taking the prior high or low), no color will be applied.
The SSS 50% column shows a yes or no value for whether the current bar aligns with the SSS 50% rule, where a bar has taken either the previous high or low, and has since reversed to at least the midway point of the previous bar's height - essentially anticipating a 2 that may become a 3 (outside bar).
Timeframe continuity (TFC) shows a yes or no value for when the current candle on multiple timeframes are all green or red (above the open price or below the open price, respectively). For example, if you were looking at the current 15m, 1h, and 1D bars, and they were all above the open price, you could say there's TFC between all three timeframes. As of the initial release, you can select up to 3 different timeframes. The table values will only be true when all selected timeframes are in alignment. When setting alerts, first deselect the timeframes if you don't want TFC logic to impact alerts.
The "Last" column shows the last strat reversal pattern that was confirmed (after the last bar closes). Waiting for a candle close is the safer option since a 2 can turn into a 3; however for higher timeframes, it may be beneficial to make an update to this indicator in which you can have live alerts as well (not waiting for a candle close). You can select which strat reversals you want to be shown from the settings. Various strat reversals may be selected for alerts of type "Any"; for example, if setting up an alert for "Any" strat reversal on Symbol 1, then this alert will go off when any of the *selected* strat reversals occur for that specific symbol. Deselect any strat reversals that you don't want to be included in these alerts.
Lastly, the EMA and VWAP columns simply show whether price is above or below said value. This tracks the current candle close, and may repaint/change several times if the current bar is oscillating above and below these values.
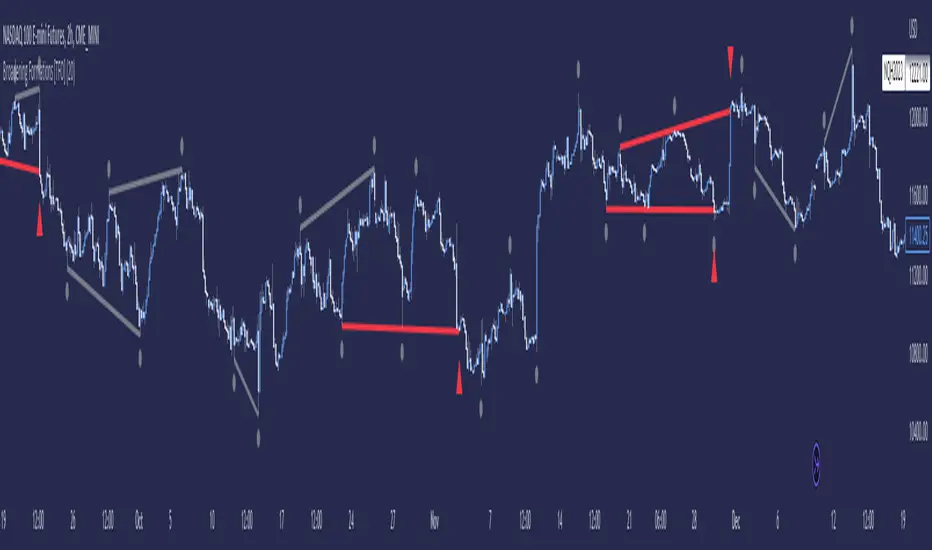
Broadening Formations [TFO]This indicator highlights deviations from broadening formations (or megaphone patterns). Deviations from broadening ranges can often foreshadow reversals, especially in consolidation phases. These deviations are highlighted via trendlines that change color when tested, and also have the option to be alerted.
These broadening formations are heavily used with "The Strat" and can add confluence when looking for reversals within higher timeframe points of interest.
GRIDBOT Scalper by nnamWhat is this Indicator used for?
Made specifically for GRID Bots
note: before continuing... this indicator works on any timeframe, but it WORKS BEST ON THE 15 MINUTE TIMEFRAME
Straters and Forex Master Pattern Value Line Traders use this to help determine when the price could reverse.
This indicator is a scalping indicator that produces signals when a "potential" reversal in price is indicated. When the price moves UP and a Potential Bearish Reversal Signal occurs, traders can use this signal as a potential SHORT entry signal for their Short Grid Bot. The process is the same in reverse. After a sustained move down, a Potential Bullish Signal can be used by the trader as a potential LONG entry signal for their GridBot.
As shown in the screenshot below, lines develop on the chart (either RED or GREEN) indicating that a sustained move in one direction is currently occurring; however, there is no potential reversal signal plotted (this means that price action is currently moving in one direction only).
As shown in the screenshot below, lines can be used as a stop-loss after entering the GRIDbot. (usually, by this time, the Grid Bot is in Profit as it usually moves in the opposite direction first)
What this Indicator Does
The GRIDBOT Scalper provides information regarding potential reversals in the market after a sustained movement in one direction (either Bullish or Bearish).
The indicator is based on PRICE-ACTION ONLY and does not take into account the current state of the market (Bullish or Bearish).
Once the price moves in a particular direction for at least 14 bars , a line appears as shown in a previous screenshot. Once the price stops moving in that direction and begins moving in the opposite direction - and after a sustained run - a "signal" appears alerting the trader that a "potential" reversal could be on the horizon soon.
If price moves in one direction and plots both a line and a signal and then begins moving back in the other direction in a sustained manner, the original signal will remain even when a NEW line begins forming (the original line will disappear). (see below) This line will continue to move as the price continues to move. Not until a signal plots on the chart is the potential reversal forming. THE LINE DOES NOT SIGNAL A REVERSAL . Some traders, however, use this information to "ride the wave UP or DOWN" and exit their positions once the signal prints.
As shown below, optional input settings allow the trader to set the line at CLOSE or HIGH/LOW of the candle preceding the potential reversal.
It is suggested to use Close instead of High or Low but the setting allows one to use either.
As shown in the screenshot below, it is typical on LOWER TIME FRAMES to see the price pass the signal line. The Indicator works best on the 15 minute timeframe, as it gives the trader time to make the decisions required as the volatility is less on the 15 minute chart vs the 1 minute or 5 minute charts.
If you have any questions or suggestions for this indicator, please join our Discord. We offer free training on this Indicator on our Discord Server.

Big Poppa Code Strat & Momentum Strategy IndicatorThis indicator is a combination of a few things in order to work with a unique trading style gleaned from Callme100k, jrgreatness, TrustMyLevels , FaithInTheStrat, Rob Smith and Saty Mahajan.
This Indicator is created to help you day trade using, ATR Fibonacci Levels, Price Action and Momentum.
It displays Fibonacci Levels Based on ATR to indicate when a security is 0.236, 0.382 +- the Days Open, +- the Days Open, 0.618 +- the Days Open and 1.0 +- Days Open.
To understand this script you need to understand
Average True Range (ATR)
1 Bar Inside Bar
2 Bar Outside Bar (Break either the top or bottom)
3 Bar Engulfing Bar
Strat Setups - 212, 322, 312
Fibonacci - 0.236, 0.382, 0.618, 1.0
Moving Averages
A Trend is considered bullish when (green)
Current Price is greater than the Fast EMA Value (8)
Fast EMA is greater than PIVOT EMA Value (21)
Pivot EMA is greater than SLOW EMA Value (34)
OR Hull is trending up and the Price is above the Volume Weighted Moving Average and price is above VWAP
A trend is considered Bearish when (red)
Current Price is less than the Fast EMA Value (8)
Fast EMA is less than PIVOT EMA Value (21)
Pivot EMA is less than SLOW EMA Value (34)
OR Hull is trending down and the Price is below the Volume Weighted Moving Average and price is below VWAP
If these conditions are not met then the Momentum is in Conflict (orange)
The Momentum band will match the color of the current trend
The table that is present can be turned off at any time lets you see
1) If Moving Averages are showing bullish, bearish or in conflict
2) If There us Time Frame Continuity, (if 5 min up, are all the other timeframes up also)
3) How much of the ATR have we moved on the day
4) Are we in Call or Put range for the day based on ATR Fib Levels
The Ideal situation for entering a call
1) Momentum is Green
2) FTFC on Green
3) A Strat Actionable Signal is present
4) You are in the call range, 0.236 - 0.618 ATR + the Price
5) The ATR still has room, I.e only 50% of the ATR has been run already
Ideal situation from entering a put
1) Momentum is red
2) FTFC on Red
3) A Strat Actionable Signal is present
4) You are in the put range, 0.236 - 0.618 ATR - the Price
5) The ATR still has room, I.e only 50% of the ATR has been run already
Exit the trade for these reasons you entered (for profit or loss)
1) ATR has no more room
2) FTFC is now in conflict
3) Momentum has shifted
Take Profit when
1) You reach a new ATR Level 0.618, 1.0 , -0.618, -1, etc
Passive Stop Loss
1) Open Price if you are aggressive
2) Next ATR Level Down or Up
Feel free to take profit and leave runners
This script does not give signals, you should do your own research, I am not a financial advisors, I am simply applying principles of seasoned veterans to code. You make all decisions about how you buy, sell and trade. The creator of this script makes no promises and takes no responsibility for your personal trading.
To research the methods described above look up
Rob Smith : The Strat
Saty Mahajan : ATR Levels
Fibonacci
Using the HULL Moving Average
Exponential Moving Averages
VWAP
VWMA

FTFC Watchlist (The Strat)This indicator is a five custom ticker watchlist that shows seven pre-defined higher timeframes using '#TheStrat' technique and can be used on any ticker from common stock, forex and crypto.
Explanation of 'TheStrat' trading technique
‘TheStrat’ technique works off the basis of labelling whether the focus candle did or did not break any of the previous candles high or low values. There are three possible label definitions; either a 1 candle, 2 candle or a 3 candle.
1 bar (inside) - If price movement on the new candle remains within the high and low of previous candle.
3 bar (outside) – If price movement went above both the high and the low of the previous candle.
2 bar (directional) – If price movement only broke with the high (called a 2-up) or if price movement only broke the low of the previous candle (called a 2-down).
Once labelled the technique then looks for certain combination of these labelled candles (called actionable setups) such as: 2-1-2, 1-2-2, 3-1-2.
What is Full Time Frame Continuity (FTFC)
Under 'The Strat' full timeframe continuity is limited to the colour (open vs close) of the candle being either green or red. When higher timeframe align with the 'same colour' is suggest that there is stronger support for that direction of the candle.
How does the indicator work?
The indicator will allow you to daily enter up to 5 watchlist tickers and in as close to real time (slight lag) show the developing FTFC of your watchlist tickers and avoids having to switch chart tickers to see the developing timeframe continuity
Example of how to use the indicator
A simple example will be the relationship between SPY and VIX and by having the higher timeframe overview of these two watchlist tickers while trading will give potential insights to how the market is trading overall.
Some people might also find it useful to see 'consolidation' (1 bar) and 'expansion' (3 bar) highlighted in the timeframe. This feature can be enabled in the settings.
Indicator caveats:
= Must run on 5min (or lower) chart timeframe. If not indicator will produce 'runtime error'.
= Weekly computation is not 100% reliable due to bug in TV when a month end occurs mid week.
= Please change the indicator colour if used on a non-dark theme.
= Please note this information is only presented for educational and learning purposes. It is by no means financial advice or provide any form of trading signals.
TO ENABLE , please follow these steps:
1) Add indicator to your chart and open settings
2) Enter which tickers (max 5) you wish to add to your watchlist by enabling the checkbox
3) Decide on the timeframes you wish to view
4) Configure the colouring of the watchlist.
Hope this indicator provides useful and educational information and helps to improve your overall access to information.

Timeframe Continuity [TFO]Simple timeframe continuity indicator - see whether the selected timeframes are currently above or below their opening prices. Allows up to 10 different timeframes to be used.

MTFT VWAPs Auto AnchoredMulti Time Frame Tools
Multi Time Frame Tools (MTFT) is a suite of scripts aimed to establish a standard timeframe-based color scheme. This can be utilized to overlay different timeframes calculations/values over a single timeframe. As one example, this would allow to observe the 5-month moving average, 5-week moving average, and 5-day moving average overlaid over each other. This would allow to study a chart, get accustomed to the color scheme and study all these at the same time much easier.
All indicators calculated using the below specific timeframes as input, will always use the color scheme outlined below. This is to get you in habit of recognizing the different timeframes overlaid in top of each other. These can be personalized.
Longer TF analysis.
Yearly - Black
Semi-Annual - Yellow
Quarterly - White
Monthly - Maroon
Weekly - Royal Blue
Daily - Lime
Shorter TF analysis.
4 hour - Fuchsia
1 hour - Orange
30 min - Red
15 min - Brown
10 min - Purple
5 min - Lilac
All color coordination is able to be modified in either the “Inputs” or “Style” section. If you need to make changes, make sure to select “Save as Default” on the bottom right of the settings menu.
Recommended Chart Color Layout
I played around with color coordination a lot. The final product was what worked best for me. I personally use the following chart settings to accent all available TF colors.
-> Click on the settings wheel on your chart. -> Click on “Appearance”.
Background - Solid -> On the top row pick the 6th color from the left.
Vert Grid Lines and Horz Grid Lines -> On the top row pick the 7th color from the left.
You may of course change these and the indicator line colors as you like.
Adding indicator to Chart
-> Open the TradingView “Indicators & Strategies” library, the icon has “ƒx”. -> All premium scripts will be located under “Invite-Only Scripts” -> Click indicator to add to your chart.
MTFT VWAPs Auto Anchored
The Anchored Volume-Weighted Average Price, Anchored VWAP, is a commonly discussed FinTwit tool. I personally found it through Brian Shannon on Twitter. I have seen big FinTwit accounts solely focus on this strategy alone and have seen other big FinTwit accounts mix with their other indicators. I will be providing very basic info to utilize this script; it is up to you to dive deep into learning this strategy. I am not an expert with the tool or a financial advisor. As with all aspects of life, I recommend you research, learn, discern and practice extensively in order to become a master.
The script has the following features.
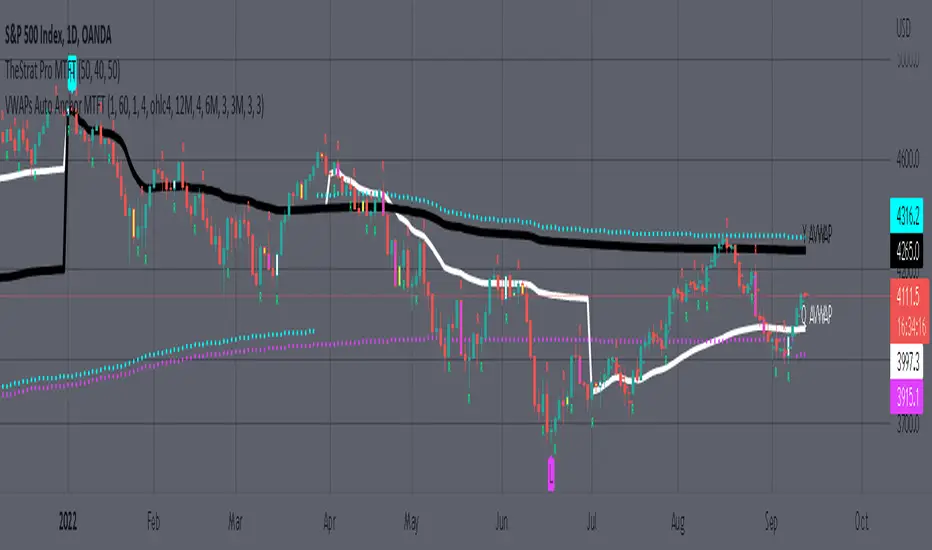
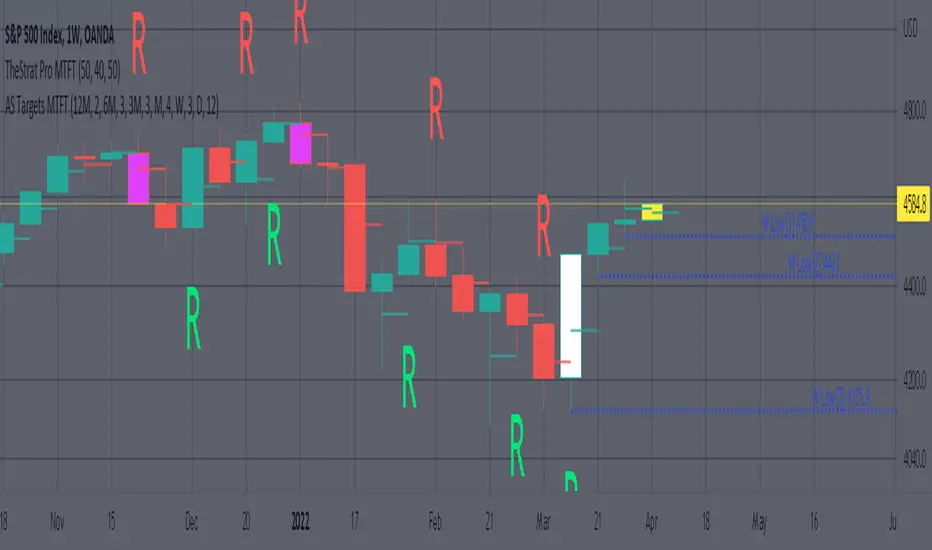
1. Three user selected time frames auto anchored VWAPS. It will auto anchor to the start of the timeframe. Timeframes(TF) include: Yearly(Y), Semi-annually(S), Quarterly(Q), Monthly(M), Weekly(W), Daily(D), and 4 hour. Image below shows the D candlestick as the active timeframe, the anchored VWAPs for the Year, Quarter, and Month.
2. Auto hide lower timeframe calculations. Auto Hide feature will hide smaller TF calculations when a larger timeframe is selected as the display TF. Example, when the Daily timeframe candlestick selected the Weekly and Daily Anchored VWAPs are hidden because they produce very noisy results. If a lower TF is selected such as the 30 min candlestick, the previously hidden Daily and Weekly Open Anchored VWAPs are now displayed. Notice that this specific indicator calculates different with every different timeframe that is selected. The lower TF calculations are more accurate as they include additional information. Image below shows the 30 min timeframe selected with the Daily, Weekly, and Monthly Open Anchored VWAPs displayed.
3. Auto Anchor using Pivot High/Low locations. Script finds the pivot highs/lows with a user selected look back/forward period. Additionally, as new pivot highs/lows appear you can choose to keep up to 4 each previous pivot high/low anchored VWAPs displayed. Image below has a 40 look back/forward period selected, and 2 past AVWAPs enabled.
You may notice in the above image that there is a gap between the AVWAP plot and the marked pivot point. This is not something that can be avoided as the script has to look forward in order to verify the pivot. The calculation is still correct, this can be verified by manually adding an “Anchored VWAP” drawing and seeing the values align. Image below shows that they match. White lines are the manually added “Anchored VWAP” drawings. If you verify this for yourself, make sure to select the correct input source in the settings of the drawing.
4. Auto Anchored on IPO High/Low. Looks for the first available candlestick in a chart and anchors to the high and low. This is useful with newer companies with recent IPOs.
IMPORTANT NOTE to TradingView admin: One of the lessons I would consider most important in attaining clarity regarding trading, is “TheStrat” by Rob Smith. His lesson on “actionable signals” is something that can be applied to any strategy. For this reason, I am including “MTFT TheStrat Patterns Pro” script in all images that will depict confluence for a better trade selection.
Example using TheStrat Pro MTFT with this indicator.
Look for a “TheStrat actionable signal” or a “TheStrat Reversal signal” on a smaller timeframe that has an instance of this indicator on a larger timeframe calculation that is in range of the candlestick that formed your actionable signal. This means that the indicators plot you are observing must be above the low and below the high of the candlestick that is the actionable signal/reversal signal.
The Image below shows what this would look like with this indicator. The selected candlestick is the 2-day, it shows a 1-3-1 pattern and the Quarter Anchored VWAP in range. This actionable signal could be played in both directions. If the high is breached, you would enter a long position from the high of the inside candlestick. If the low is breached than you would enter a short. For targets you would look at the previous pivots, for this example all targets were hit. Note that the “Entry” and “Targets” line were added manually and are not part of the script. Setups won’t always play out so nice and clean, but given that there is so many stocks and so many signals this is just a thought to improve the quality of the signal as it has extra confluence. If you are interested in learning further, research ‘TheStrat’ by Rob Smith.
MTFT Reversal Lines, TheStrat Suite (5of5)Multi Time Frame Tools
Multi Time Frame Tools (MTFT) is a suite of scripts aimed to establish a standard timeframe-based color scheme. This can be utilized to overlay different timeframes calculations/values over a single timeframe. As one example, this would allow to observe the 5-month moving average, 5-week moving average, and 5-day moving average overlaid over each other. This would allow to study a chart, get accustomed to the color scheme and study all these at the same time much easier.
All indicators calculated using the below specific timeframes as input, will always use the color scheme outlined below. This is to get you in habit of recognizing the different timeframes overlaid in top of each other. These can be personalized.
Longer TF analysis.
Yearly - Black
Semi-Annual - Yellow
Quarterly - White
Monthly - Maroon
Weekly - Royal Blue
Daily - Lime
Shorter TF analysis.
4 hour - Fuchsia
1 hour - Orange
30 min - Red
15 min - Brown
10 min - Purple
5 min - Lilac
All color coordination is able to be modified in either the “Inputs” or “Style” section. If you need to make changes, make sure to select “Save as Default” on the bottom right of the settings menu.
Recommended Chart Color Layout
I played around with color coordination a lot. The final product was what worked best for me. I personally use the following chart settings to accent all available TF colors.
-> Click on the settings wheel on your chart. -> Click on “Appearance”.
Background - Solid -> On the top row pick the 6th color from the left.
Vert Grid Lines and Horz Grid Lines -> On the top row pick the 7th color from the left.
You may of course change these and the indicator line colors as you like.
Adding indicator to Chart
-> Open the TradingView “Indicators & Strategies” library, the icon has “ƒx”. -> All premium scripts will be located under “Invite-Only Scripts” -> Click indicator to add to your chart.
MTFT TheStrat Suite (5 Scripts)
Rob Smith is the creator of ‘TheStrat’ trading strategy. For ‘TheStrat’ I have put together a suite of 5 premium scripts that combined will offer people interested in learning ‘TheStrat’ a cleaner learning process. For 2 of the 5 scripts specifically, the MTFT approach of overlaying multiple longer timeframes(TF) over a shorter TF selected as a display cannot be utilized. The other 2 scripts will have full MTFT functionality and they are my personal favorite. I will be providing very basic info to utilize this script; it is up to you to dive deep into learning this strategy. I am not an expert with the tool or a financial advisor. As with all aspects of life, I recommend you research, learn, discern and practice extensively in order to become a master.
1. MTFT Patterns Pro/Noob
2. MTFT Full Time Frame Continuity Table
3. MTFT Last HML wOpen
4. MTFT Actionable Signal Targets
*5. MTFT Reversal Lines
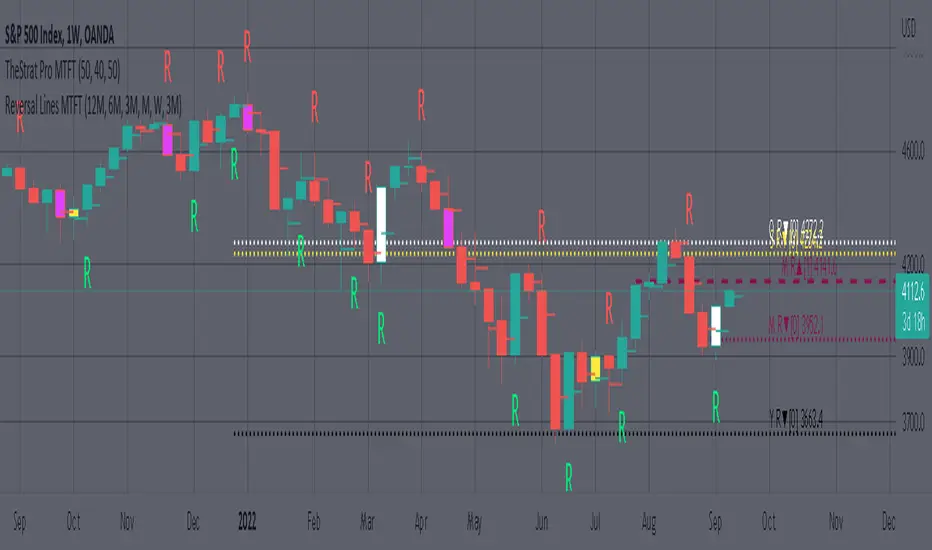
MTFT Reversal Lines, TheStrat Suite (5of5)
This script will plot the line at the point that the reversal was formed for multiple timeframes. Often times price retraces to these points before making more explosive moves in continuation of the reversal direction.
The script has the following features.
Six user selected time frames per script instance can be enabled/disabled. Timeframes include: Yearly(Y), Semi-annually(S), Quarterly(Q), Monthly(M), Weekly(W), Daily(D), 4 hour, 1 hour, 30 min, 15 min, 10 min, and 5 min. Image below shows the Weekly TF selected, and only the W, Q, M, and W are enabled. I’ve included some comments on basic observations.
2. Auto hide lower timeframe calculations. Auto Hide feature will hide smaller TF calculations when a larger timeframe is selected as the display TF. Example, when the Daily timeframe candlestick selected the 4 hour and smaller calculations are hidden because they produce irrelevant results relative to the selected timeframe. If a lower TF is selected such as the 30 min candlestick, the previously hidden timeframes are now displayed. This allows easier study as you change between displayed timeframes.
This script works best in conjunction with ‘MTFT Last HML Band wOpen’. In the image below I have the W candlestick selected, along with the Q HML Lines, and the Q Reversal Line shown. It shows you a clearer picture of how price moves on a TheStrat continuation CS and after a TheStrat reversal point is made. This lets you break into the fine details of what happened inside Quarter 1, 2022 and after the reversal point was formed.
IMPORTANT NOTE for TradingView admin: One of the lessons I would consider most important in attaining clarity regarding trading, is “TheStrat” by Rob Smith. His lesson on “actionable signals” is something that can be applied to any strategy. For this reason, I am including “MTFT TheStrat Patterns Pro” script in all images that will depict confluence for a better trade selection.
Example using TheStrat Pro MTFT with this indicator.
Look for a “TheStrat actionable signal” or a “TheStrat Reversal signal” on a smaller timeframe that has an instance of this indicator on a larger timeframe calculation that is in range of the candlestick that formed your actionable signal. This means that the indicators plot you are observing must be above the low and below the high of the candlestick that is the actionable signal/reversal signal. Image below shows what this would look like with this indicator.
The Image below shows what this would look like with this indicator. The selected candlestick is the 3-day, it shows a 2U-1-potential 2D Reversal pattern and the Quarter Reversal Down line in range. This actionable signal is meant to be played for SHORTS. If the low is breached, you would enter a SHORT position from the low of the inside candlestick. For targets you would look at the previous pivots, for this example all targets were hit. This won’t always play out so nice and clean, but given that there is so many stocks and so many signals this is just a thought to improve the quality of the signal as it has extra confluence.
MTFT Actionable Signal Targets, TheStrat Suite (4of5)Multi Time Frame Tools
Multi Time Frame Tools (MTFT) is a suite of scripts aimed to establish a standard timeframe-based color scheme. This can be utilized to overlay different timeframes calculations/values over a single timeframe. As one example, this would allow to observe the 5-month moving average, 5-week moving average, and 5-day moving average overlaid over each other. This would allow to study a chart, get accustomed to the color scheme and study all these at the same time much easier.
All indicators calculated using the below specific timeframes as input, will always use the color scheme outlined below. This is to get you in habit of recognizing the different timeframes overlaid in top of each other. These can be personalized.
Longer TF analysis.
Yearly - Black
Semi-Annual - Yellow
Quarterly - White
Monthly - Maroon
Weekly - Royal Blue
Daily - Lime
Shorter TF analysis.
4 hour - Fuchsia
1 hour - Orange
30 min - Red
15 min - Brown
10 min - Purple
5 min - Lilac
All color coordination is able to be modified in either the “Inputs” or “Style” section. If you need to make changes, make sure to select “Save as Default” on the bottom right of the settings menu.
Recommended Chart Color Layout
I played around with color coordination a lot. The final product was what worked best for me. I personally use the following chart settings to accent all available TF colors.
-> Click on the settings wheel on your chart. -> Click on “Appearance”.
Background - Solid -> On the top row pick the 6th color from the left.
Vert Grid Lines and Horz Grid Lines -> On the top row pick the 7th color from the left.
You may of course change these and the indicator line colors as you like.
Adding indicator to Chart
-> Open the TradingView “Indicators & Strategies” library, the icon has “ƒx”. -> All premium scripts will be located under “Invite-Only Scripts” -> Click indicator to add to your chart.
MTFT TheStrat Suite (5 Scripts)
Rob Smith is the creator of ‘TheStrat’ trading strategy. For ‘TheStrat’ I have put together a suite of 5 premium scripts that combined will offer people interested in learning ‘TheStrat’ a cleaner learning process. For 2 of the 5 scripts specifically, the MTFT approach of overlaying multiple longer timeframes(TF) over a shorter TF selected as a display cannot be utilized. The other 2 scripts will have full MTFT functionality and they are my personal favorite. I will be providing very basic info to utilize this script; it is up to you to dive deep into learning this strategy. I am not an expert with the tool or a financial advisor. As with all aspects of life, I recommend you research, learn, discern and practice extensively in order to become a master.
1. MTFT Patterns Pro/Noob
2. MTFT Full Time Frame Continuity Table
3. MTFT Last HML wOpen
*4. MTFT Actionable Signal Targets
5. MTFT Reversal Lines
MTFT Actionable Signal Targets, TheStrat Suite (4of5)
Plots the previous highs/lows for the selected timeframe. Will not plot the high/low for a candlestick that is still active/open. You will have to manually Enable/Disable the high/low depending on the type of actionable signal that you are observing. Previous high/low lines will start from the near exact time that it opened so you can see exactly from what previous candlestick you are tracking each target.
Features includes:
1. Six Different Timeframes per script instance. Example below shows a weekly timeframe selected with a Shooting Star as the actionable signal that is being considered along with the past 3 lows for the Week timeframe being enabled. These would be your targets if you were to enter this SHORT trade. Keep in mind that every new week that opens the script will update to the newest 3 lows so if you are still inside a trade you might have to increase the number of past lines in order to keep an eye on the original targets. Which is why I selected 3 in this example, even if there is only 2 targets in mind.
The script will allow you to observe how price moves after an actionable signal is triggered and as it approaches the targets on smaller timeframes. Here is the setup from above on a daily timeframe selected showing how priced moved to the targets. This is all based on Robs teachings, but broken down to better grasp how price moves between pivots.
2. 20 different TF to pick from per slot. Timeframes(TF) include: Yearly(Y), Semi-annually(S), Quarterly(Q), Monthly(M), 2-Week(2W), Weekly(W), 3-Day(3D), Daily(D), 12 hour, 8 hour, 6 hour, 4 hour, 3 hour, 2 hour, 1 hour, 30 min, 15 min, 10 min, 5 min. NOTICE: 2W, 3D, 2D, 12h, 8h, 6h, 3h, and 2h don’t have a supported color scheme as I do not personally use them. They are available to pick from in the timeframe selection and you can set a color for these timeframes under the “Unsupported Color Scheme” section in the settings menu for the script if you would like to use them.
3. Show exact price at the pivots. Since drawing lines vs plots doesn’t show the value in the price bar on the right side this setting will show the value of the targets. Image below shows an example of how this looks.
4. Auto-hide timeframes based on specific timeframes selected. For this script, I look for timeframes smaller than the selected timeframe and auto hide these. This applies to all timeframes. For example, in the above Weekly Shooting Star example. If I were to select the monthly timeframe it would hide this timeframe selected so would not show the weekly targets. In the higher timeframes these targets are irrelevant.
IMPORTANT NOTE: One of the lessons I would consider most important in attaining clarity regarding trading, is “TheStrat” by Rob Smith. His lesson on “actionable signals” is something that can be applied to any strategy. For this reason, I am including “MTFT TheStrat Patterns Pro” script in all images that will depict confluence for a better trade selection.
Example using TheStrat Pro MTFT with this indicator.
Look for a “TheStrat actionable signal” or a “TheStrat Reversal signal” on a smaller timeframe that has an instance of this indicator on a larger timeframe calculation that is in range of the candlestick that formed your actionable signal. This means that the indicators plot you are observing must be above the low and below the high of the candlestick that is the actionable signal/reversal signal. Image below shows what this would look like with this indicator.
The Image below shows what this would look like with this indicator. The selected timeframe is the Weekly, it shows an ‘S’ char above which is an indication of a Shooting Star Actionable signal and the low from 4 months ago in range showing some potential resistance. This actionable signal is meant to be played for SHORTS. If the low is breached than you would enter a short. For targets you would look at the previous pivots, for this example all targets were hit. This wont always play out so nice and clean, but given that there is so many stocks and so many signals this is just a thought to improve the quality of the signal as it has extra confluence.
MTFT Last HML wOpen, TheStrat Suite (3of5)Multi Time Frame Tools
Multi Time Frame Tools (MTFT) is a suite of scripts aimed to establish a standard timeframe-based color scheme. This can be utilized to overlay different timeframes calculations/values over a single timeframe. As one example, this would allow to observe the 5-month moving average, 5-week moving average, and 5-day moving average overlaid over each other. This would allow to study a chart, get accustomed to the color scheme and study all these at the same time much easier.
All indicators calculated using the below specific timeframes as input, will always use the color scheme outlined below. This is to get you in habit of recognizing the different timeframes overlaid in top of each other. These can be personalized.
Longer TF analysis.
Yearly - Black
Semi-Annual - Yellow
Quarterly - White
Monthly - Maroon
Weekly - Royal Blue
Daily - Lime
Shorter TF analysis.
4 hour - Fuchsia
1 hour - Orange
30 min - Red
15 min - Brown
10 min - Purple
5 min - Lilac
All color coordination is able to be modified in either the “Inputs” or “Style” section. If you need to make changes, make sure to select “Save as Default” on the bottom right of the settings menu.
Recommended Chart Color Layout
I played around with color coordination a lot. The final product was what worked best for me. I personally use the following chart settings to accent all available TF colors.
-> Click on the settings wheel on your chart. -> Click on “Appearance”.
Background - Solid -> On the top row pick the 6th color from the left.
Vert Grid Lines and Horz Grid Lines -> On the top row pick the 7th color from the left.
You may of course change these and the indicator line colors as you like.
Adding indicator to Chart
-> Open the TradingView “Indicators & Strategies” library, the icon has “ƒx”. -> All premium scripts will be located under “Invite-Only Scripts” -> Click indicator to add to your chart.
MTFT TheStrat Suite (5 Scripts)
Rob Smith is the creator of ‘TheStrat’ trading strategy. For ‘TheStrat’ I have put together a suite of 5 premium scripts that combined will offer people interested in learning ‘TheStrat’ a cleaner learning process. For 2 of the 5 scripts specifically, the MTFT approach of overlaying multiple longer timeframes(TF) over a shorter TF selected as a display cannot be utilized. The other 2 scripts will have full MTFT functionality and they are my personal favorite. I will be providing very basic info to utilize this script; it is up to you to dive deep into learning this strategy. I am not an expert with the tool or a financial advisor. As with all aspects of life, I recommend you research, learn, discern and practice extensively in order to become a master.
1. MTFT Patterns Pro/Noob
2. MTFT Full Time Frame Continuity Table
*3. MTFT Last HML wOpen
4. MTFT Actionable Signal Targets
5. MTFT Reversal Lines
MTFT Last HML wOpen, TheStrat Suite (3of5)
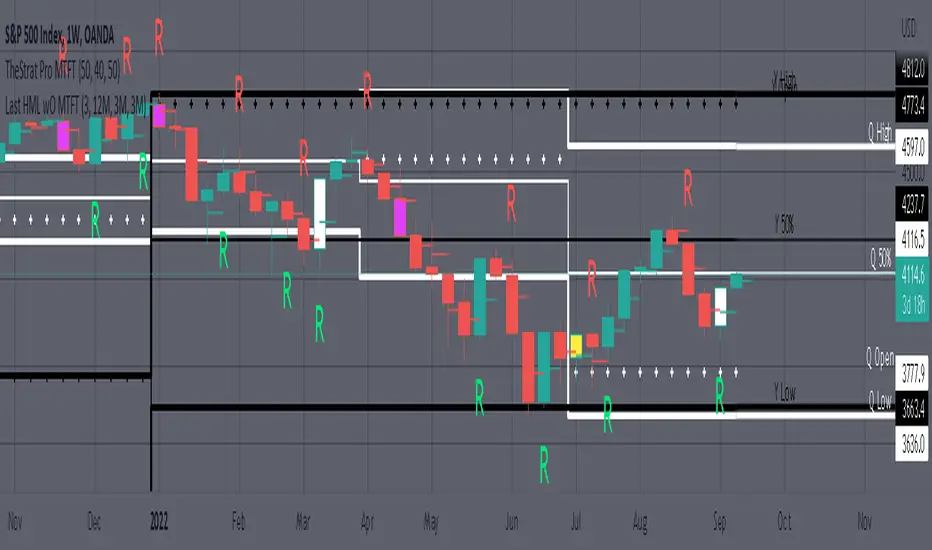
Plots previous High, Mean(50% line), and Low of the previous candlestick and the open for the active TF. This allows you to see how TheStrat Absolute Truths move within the different timeframes. In the image below you see the monthly TF selected. Price on the monthly candlestick has created several reversals up and down.
Now Utilizing this tool, you get to see how priced moved on the daily TF with the previous monthly HML lines plotted(Maroon lines) over the active month so you can see exactly how the absolute truths occur inside each month. Notice the previous High/Low are a thicker width then the Mean, this outlines more clearly which of the lines you are looking at. I’ve included some comments on basic observations.
Now for contrast, below I show you the daily TF selected with the previous quarter HML lines plotted(White lines) over the active quarter.
Script Features includes:
1. Three Timeframes per script instance. Example below shows 3 timeframes in use, Yearly(Black Lines), Quarterly( White Lines), and Monthly (Maroon Lines) on the weekly timeframe candlestick. This is where using a timeframe-based color scheme per individual timeframe will come in very handy. The open of the active timeframe is displayed using the small circles that make a line. The displayed open feature is another way to track full time frame continuity if you are tracking the open of several timeframes. The open of the active timeframe is displayed using the small circles that make a line.
2. 20 different TF to pick from per slot. Timeframes(TF) include: Yearly(Y), Semi-annually(S), Quarterly(Q), Monthly(M), 2-Week(2W), Weekly(W), 3-Day(3D), Daily(D), 12 hour, 8 hour, 6 hour, 4 hour, 3 hour, 2 hour, 1 hour, 30 min, 15 min, 10 min, 5 min. Notice: 2W, 3D, 2D, 12h, 8h, 6h, 3h, and 2h don’t have a supported color scheme as I do not personally use them. They are available to pick from in the timeframe selection and you can set a color for these timeframes under the “Unsupported Color Scheme” section in the settings menu for the script if you would like to use them.
3. Enable/Disable High, Mean, Low or Open on any of the timeframe slots. Custom selection of plots will create clarity in observing timeframe-based analysis. Example below shows the Yearly Open enabled on a Monthly timeframe candlestick selected, along with the 6-month HML lines(This is similar to the quarter, the semi-annual)it shows how the start of the year gave a clear direction several times in the past few years for BTC/USD. A similar analysis can be done across multiple settings. TheStrat Actionable Signals paired with ideas like these can be great setups.
4. Auto-hide timeframes based on specific timeframes selected. For this script, I look for HML lines to have at least 4 total candlesticks within the selected TF. I disable any setting that has 3 or less candlesticks. This applies to all timeframes. This will allow for you to leave several instances of the script in your chart and zoom in and out to see macro/micro levels of a chart. The example below has 2 different instances of the script enabled, first instance (Y, Q, M), and second instance (W, D, 4h). with the Month candlestick selected. Notice how only the Year HML plots are displayed. All other lower timeframes are hidden, this will allow for an easy transition into a lower timeframe analysis.
Same example as above, but now with the Weekly timeframe candlestick selected. Notice that without changing any settings on the scripts the Quarterly (White) and Monthly (Maroon) are now visible.
One more time, this time with the 30m candlestick timeframe selected. Notice that without changing any settings on the scripts the Day(Green) and the 4 hour(Pink) plots appear.
5. Custom Width Selection in script settings per plot type, High, Mean, Low and Open.
IMPORTANT NOTE for TradingView Admin: One of the lessons I would consider most important in attaining clarity regarding trading, is “TheStrat” by Rob Smith. His lesson on “actionable signals” is something that can be applied to any strategy. For this reason, I am including “MTFT TheStrat Patterns Pro” script in all images that will depict confluence for a better trade selection.
Example using TheStrat Pro MTFT with this indicator.
Look for a “TheStrat actionable signal” or a “TheStrat Reversal signal” on a smaller timeframe that has an instance of this indicator on a larger timeframe calculation that is in range of the candlestick that formed your actionable signal. This means that the indicators plot you are observing must be above the low and below the high of the candlestick that is the actionable signal/reversal signal. Image below shows what this would look like with this indicator.
The Image below shows what this would look like with this indicator. The selected timeframe is the Daily, it shows an ‘H’ char below which is an indication of a Hammer Actionable signal and the low from last week is in range showing some potential support. This actionable signal is meant to be played for LONGS. If the high is breached than you would enter a LONG position. For targets you would look at the previous pivots, for this example all targets were hit. This won’t always play out so nice and clean, but given that there is so many stocks and so many signals this is just a thought to improve the quality of the signal as it has extra confluence.
MTFT Full Time Frame Continuity Table TheStrat Suite(2of5)Multi Time Frame Tools
Multi Time Frame Tools (MTFT) is a suite of scripts aimed to establish a standard timeframe-based color scheme. This can be utilized to overlay different timeframes calculations/values over a single timeframe. As one example, this would allow to observe the 5-month moving average, 5-week moving average, and 5-day moving average overlaid over each other. This would allow to study a chart, get accustomed to the color scheme and study all these at the same time much easier.
All indicators calculated using the below specific timeframes as input, will always use the color scheme outlined below. This is to get you in habit of recognizing the different timeframes overlaid in top of each other. These can be personalized.
Longer TF analysis.
Yearly - Black
Semi-Annual - Yellow
Quarterly - White
Monthly - Maroon
Weekly - Royal Blue
Daily - Lime
Shorter TF analysis.
4 hour - Fuchsia
1 hour - Orange
30 min - Red
15 min - Brown
10 min - Purple
5 min - Lilac
All color coordination is able to be modified in either the “Inputs” or “Style” section. If you need to make changes, make sure to select “Save as Default” on the bottom right of the settings menu.
Recommended Chart Color Layout
I played around with color coordination a lot. The final product was what worked best for me. I personally use the following chart settings to accent all available TF colors.
-> Click on the settings wheel on your chart. -> Click on “Appearance”.
Background - Solid -> On the top row pick the 6th color from the left.
Vert Grid Lines and Horz Grid Lines -> On the top row pick the 7th color from the left.
You may of course change these and the indicator line colors as you like.
Adding indicator to Chart
-> Open the TradingView “Indicators & Strategies” library, the icon has “ƒx”. -> All premium scripts will be located under “Invite-Only Scripts” -> Click indicator to add to your chart.
MTFT TheStrat Suite (5 Scripts)
Rob Smith is the creator of ‘TheStrat’ trading strategy. For ‘TheStrat’ I have put together a suite of 5 premium scripts that combined will offer people interested in learning ‘TheStrat’ a cleaner learning process. For 2 of the 5 scripts specifically, the MTFT approach of overlaying multiple longer timeframes(TF) over a shorter TF selected as a display cannot be utilized. The other 2 scripts will have full MTFT functionality and they are my personal favorite. I will be providing very basic info to utilize this script; it is up to you to dive deep into learning this strategy. I am not an expert with the tool or a financial advisor. As with all aspects of life, I recommend you research, learn, discern and practice extensively in order to become a master.
1. MTFT Patterns Pro/Noob
*2. MTFT Full Time Frame Continuity Table
3. MTFT Last HML wOpen
4. MTFT Actionable Signal Targets
5. MTFT Reversal Lines
MTFT Full Time Frame Continuity Table, TheStrat Suite (2of5)
Full timeframe continuity observes what direction different timeframes are pointed at, red or green. This gives you a bias when evaluating a trade. Image below shows 3 instances of the script to outline the max capacity of the script.
Features includes:
1. Four user selected TFs, with 20 different TF to pick from per script instance. Timeframes(TF) include: Yearly(Y), Semi-annually(S), Quarterly(Q), Monthly(M), 2-Week(2W), Weekly(W), 3-Day(3D), Daily(D), 12 hour, 8 hour, 6 hour, 4 hour, 3 hour, 2 hour, 1 hour, 30 min, 15 min, 10 min, 5 min. The first row on the table cell will show the text for the selected timeframe.
2. Color text Green/Red timeframe based on candlestick status for the selected timeframe. Entire Table Cell text will be colored in this color. These can be customized to user preference.
3. Absolute Truth for most recently closed candlestick, plus the active candlestick. This will be displayed in the second row of the table cell. The value inside the brackets ‘ ’ is used for the previous closed candlestick. The value outside the brackets is for the active candlestick.
4. Label pattern if it’s “in force” or not. This only applies for the active candlestick absolute truth value. Note, ‘i’ means the absolute truth is in force. ‘x’ means the absolute truth is not in force.
5. Actionable Signal indication at bottom. If there is an inside candlestick, a hammer or a shooter, the script will display , , and respectively at the bottom on the third row.
6. Auto-hide Lower Timeframes. When the table cell value is smaller than the selected timeframe this timeframe will be hidden. This is done because their will be errors in calculations.
7. Customizable Table Cell Width for use in the different platforms, desktop/mobile. For desktop I use the setting.
IMPORTANT NOTE for TradingView admin: One of the lessons I would consider most important in attaining clarity regarding trading, is “TheStrat” by Rob Smith. His lesson on “actionable signals” is something that can be applied to any strategy. For this reason, I am including “MTFT TheStrat Patterns Pro” script in all images that will depict confluence for a better trade selection.
Example using TheStrat Pro MTFT with this indicator.
Look for a “TheStrat actionable signal” or a “TheStrat Reversal signal” along with this indicator showing several other larger timeframes Red/Green depending on the direction of the actionable signal.
The Image below shows what this would look like with this indicator. The selected candlestick is the Week, it shows a confirmed closed Shooting Star Actionable signal and below the table shows that the Current Week(W), Month(M), Quarter(Q), and Year(Y) are all Red. This actionable signal would be played for SHORTS. If the low is breached than you would enter a short. For targets you would look at the previous pivots, for this example all targets were hit. This wont always play out so nice and clean, but given that there is so many stocks and so many signals this is just a thought to improve the quality of the signal as it has extra confluence.

MTFT Patterns Noob, TheStrat Suite (1of5)Multi Time Frame Tools
Multi Time Frame Tools (MTFT) is a suite of scripts aimed to establish a standard timeframe-based color scheme. This can be utilized to overlay different timeframes calculations/values over a single timeframe. As one example, this would allow to observe the 5-month moving average, 5-week moving average, and 5-day moving average overlaid over each other. This would allow to study a chart, get accustomed to the color scheme and study all these at the same time much easier.
All indicators calculated using the below specific timeframes as input, will always use the color scheme outlined below. This is to get you in habit of recognizing the different timeframes overlaid in top of each other. These can be personalized.
Longer TF analysis.
Yearly - Black
Semi-Annual - Yellow
Quarterly - White
Monthly - Maroon
Weekly - Royal Blue
Daily - Lime
Shorter TF analysis.
4 hour - Fuchsia
1 hour - Orange
30 min - Red
15 min - Brown
10 min - Purple
5 min - Lilac
All color coordination is able to be modified in either the “Inputs” or “Style” section. If you need to make changes, make sure to select “Save as Default” on the bottom right of the settings menu.
Recommended Chart Color Layout
I played around with color coordination a lot. The final product was what worked best for me. I personally use the following chart settings to accent all available TF colors.
-> Click on the settings wheel on your chart. -> Click on “Appearance”.
Background - Solid -> On the top row pick the 6th color from the left.
Vert Grid Lines and Horz Grid Lines -> On the top row pick the 7th color from the left.
You may of course change these and the indicator line colors as you like.
Adding indicator to Chart
-> Open the TradingView “Indicators & Strategies” library, the icon has “ƒx”. -> All premium scripts will be located under “Invite-Only Scripts” -> Click indicator to add to your chart.
MTFT TheStrat Suite (5 Scripts)
Rob Smith is the creator of ‘TheStrat’ trading strategy. For ‘TheStrat’ I have put together a suite of 5 premium scripts that combined will offer people interested in learning ‘TheStrat’ a cleaner learning process. For 2 of the 5 scripts specifically, the MTFT approach of overlaying multiple longer timeframes(TF) over a shorter TF selected as a display cannot be utilized. The other 2 scripts will have full MTFT functionality and they are my personal favorite. I will be providing very basic info to utilize this script; it is up to you to dive deep into learning this strategy. I am not an expert with the tool or a financial advisor. As with all aspects of life, I recommend you research, learn, discern and practice extensively in order to become a master.
*1. MTFT Patterns Pro/Noob
2. MTFT Full Time Frame Continuity Table
3. MTFT Last HML wOpen
4. MTFT Actionable Signal Targets
5. MTFT Reversal Lines
MTFT Patterns Pro/Noob, TheStrat Suite (1of5)
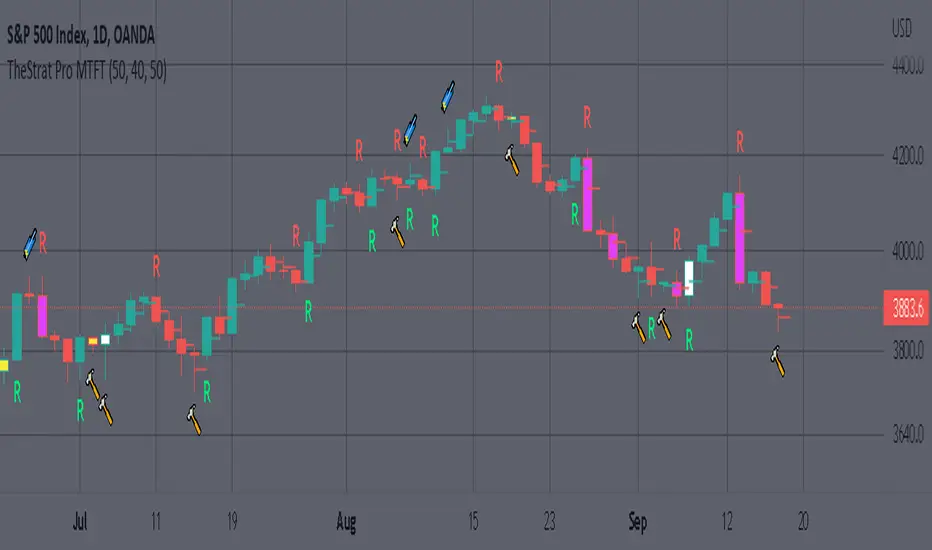
Features includes:
1.) Absolute Truth #. This setting will provide the candlesticks absolute truth # below the CS.
2.) Color bars based on Absolute Truth. This setting will color all inside candlesticks yellow, all Green Outside Candlesticks White and all Red Outside Candlesticks Fuchsia. Scenario 2 candlesticks are left as is and will color based on the color of the original candlestick. This setting is default enabled and needs to be disabled in the “Style” tab under the indicator settings wheel. I found this more practical in getting used to the 3 absolute truth scenarios.
3.) Reversals. This setting will mark when reversal patterns as discussed by Rob are posted. Noob version will also include the description of the reversal pattern, while the Pro version will only plot an ‘R’ without the text description. Note: There should never be back-to-back green Rs or red Rs. I found this issue a lot on many of the other ‘TheStrat’ scripts out there. TradingView development team note: The plotchar function does not allow dynamic text so this is the only reason on why there needs to be two separate versions of the script. ‘Pro’ is important for experienced users that already identify the patterns without the text and ‘Noob’ is important for beginner users that still need the text description of the pattern.
4. Continuations. This setting will mark when continuation patterns as discussed by Rob are posted. Noob version will also include the description of the continuation pattern, while the Pro version will only plot a ‘C’ without the text description.
TradingView Admin note: The plotchar function does not allow dynamic text so this is the only reason why there needs to be two separate versions of the script. ‘Pro’ is important for experienced users that already identify the patterns without the text and ‘Noob’ is important for beginner users that still need the text description of the pattern.
5. Actionable Signals and Complex Actionable Signals (CAS). This has several objective parameters as defined by Rob’s course. ‘Complex Actionable Signals’ is a name I used when speaking of actionable signals that require a combination of 2 or more candlesticks.
Actionable Signals.
• All inside candlesticks(Absolute Truth #1)
• Hammers
• Shooting Stars
Complex Actionable Signals.
• (Absolute Truth Combo 1-3-1 )Inside Outside Inside
• Outside -> Hammer
• Outside -> Shooting Star
• Inside -> Hammer
• Inside -> Shooting Star
• Momentum Inside
• Momentum Hammer
• Momentum Shooting Star
• Hammer -> Shooting Star
• Shooting Star -> Hammer
5a. Example CAS 1-3G-1. I am including only one example of several of the CAS that are included in this script. The star is utilized for all CAS, the color and location designate the direction that the CAS would have you act on. Note the “Entry” and “Target” line were added manually and are not part of the script. This is one successful setup; don’t get excited thinking this is how it always works. I will let you discover and learn for yourself that there is many failed setups and many setups that never trigger the actionable signal. This is where setting alerts is very handy.
6. Alerts. Press on the “Create Alert” Icon for TradingView. When the prompt opens select the preferred script either “TheStrat Pro” or “TheStrat Noob” under “Condition” and then under the sub-menu select any of the following scenarios.
• C ▲/ ▼ = If the active CS shows a continuation up/down pattern, remember this CS is active and can still change direction and trigger a reversal in the other direction.
• R ▲/▼ = If the active CS shows a reversal up/down pattern, remember this CS is active and can still change direction and trigger a continuation in the previous trend direction.
• HM Trigger(Last High Cross) = Alert when the active CS breaks the high of the previous CS. As a new CS opens, it re-adjusts its values and is just constantly waiting for the active CS break through the previous CS high.
• SS Trigger(Last Low Cross) = Alert when the active CS breaks the low of the previous CS. As a new CS opens, it re-adjusts its values and is just constantly waiting for the active CS break through the previous CS low.
• Inside Trigger (Last High/Low Cross) = Alert when the active CS breaks the low or the high of the previous CS. As a new CS opens, it re-adjusts its values and is just constantly waiting for the active CS break through either the previous CS low or the high.
• Last CS Inside
• Last CS H
• Last CS S
• Last CS Actionable Signal (inside, H or S)
• Last CS Complex Actionable Signal
• Last CS Any Actionable Signal

MTFT Patterns Pro, TheStrat Suite (1of5)Multi Time Frame Tools
Multi Time Frame Tools (MTFT) is a suite of scripts aimed to establish a standard timeframe-based color scheme. This can be utilized to overlay different timeframes calculations/values over a single timeframe. As one example, this would allow to observe the 5-month moving average, 5-week moving average, and 5-day moving average overlaid over each other. This would allow to study a chart, get accustomed to the color scheme and study all these at the same time much easier.
All indicators calculated using the below specific timeframes as input, will always use the color scheme outlined below. This is to get you in habit of recognizing the different timeframes overlaid in top of each other. These can be personalized.
Longer TF analysis.
Yearly - Black
Semi-Annual - Yellow
Quarterly - White
Monthly - Maroon
Weekly - Royal Blue
Daily - Lime
Shorter TF analysis.
4 hour - Fuchsia
1 hour - Orange
30 min - Red
15 min - Brown
10 min - Purple
5 min - Lilac
All color coordination is able to be modified in either the “Inputs” or “Style” section. If you need to make changes, make sure to select “Save as Default” on the bottom right of the settings menu.
Recommended Chart Color Layout
I played around with color coordination a lot. The final product was what worked best for me. I personally use the following chart settings to accent all available TF colors.
-> Click on the settings wheel on your chart. -> Click on “Appearance”.
Background - Solid -> On the top row pick the 6th color from the left.
Vert Grid Lines and Horz Grid Lines -> On the top row pick the 7th color from the left.
You may of course change these and the indicator line colors as you like.
Adding indicator to Chart
-> Open the TradingView “Indicators & Strategies” library, the icon has “ƒx”. -> All premium scripts will be located under “Invite-Only Scripts” -> Click indicator to add to your chart.
MTFT TheStrat Suite (5 Scripts)
Rob Smith is the creator of ‘TheStrat’ trading strategy. For ‘TheStrat’ I have put together a suite of 5 premium scripts that combined will offer people interested in learning ‘TheStrat’ a cleaner learning process. For 2 of the 5 scripts specifically, the MTFT approach of overlaying multiple longer timeframes(TF) over a shorter TF selected as a display cannot be utilized. The other 2 scripts will have full MTFT functionality and they are my personal favorite. I will be providing very basic info to utilize this script; it is up to you to dive deep into learning this strategy. I am not an expert with the tool or a financial advisor. As with all aspects of life, I recommend you research, learn, discern and practice extensively in order to become a master.
*1. MTFT Patterns Pro/Noob
2. MTFT Full Time Frame Continuity Table
3. MTFT Last HML wOpen
4. MTFT Actionable Signal Targets
5. MTFT Reversal Lines
MTFT Patterns Pro/Noob, TheStrat Suite (1of5)
Features includes:
1.) Absolute Truth #. This setting will provide the candlesticks absolute truth # below the CS.
2.) Color bars based on Absolute Truth. This setting will color all inside candlesticks yellow, all Green Outside Candlesticks White and all Red Outside Candlesticks Fuchsia. Scenario 2 candlesticks are left as is and will color based on the color of the original candlestick. This setting is default enabled and needs to be disabled in the “Style” tab under the indicator settings wheel. I found this more practical in getting used to the 3 absolute truth scenarios.
3.) Reversals. This setting will mark when reversal patterns as discussed by Rob are posted. Noob version will also include the description of the reversal pattern, while the Pro version will only plot an ‘R’ without the text description. Note: There should never be back-to-back green Rs or red Rs. I found this issue a lot on many of the other ‘TheStrat’ scripts out there. TradingView development team note: The plotchar function does not allow dynamic text so this is the only reason on why there needs to be two separate versions of the script. ‘Pro’ is important for experienced users that already identify the patterns without the text and ‘Noob’ is important for beginner users that still need the text description of the pattern.
4. Continuations. This setting will mark when continuation patterns as discussed by Rob are posted. Noob version will also include the description of the continuation pattern, while the Pro version will only plot a ‘C’ without the text description.
TradingView Admin note: The plotchar function does not allow dynamic text so this is the only reason why there needs to be two separate versions of the script. ‘Pro’ is important for experienced users that already identify the patterns without the text and ‘Noob’ is important for beginner users that still need the text description of the pattern.
5. Actionable Signals and Complex Actionable Signals (CAS). This has several objective parameters as defined by Rob’s course. ‘Complex Actionable Signals’ is a name I used when speaking of actionable signals that require a combination of 2 or more candlesticks.
Actionable Signals.
• All inside candlesticks(Absolute Truth #1)
• Hammers
• Shooting Stars
Complex Actionable Signals.
• (Absolute Truth Combo 1-3-1 )Inside Outside Inside
• Outside -> Hammer
• Outside -> Shooting Star
• Inside -> Hammer
• Inside -> Shooting Star
• Momentum Inside
• Momentum Hammer
• Momentum Shooting Star
• Hammer -> Shooting Star
• Shooting Star -> Hammer
5a. Example CAS 1-3G-1. I am including only one example of several of the CAS that are included in this script. The star is utilized for all CAS, the color and location designate the direction that the CAS would have you act on. Note the “Entry” and “Target” line were added manually and are not part of the script. This is one successful setup; don’t get excited thinking this is how it always works. I will let you discover and learn for yourself that there is many failed setups and many setups that never trigger the actionable signal. This is where setting alerts is very handy.
6. Alerts. Press on the “Create Alert” Icon for TradingView. When the prompt opens select the preferred script either “TheStrat Pro” or “TheStrat Noob” under “Condition” and then under the sub-menu select any of the following scenarios.
• C ▲/ ▼ = If the active CS shows a continuation up/down pattern, remember this CS is active and can still change direction and trigger a reversal in the other direction.
• R ▲/▼ = If the active CS shows a reversal up/down pattern, remember this CS is active and can still change direction and trigger a continuation in the previous trend direction.
• HM Trigger(Last High Cross) = Alert when the active CS breaks the high of the previous CS. As a new CS opens, it re-adjusts its values and is just constantly waiting for the active CS break through the previous CS high.
• SS Trigger(Last Low Cross) = Alert when the active CS breaks the low of the previous CS. As a new CS opens, it re-adjusts its values and is just constantly waiting for the active CS break through the previous CS low.
• Inside Trigger (Last High/Low Cross) = Alert when the active CS breaks the low or the high of the previous CS. As a new CS opens, it re-adjusts its values and is just constantly waiting for the active CS break through either the previous CS low or the high.
• Last CS Inside
• Last CS H
• Last CS S
• Last CS Actionable Signal (inside, H or S)
• Last CS Complex Actionable Signal
• Last CS Any Actionable Signal
The $trat | by Octopu$1️⃣2️⃣3️⃣ The $trat | by Octopu$
The $trat: The Strat by Octopu$
Absolute Solution for The Strat Traders!
The Strat is a Strategy created by Rob Smith's and is well known by being an innovative trading system.
Continues to grow in popularity as more traders discover this method.
It is a simplified way to understand Price Action. It is based on three principles: Types of candles, 1, 2, and 3.
Other things to be known about The Strat are Actionable Signals and Time Frame Continuity.
The $trat has it all.
This Indicator includes Bar Types (1, 2 and 3) also known as Inside Bars, Twos (Up or Down) and Outside Bars.
It is also well crafted with a built-in Time Frame Continuity (TFC) which shows Price Movement at a glimpse.
On top of that, in the best of both worlds, also comes with information about the Bars Status for other TFs as well.
It means that you can know how another TF of you preference is performing. Right there.
Works in Any Time Frame.
On Any Ticker.
(Using SPY 5m just as an example:)
www.tradingview.com
SPY
Features:
• Candle Types (1, 2 and 3) IB, 2U & 2D and OB.
• Time Frame Continuity (TFC) for Price Movement/Trend Check
• Bar Status shortcut. So you can know Price Action/Direction fast.
• Reversal indicators for Action-taking and Situational Awareness
• Combos Labels. So nothing ever goes unnoticed.
Options:
• Absolutely fully Customizable: Colors, Sizes, Numbers. Everything.
• On/Off Switches for most of the Information and Optionable Selections
• Hammer/Shooter Indicator automatically inserted to Chart
• Candle/Bars Coloring for ease of reading.
• Highlight options for specific setups
Notes:
v1.0
$trat Indicator release
Changes and updates can come in the future for additional functionalities or per requests.
Did you like it? Boost it. Shoot a message! I'd appreciate if you dropped by to say thanks.
- Octopu$
🐙

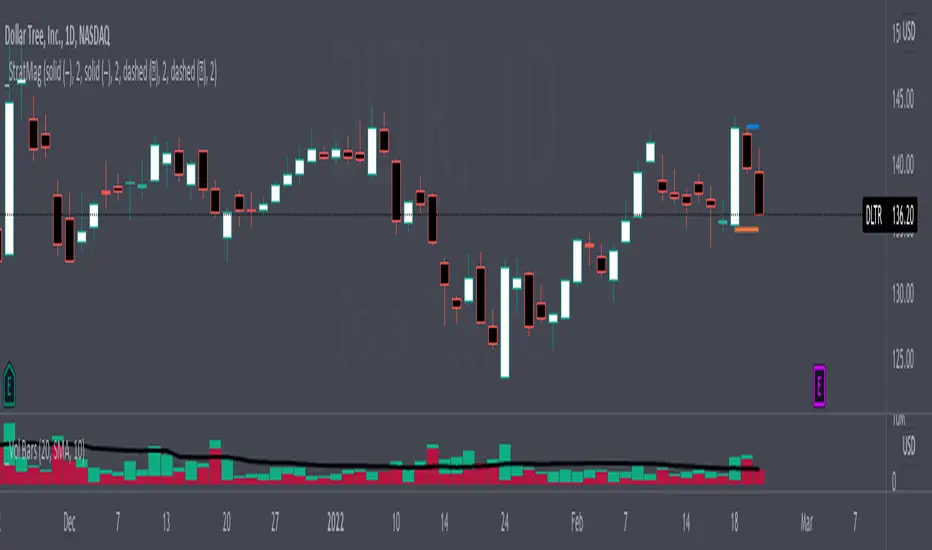
SSS50 StatusSSS50 Status Box with Auto Chart Levels and Labels
I made this indicator due to receiving a lot of messages on how to use my other SSS50% indicators. This indicator helps you learn and understand the Sara Strat Snipers 50 Percent Rule. Remember this indicator does not tell you when to buy or sell this is a guide on the setup ONLY.
You Must Use Rob Smith's The Strat Principles and Remember we need TIME in our favour. Ideally we want to see setups go In-Force early on during the candles lifespan (Timeframe).
Using the indicator logic, the SSS50% Rule has FOUR Conditions:
1. SSS50 INVALID = No Trade = The Candle is currently an Inside Bar OR a Green 2UP OR a Red 2DOWN.
2. SSS50 STANDBY = Failed 2* = The Candle is currently a Failed 2UP (Red 2UP) OR a Failed 2DOWN (Green 2DOWN).
3. SSS50 ACTIVE = Outside Bar Possible = The Candle is currently a Failed 2 and has crossed over the Previous Candles 50% level.
4. SSS50 COMPLETE = Outside Bar Complete = The Candle is now an Outside Bar.
How to Use this Indicator?
Add Indicator to your chart and open up the Indicator's Settings.
1. Select Indicators Timeframe.
- Chart = SSS50% rules will be applied to whichever timeframe chart you open.
- Single Timeframe = SSS50% rules will be only applied to one fixed timeframe when viewing on other timeframe charts. For Example: if you select Weekly. The Indicator's Status and Levels/Labels will only be displayed on your chart if the Weekly Candle has a SSS50 Standby, Active or Complete condition.
2. Select Status Box On/Off. If ON - Select View Type.
- Normal View = Detailed View with Price Targets.
- Compact View = Condensed View to reduce chart clutter.
3. Select AUTO or MANUAL Chart Levels/Labels. Select ONE type only or leave both off for no level/label display.
- AUTO = When an SSS50 STANDBY, ACTIVE or COMPLETE Condition occurs the related High, Low and 50% Levels will be displayed.
- MANUAL = When AUTO is OFF, MANUAL will display High, Low and 50% Levels always regardless of SSS50 Conditions.
4. Select AUTO Features.
- Display High/Low and/or 50% Price Labels when using AUTO Chart Mode.
4.1 Select AUTO Colors if required. Default to Traffic Light System.
- INVALID = Red
- STANDBY = Orange
- ACTIVE or COMPLETE = GREEN
5. Select MANUAL Features if AUTO Chart Mode is OFF.
- Display High/Low and/or 50% Price Labels when using MANUAL Chart Mode.
5.1 Select MANUAL Colors if required.
6. Additional Features. Title OR Timeframe available is Normal View. Title AND Timeframe BOTH available in Compact View.
- Show SSS50 Title next to Status Box.
- Show the indicators selected Timeframe next to Status Box. Timeframe will be displayed next to Status Box Only when ONE Individual Timeframe is selected.
7. Color Settings.
- Match your chart's current Background Color to this color.
8. Additional Settings
- Customise Label Offset Locations, Line Types and Line Types.
- Any issues let me know.
- Note I removed the price tags (used in my previous SSS50 indicators) from the right of the line to avoid clutter. Now you can see the current price move through the High, Low and 50% level lines.
- No alerts setup within script, just manually click the plus sign on each level if you wish to add alerts.

[BM] HTF Candle Evolution█ OVERVIEW
This script shows how a higher timeframe candle evolves over time.
It was created as a visual aid to #TheStrat and provides a new way of looking at Timeframe Continuity.
█ FEATURES
General
HTF: Higher Timeframe selection with dropdown and ability to manually input a timeframe that is not present in the dropdown.
Label: Show a label with the selected higher timeframe.
Marker: Shows a marker symbol at the start of each new higher timeframe.
Align: Aligns the candles around a selected center line.
The Strat
Multi-timeframe analysis is used extensively in #TheStrat (created by Rob Smith), so the ability to add #TheStrat coloring has been made available.
Scenario: Define the colors for the strat scenario's.
Coloring of: Choose which part of the candles you want the selected strat scenario colors to be applied to.
Band: Display a band that shows the active strat scenario color of the selected higher timeframe.
All features are completely customizable.

Honest Algo PremiumThis toolkit is a collection of innovative indicators, carefully designed to be as user friendly as possible. Get access to a collection of all the best we can offer in one indicator.
Providing Multiple Trading Styles
Our toolkit works in any market but has been specifically designed for Bitcoin and Forex.
Detect the direction of the trend using an algorithm based on our bounce manager ATR consolidation filtering
Find bounces from a handful of different pre-determined lines, the include a 20 period EMA, a supertrend, a T3 moving average and kijun-sen
Detect Rob Smith #thestrat entries
Filter out noise with our environment filters
and much more. (Check the changelog below for future additions)
If you want more information on how the price action entries of Rob Smith #thestrat work, there are many tutorials on the internet.
When using Rob Smith #thestrat entries the indicator uses bounce manager with a 200 period EMA for trend based bar coloring.
A quick explanation how it finds bounces from these lines:
Filter signals based on timeframe continuity
Timeframe continuity is a method of market analysis where you look if multiple different timeframe charts are in the same direction.
For example:
default settings we are in bull territory when the yearly, the quarterly, the monthly and the weekly candle all are green.
default settings we are in bear territory when the yearly, the quarterly, the monthly and the weekly candle all are red.
We provided multiple presets but it is recommended to use the standard preset, timeframe continuity is the strongest when using higher timeframes.
Filter signals based on market environment
We realised that trading long or short in an environment with no resistances increased our algorithms success rate.
How the algorithm does this:
1: See which timeframes the user has selected as a filter, on default these are:
Needs to be outside timeframe 1 (yearly), false
Needs to be outside timeframe 2 (quarterly), false
Needs to be outside timeframe 3 (monthly), true
2: Check if our closing price is above those timeframes previous candle high or below previous candle low.
This in combination with timeframe continuity gives a great tool to find the sentiment of the market and trade in the direction of the market.
Turn on autopilot using our signals
This tool is not made to do all decisions for you and requires a manager (you). The basic strategy using the #thestrat preset is to scale into positions on the 4H or higher timeframe, whenever a signal is fired you add to your position and as trend keeps developing the tool will keep adding to your positions.
A good manager knows risk management and does not use a very large position size per entry and builds a position over time.
We recommend you use a timeframe of 4H or higher and diversify over multiple assets. The indicator works best on assets that overtime have created long lasting trends.
Examples of perfect coins to use this on.
We know traders love clean looking charts
This is wy we added some popular indicators to our toolkit, these you can find on tradingview for free but we added them into our toolkit using our color theme, you can find these in the settings under (extra tools).
We also added an option to display bounce source, this is the source line some of our signal presets use to find bounces from using preset bounce manager parameter.

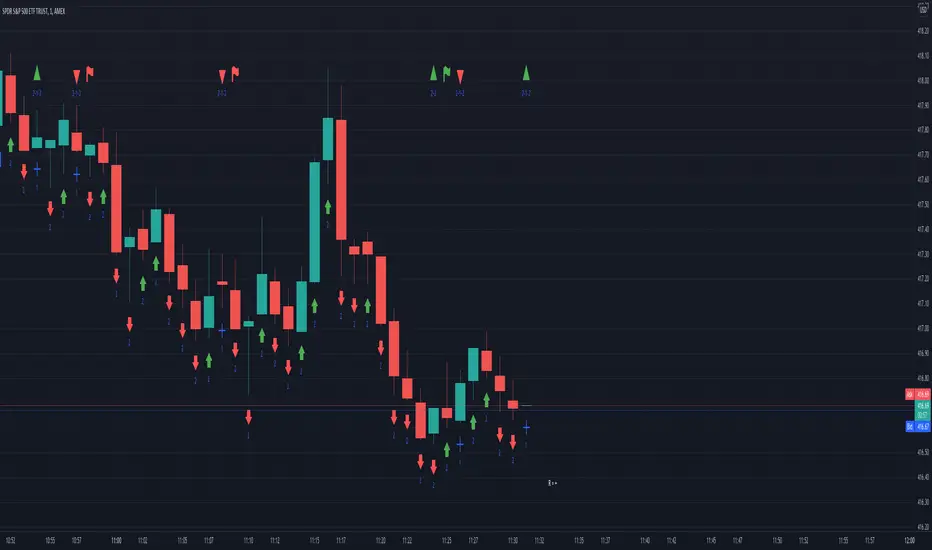
TheStrat Reversal IndicatorThis indicator shows TheStrat 2-2 and 2-1-2 reversal setups.
2-2 Setups: Identifies specific 2-2 reversal setups. Long 2-2 reversals are shown when there is a 2d-2d-2d green candle sequence. Short 2-2 reversals are shown when there is a 2u-2u-2u red candle sequence. Setups are marked with "2-2" and a green up triangle for long setups or a red down triangle for short setups.
2-1-2 Setups: Identifies any 2-1-2 reversal setup. Setups are marked with "2-1-2" and a green up triangle for long setups or a red down triangle for short setups.
Both setups will then show a flag indicator on the next live candle if they actually trigger.
An alert can be set that will trigger on any live setup. This alert will trigger as soon as the setup candle shows, and will not wait till that setup candle closes. This is to allow you to watch the setup complete live and then watch the trigger condition live as well. Alerts must be set for each time frame you wish to alert on.
All candles are marked with labels underneath to identify the candle type.
When there is a live setup forming there is also a R-multiple calculation shown to the right of the current candle. This R-multiple is calculated from the setup candle's high or low to the 1st target previous candle.
This indicator works on any time frame.
Previous High/Low LevelsPrevious High/Low Levels
Select 5 Custom Timeframes to display the previous High and Low levels on your chart.
NOTE: For Levels to work correctly and for price labels to be displayed, Right-click chart background -> select Settings -> select Scales -> tick “Indicator Last Value Label".
Once indicator has been added open settings and select timeframe, color, labels, offset parameters and line style as desired then SAVE.
Handy when using The Strat.

Tweak Strat FTFCThis script allows traders to view timeframe continuity on 7 timeframes at the top of the chart.
The trader selects 7 different timeframes, and the script will reflect whether the current candle for each timeframe is bullish or bearish (current price > the open OR current price < the open).
If a timeframe is currently bearish, the box will be purple.
If a timeframe is currently bullish, the box will be orange.
A circle in the middle of the box indicates that that timeframe is currently an inside bar (1).
An upward arrow indicates that that timeframe is currently a directional up bar (2u).
A downward arrow indicates that that timeframe is currently a directional down bar (2d).
A rectangle indicates that that timeframe is currently an outside bar (3).
NOTE: The color of the boxes is fixed. Traders MUST select a timeframe for EACH OF THE 7 FIELDS.
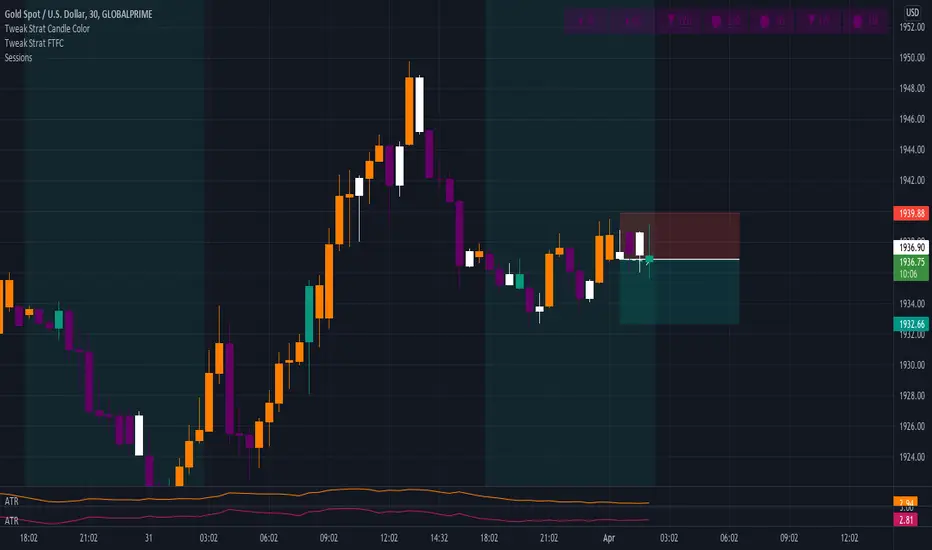
Tweak Strat Candle ColorThis script allows traders to customize candlestick colors based on The Strat trading system developed by Rob Smith.
The script determines if the current candle is an inside bar (1), outside bar (3), directional up (2u) , or directional down (2d).
An inside bar is a candle that trades fully within the previous candle.
An outside bar breaks both the high and the low of the previous candle.
A directional up bar breaks the high of the previous candle but NOT the low of the previous candle.
A directional down bar breaks the low of the previous candle but NOT the high of the previous candle.
The trader can modify the colors they wish to use in the settings menu.
NOTE: You must select "Visual order - Bring to front"
If you do not, the custom colors will disappear when you click the chart window.

Strat Magnitude LinesHave you ever wished you could easily see the daily magnitude line of a Strat Combo while on a smaller timeframe intraday chart? This indicator allows you to do that and much more!
Description
This indicator does two simple things, but it does them very well. The first thing it does is draw a small horizontal line at the magnitude level of a Strat Setup (a potential Strat Combo before the last candle has formed) on the daily chart. This is intended to help the user easy ascertain how much magnitude distance (distance between trigger line and magnitude line) of a potential Strat Combo the night before when the user is searching for trades to play the next trading day. If the last two candles on a daily chart form the first two bars of a Strat Combo, then this indicator display a horizontal line where the ultimate magnitude would be if the next trading day a Strat Combo was formed. This helps the trader gauge whether there is sufficient magnitude that makes it worth it to even consider trading the next day.
The second and most important thing this indicator does is display the daily magnitude line while the user is in a smaller timeframe managing their trade. This helps the user have an easily identifiable line to show where to take full or partial profit at. There is no need to keep track of manually drawn lines or the hassle of letting your charts get cluttered with lines that the user forgot to delete. This indicator finds potential Strat Combos (aka Strat Setups) and dynamically draws horizontal lines for the user and removes them when they are no longer in use. The user can focus on taking profit and making money and leave the hassle to the indicator.
Inputs & Style
All four lines (two daily lines and two intraday lines) can be independently configured. Each lines color, line style, and width can be adjusted. To turn “off” a line change the opacity to 0%.
Automatic daily magnitude line on intraday chart