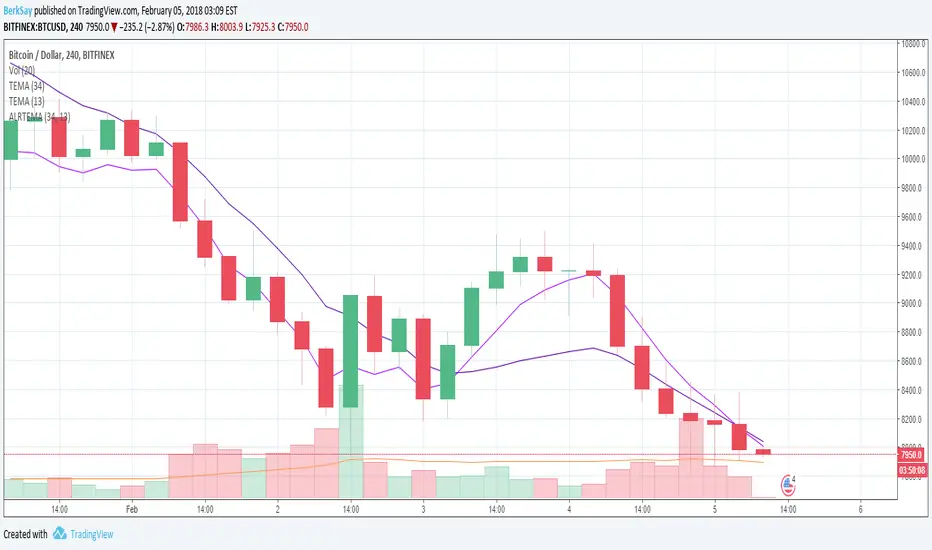
Ultimate Moving Average StrategyConverted famous indicator CM_Ultimate_MA_MTF to strategy.
Works well only at big timeframes from 8H and with stop-losses.
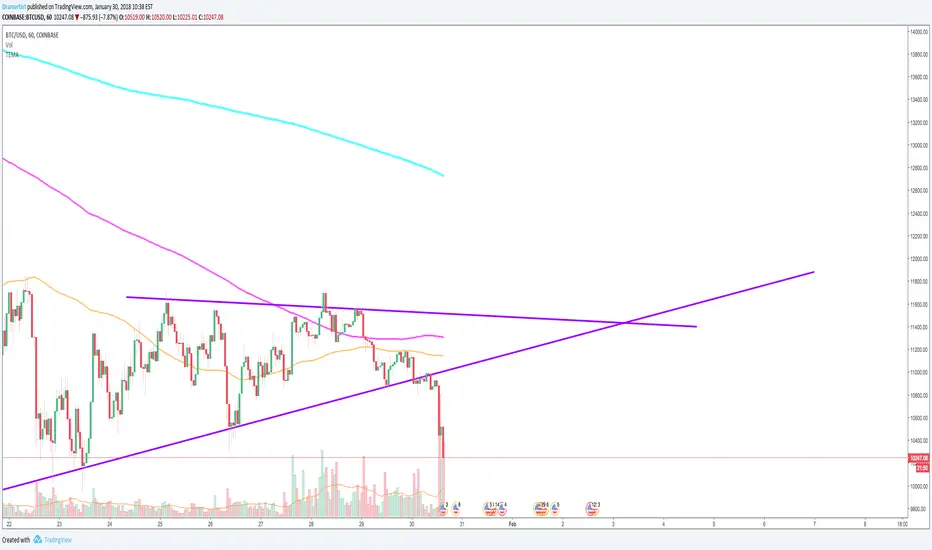
Üçlü Üstel Hareketli Ortalama (TEMA)

TEMA - Triple Moving Averages (17,72,200)Triple Moving Average to analyse short, medium and long terms.
3_TEMAThis codes shows three triple exponential moving average (50, 100, 200) in one single indicator

Customizable MACDCustomizable MACD - let's tune! This approach let you specify not only lengths and price source but also a type of used movings for the fast, slow and signal lines.
Here is the list of all available movings:
ALMA (Arnaud Legoux)
ARSI (Adaptive RSI)
DEMA (Double Exponential)
EMA (Exponential)
FRAMA ( Fractal Adaptive)
HMA (Hull)
LSQMA (Least Squares)
LWMA (Linear Weighted)
MD (McGinley Dynamic)
REMA (Regularized Exponential)
RMA (EMA with alpha = length - 1)
SMA (Simple)
SMMA (Smoothed)
TEMA (Triple Exponential)
TMA (Triangular)
T3
VIDYA (Variable Index Dynamic)
VWMA ( Volume Weighted)
WMA (Weighted)
WWMA (Welles Wilder’s Moving Average, EMA with alpha = 1 / length)
ZLEMA (Zero Lag Exponential)

Customizable Multiple Moving AveragesCustomizable Multiple Moving Averages - more than twenty movings available in one script!
Besides source/period customization you can specify one of the following moving averages for every plot:
ALMA (Arnaud Legoux)
ARSI (Adaptive RSI)
DEMA (Double Exponential)
EMA (Exponential)
FRAMA (Fractal Adaptive)
HMA (Hull)
LSQMA (Least Squares)
LWMA (Linear Weighted)
MD (McGinley Dynamic)
REMA (Regularized Exponential)
RMA (EMA with alpha = length - 1)
SMA (Simple)
SMMA (Smoothed)
TEMA (Triple Exponential)
TMA (Triangular)
T3
VIDYA (Variable Index Dynamic)
VWMA (Volume Weighted)
WMA (Weighted)
WWMA (Welles Wilder’s Moving Average, EMA with alpha = 1 / length)
ZLEMA (Zero Lag Exponential)

TEMA/hullMA Ribbon with Bollinger BandsDesigned for shorted time frames.
Bollinger bands based off of TEMA as source.
Ribbon based off TEMA and hullMA divergence.
RMA used to signal Bollinger bands.
Ribbon:
pinch -> reversal
blue -> sign of possible uptrend
red -> sign of possible downtrend
Bollinger bands background:
blue -> sign of continuing uptrend
red -> sign of continuing downtrend

Viperz Super EMA Mix v2.0Hello friends,
Welcome to Viperz Super EMA Mix v2.0!!!
v2.0: Added TEMA source as an input, so the default value can be changed. I also Added a full description of Viperz Super EMA Mix below.
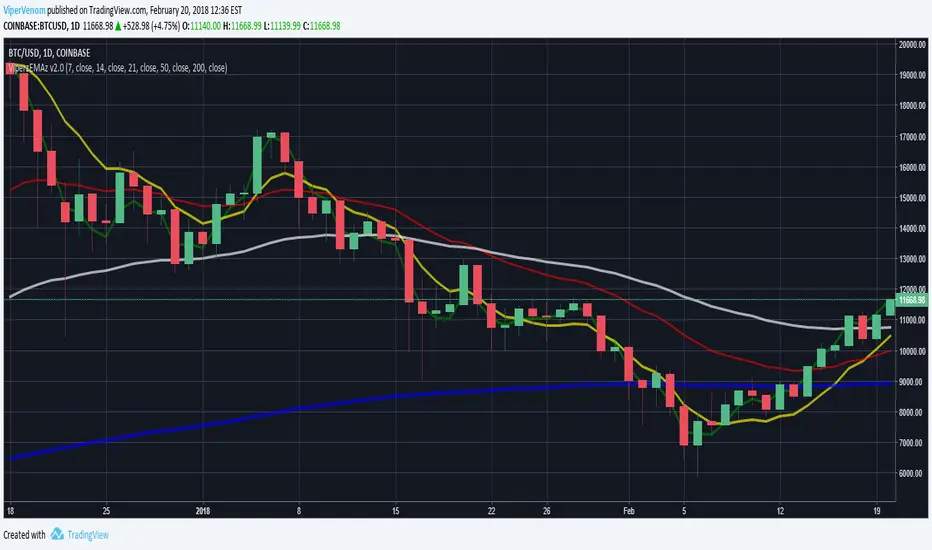
I have created a multi-layered Exponential Moving Average chart indicator, called Viperz Super EMA Mix. This is used to measure momentum of market trends. I had Bitcoin/Crypto trading in mind while creating it. Here is a breakdown of the different moving averages included, their default values and the reasoning behind why they were chosen.
First, we have the most reactive EMA, which is a Triple EMA, or TEMA. The TEMA smooths price fluctuations and filters out more volatility than a traditional EMA. Therefore, I have chosen that as the green line which will be nearest to the current price. I used TEMA here, so it will help filter out some of the noise on the most reactive EMA on this indicator. I have chosen 7 as the default for length, since that is a week. I chose the color green because I am using a stop light theme to make it easy for myself, and hopefully, for others to remember. All you have to remember for color order is Green > Yellow > Red. If the green is above yellow and yellow is above red lines, then current trend is bullish.
Secondly, we have the next most reactive EMA, which is a Double EMA, or DEMA. The DEMA is a fast-acting moving average that is more responsive to market changes than a traditional moving average. The TEMA and DEMA will react with each other the most on the charts, since their default values are nearest each other and use smaller lengths. I chose them to be the first 2 EMAs, in a "reverse order", so that the noise filtering is done slightly more on the shorter EMAs with more volatility. I chose 14 as default on the DEMA, since that is 2 weeks. I choose the color yellow to stick with my stop light theme (green better then yellow better than red).
Third, we have a less reactive regular EMA, set at length 21. This represents 3 weeks and uses the color red. If green and yellow are below the red lines, then the trend is bearish.
Lastly, I included the 50 day and 200 day EMAs, because they very commonly used for Bitcoin trading. I could try to explain it, but they do a better job of explaining why 50 and 200 day EMAs are used if you check this article here: cointelegraph.com
The color chosen for the 50 day was white and 200 day was blue. This is also so it's easy for me to remember (America, red, white and blue). Here is the full color scheme order: Green, Yellow, Red, White, Blue.
*** Just remember traffic lights first on smaller time frames (1 - 4 Hour time frames) and American flag for larger time frames (Daily to Weekly time frames) and you'll be recognizing the color scheme easily at a glance in no time!
If you don't agree on any of the default values I have chosen, then I have made it so you can change the length or source input values to anything you want for each moving average. You can also adjust the coloring and size of the EMA's bands.
If you find different default values that you like and you want me to make a special version for you, please send me a personal message. I appreciate the likes and follows. :)
TLDR: This should be used as a momentum indicator while market trading. The easiest way to remember how to recognize the market trend using my color scheme is to think of a stop light. Green, yellow, then red. The last are red, white and blue, like the American flag. If the order of the colors is green, yellow, red, white, blue, then the market is strongly trending bullish. It is opposite for bearish trend. Traffic lights (green/yellow/red) work the best on smaller time frames (Hourlys) and American flag (red/white/blue) for larger time frames (daily-weekly). All default input values and sources can be changed for each EMA.
Thank you, enjoy!
GR-Multiple Moving AveragesA simple indicator that contains all the main Moving Averages you'll probably need.
This indicator can be used on any time frame you wish.
The default periods for the moving averages are 5, 10, 20, 50, 100 & 200.
However you can set these values to whatever works for you, for example 5, 8, 10, 21, etc.
Please let me know in the comments below which values you use the most, so that I can adjust the defaults accordingly.
The lines get darker and thinker the more periods the MA covers.
You can easily adjust the colours of the lines and their thickness too.
The current colours seem to work OK on both the light and dark TradingView themes, but please do make suggestions for better default value.
You can also choose between 7 different ways of calculating the moving averages:
!None = You don't want to see this line
SMA ( Simple Moving Average )
EMA ( Exponential Moving Average )
WMA ( Weighted Moving Average )
DEMA ( Double Exponential Moving Average )
TEMA (Triple Moving Average
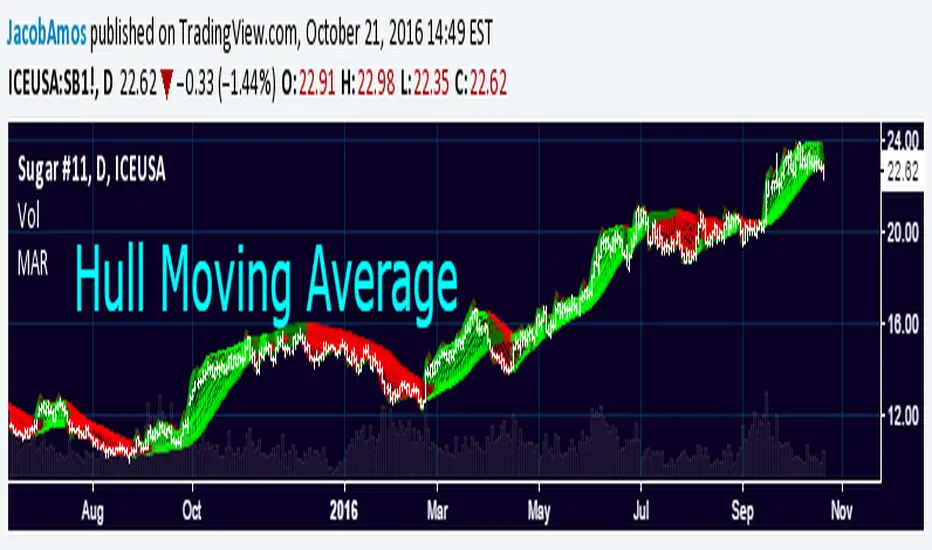
HMA ( Hull Moving Average )
Comments and suggestions are most welcome.
I'm available for hire to create custom indicators or to work on more complex projects.

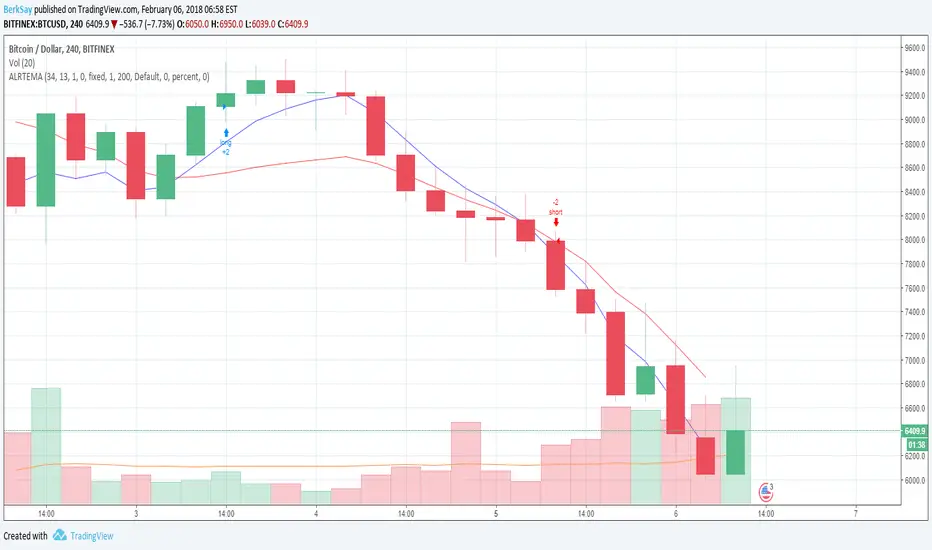
Stratergy CM_Ultimate_MA_MTFThis is the script for the idea published by @ChrisMoody
Below is the link to the idea
()
Try the scripts for longer periods (e.g. 1 D).
The script still requires some tweaks as one of the issue is that the shorts and puts are being placed 2 candles after a confirmation is there. So use this strategy at your own risk.
Any inputs will really be helpful.
(Also thanks to @ChrisMoody for such a good indicator).


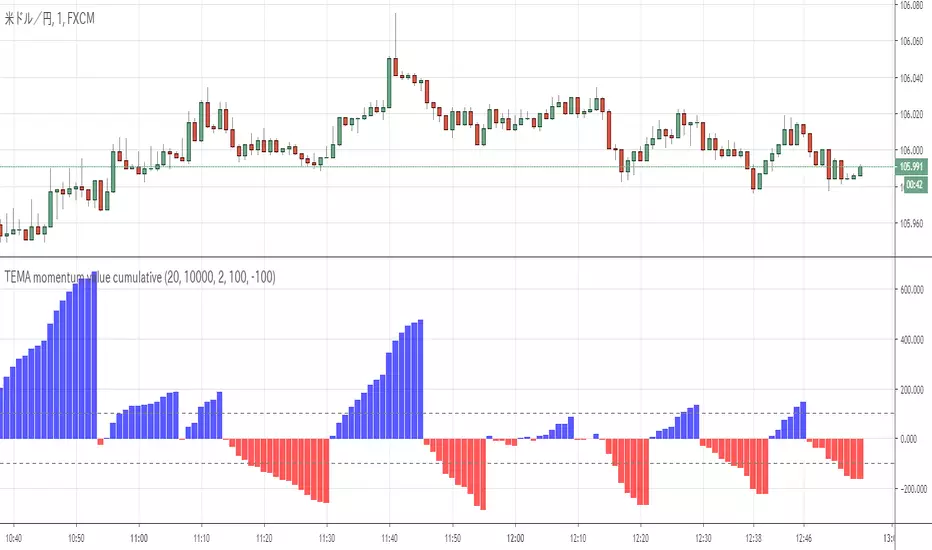
TEMA momentum value cumulativeTEMA momentum value cumulative
This indicator is show trend strong and change trend.
MT4 backtest EURUSD H1/M15 (japanese article)
mt4program.blogspot.jp
mt4program.blogspot.jp
mt4program.blogspot.jp
Moving Average RibbonThis is an extension of the Madrid Moving Average Ribbon public script to allow for different kinds of moving averages (the original allows only exponential and simple). Possible entries in the MA Type argument field are:
sma (simple moving average)
ema (exponential moving average)
wma (weighted moving average)
trima (triangular moving average)
zlema (zero-lag exponential moving average)
dema (double exponential moving average)
tema (triple exponential moving average)
hma (hull moving average)
If the argument given by the user does not match anything from the above list, it will default to ema.
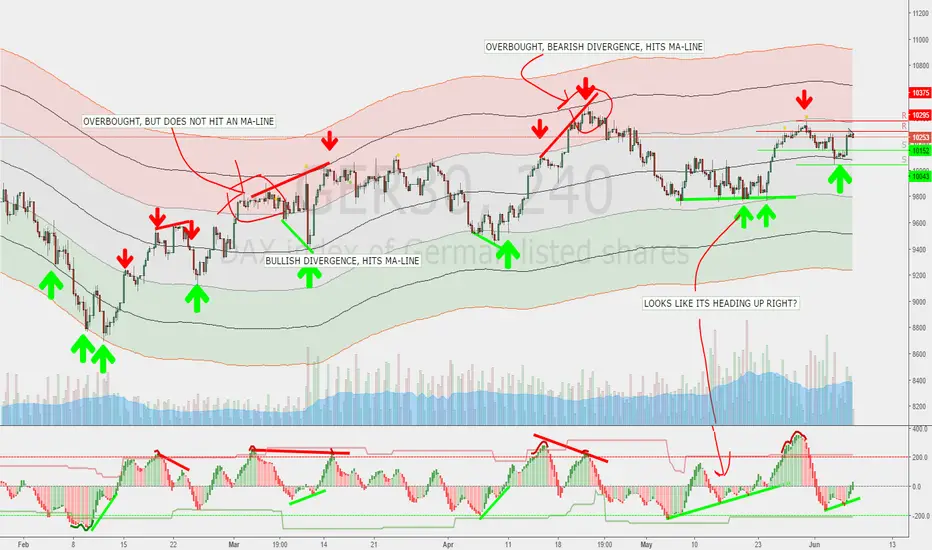
Yacine MA Bands ModMashed together the ema-bands from IvanLabrie with some moving average script stuff from ChrisMoody and LazyBear and this is the result. Credit goes to them, 'cause I don't know to how to code tbh. Just copy/pasted stuff untill I got the result I wanted.
Bands work as support/resistance among other things. You can use them to trade breakouts or reversals or whatever.
Combining them with a momentum indicator would probably be useful for timing divergence or OB/OS and stuff like that.
Included moving average types;
SMA
EMA
RMA
WMA
VWMA
HullMA
TilsonMA
TEMA
Not sure if all of them works as they should... y'know since I cant code/script. Looks good to me though.¨
Default should work pretty good for the DAX, But you'll probably want to fiddle a bit with the settings.
Here's a pic of how they can be used. Ofc everything looks simple in hindsight, but you get the point.
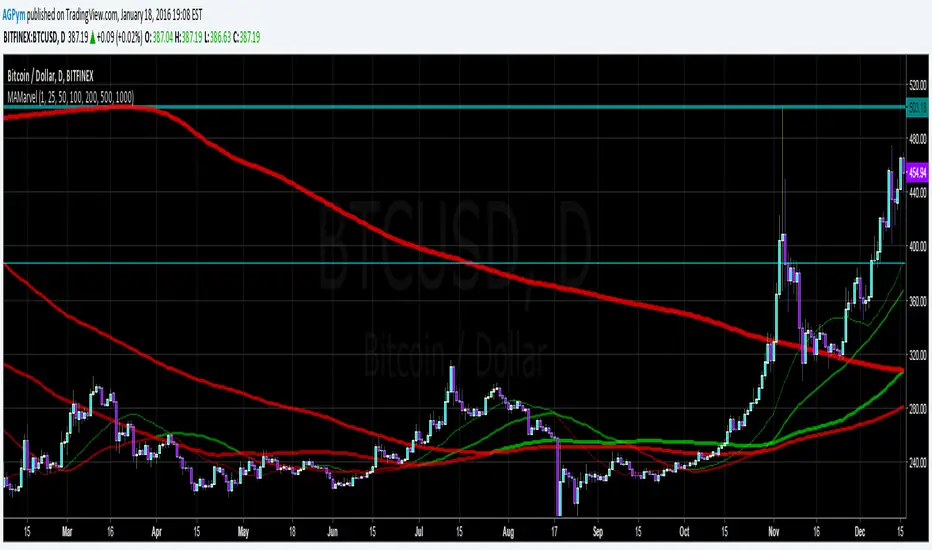
MA Marvel - MultiMA by AGPymMulti-Moving Average in a single color changing indicator. Lines change color when they cross.
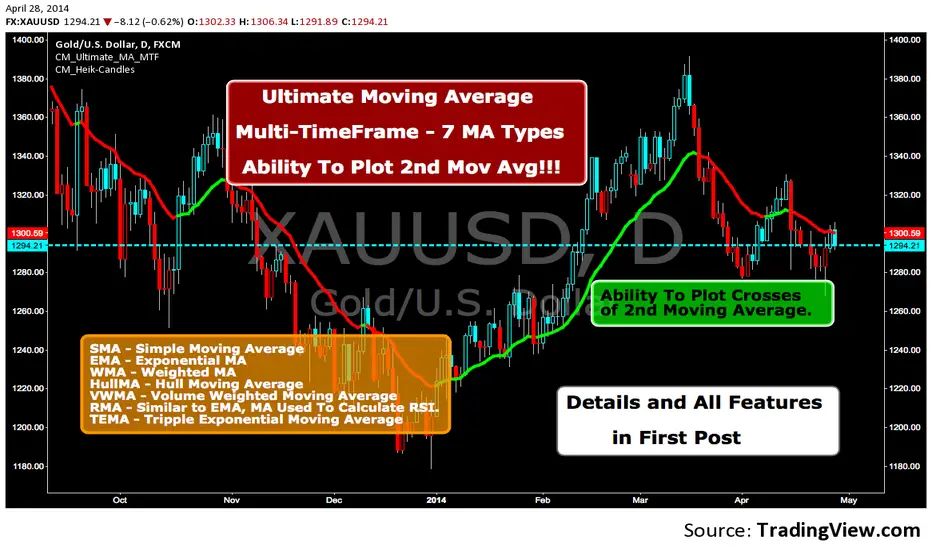
Ultimate Moving Average-Multi-TimeFrame-7 MA TypesAll Moving Averages and Features Built In To ONE Indicator. The Only Moving Average Indicator You Will Need. Details In 1st Post.