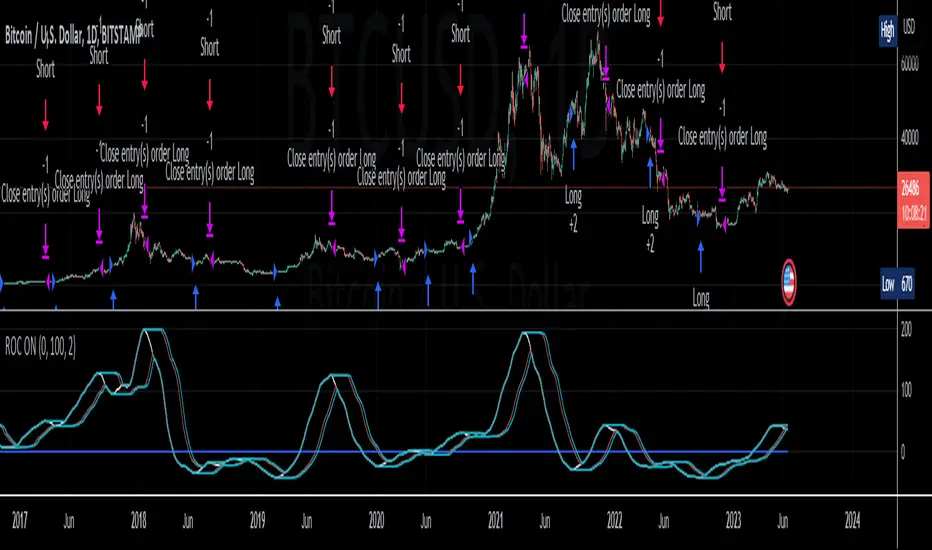
Trend Flow Profile [AlgoAlpha]Description:
The "Trend Flow Profile" indicator is a powerful tool designed to analyze and interpret the underlying trends and reversals in a financial market. It combines the concepts of Order Flow and Rate of Change (ROC) to provide valuable insights into market dynamics, momentum, and potential trade opportunities. By integrating these two components, the indicator offers a comprehensive view of market sentiment and price movements, facilitating informed trading decisions.
Rationale:
The combination of Order Flow and ROC in the "Trend Flow Profile" indicator stems from the recognition that both factors play critical roles in understanding market behavior. Order Flow represents the net buying or selling pressure in the market, while ROC measures the rate at which prices change. By merging these elements, the indicator captures the interplay between market participants' actions and the momentum of price movements, enabling traders to identify trends, spot reversals, and gauge the strength of price acceleration or deceleration.
Calculation:
The Order Flow component is computed by summing the volume when prices move up and subtracting the volume when prices move down. This cumulative measure reflects the overall order imbalance in the market, providing insights into the dominant buying or selling pressure.
The ROC component calculates the percentage change in price over a given period. It compares the current price to a previous price and expresses the change as a percentage. This measurement indicates the velocity and direction of price movement, allowing traders to assess the market's momentum.
How to Use It?
The "Trend Flow Profile" indicator offers valuable information to traders for making informed trading decisions. It enables the identification of underlying trends and potential reversals, providing a comprehensive view of market sentiment and momentum. Here are some key ways to utilize the indicator:
Spotting Trends: The indicator helps identify the prevailing market trend, whether bullish or bearish. A consistent positive (green) histogram indicates a strong uptrend, while a consistent negative (red) histogram suggests a robust downtrend.
Reversal Signals: Reversal patterns can be identified when the histogram changes color, transitioning from positive to negative (or vice versa). These reversals can signify potential turning points in the market, highlighting opportunities for counter-trend trades.
Momentum Assessment: By observing the width and intensity of the histogram, traders can assess the acceleration or deceleration of price momentum. A wider histogram suggests strong momentum, while a narrower histogram indicates a potential slowdown.
Utility:
The "Trend Flow Profile" indicator serves as a valuable tool for traders, providing several benefits. Traders can easily identify the prevailing market trend, enabling them to align their trading strategies with the dominant direction of the market. The indicator also helps spot potential reversals, allowing traders to anticipate market turning points and capture counter-trend opportunities. Additionally, the green and red histogram colors provide visual cues to determine the optimal duration of a long or short position. Following the green histogram signals when in a long position and the red histogram signals when in a short position can assist traders in managing their trades effectively. Moreover, the width and intensity of the histogram offer insights into the acceleration or deceleration of momentum. Traders can gauge the strength of price movements and adjust their trading strategies accordingly. By leveraging the "Trend Flow Profile" indicator, traders gain a comprehensive understanding of market dynamics, which enhances their decision-making and improves their overall trading outcomes.
Teknik Analiz

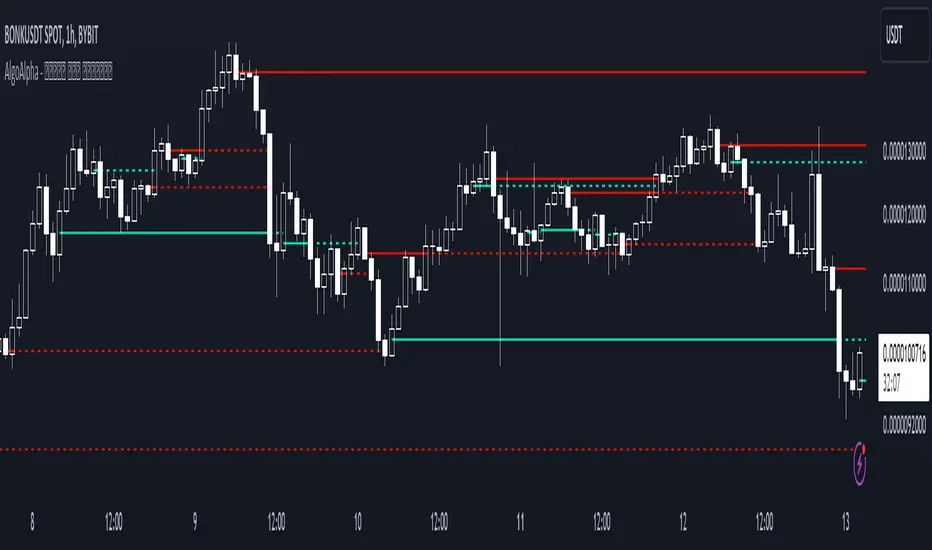
Peak & Valley Levels [AlgoAlpha]The Peak & Valley Levels indicator is a sophisticated script designed to pinpoint key support and resistance levels in the market. By utilizing candle length and direction, it accurately identifies potential reversal points, offering traders valuable insights for their strategies.
Core Components:
Peak and Valley Detection: The script recognizes peaks and valleys in price action. Peaks (potential resistance levels) are identified when a candle is longer than the previous one, changes direction, and closes lower, especially on lower volume. Valleys (potential support levels) are detected under similar conditions but with the candle closing higher.
Color-Coded Visualization:
Red lines mark resistance levels, signifying peaks in the price action.
Green lines indicate support levels, representing valleys.
Dynamic Level Adjustment: The script adapts these levels based on ongoing market movements, enhancing their relevance and accuracy.
Rejection Functions:
Bullish Rejection: Determines if a candlestick pattern rejects a level as potential support.
Bearish Rejection: Identifies if a pattern rejects a level as possible resistance.
Usage and Strategy Integration:
Visual Aid for Support and Resistance: The indicator is invaluable for visualizing key market levels where price reversals may occur.
Entry and Exit Points: Traders can use the identified support and resistance levels to fine-tune entry and exit points in their trading strategies.
Trend Reversal Signals: The detection of peaks and valleys serves as an early indicator of potential trend reversals.
Application in Trading:
Versatile for Various Trading Styles: This indicator can be applied across different trading styles, including swing trading, scalping, or trend-following approaches.
Complementary Tool: For best results, it should be used alongside other technical analysis tools to confirm trading signals and strategies.
Customization and Adaptability: Traders are encouraged to experiment with different settings and timeframes to tailor the indicator to their specific trading needs and market conditions.
In summary, the Peak & Valley Levels by AlgoAlpha is a dynamic and adaptable tool that enhances a trader’s ability to identify crucial market levels. Its integration of candlestick analysis with dynamic level adjustment offers a robust method for spotting potential reversal points, making it a valuable addition to any trader's toolkit.
Fourier Smoothed Volume Zone Oscillator (FSVZO) [AlgoAlpha]Description
The Fourier Smoothed Volume Zone Oscillator (FSVZO) is an implementation of the Discrete Fourier Transform in a Volume Zone Oscillator. Its purpose is to smooth price data and reduce noise to provide a more clear and accurate indication of price movement. This indicator also includes additional EMA smoothing to accurately depict reversals.
Discrete Fourier Transform
The Discrete Fourier Transform (DFT) is a mathematical algorithm used to convert discrete time-domain data into its frequency-domain representation. By decomposing a signal into its constituent frequencies, it reveals the amplitude and phase information associated with each frequency component.
Volume Zone Oscillator
The Volume Zone Oscillator is an indicator that combines volume and price data to provide insights into market trends and momentum. It calculates the difference between the volume traded above and below a specified price level and represents it as a line plot on the chart. The Volume Zone Oscillator helps traders identify periods of high buying or selling pressure and can be used to confirm trends, spot divergences, and generate trading signals. By analyzing the relationship between volume and price, traders can gain a deeper understanding of market dynamics and make more informed trading decisions.
Features
This indicator incorporates Ehler's Universal Oscillator concept and presents a histogram to provide valuable insights into the market's noise levels. Ehler's Universal Oscillator represents the statistical model that characterizes random and unpredictable market behavior. By utilizing this concept, the histogram enhances traders' ability to identify periods of increased or decreased volatility in the market.
How to use it?
Green dots and lines represent bullish price movement, while red dots and lines indicate bearish price movement. These signals gain additional strength when considering our oversold and overbought zones. Traders and investors can leverage these signals to initiate long positions when green signals coincide with oversold conditions, and vice versa. By combining these signals in synergy with Ehler's Universal Oscillator, a more precise representation of market trends can be achieved. To optimize its effectiveness, it is advisable to integrate this indicator with complementary technical analysis tools and incorporate it into a comprehensive trading strategy. Traders are encouraged to explore diverse settings and timeframes to align the indicator with their individual trading preferences and adapt it to prevailing market conditions.
Utility
By combining the FSVZO indicator with Ehler's white noise histogram, users gain a comprehensive perspective on volume-related market conditions. It empowers traders and investors to evaluate the intensity of buying or selling pressure, detect potential trend reversals or continuations, and ultimately make more informed trading decisions. This information can serve as confirmation or validation for other technical indicators, enabling traders to identify potential market turning points and enhance their comprehension of market dynamics.
The indicator offers several valuable applications, including the detection of divergence patterns between volume and price, identification of accumulation or distribution phases, and assessment of overall market trend strength. It accommodates various trading styles, such as swing trading, trend following, or mean reversion strategies. By leveraging these capabilities, traders can expand their toolkit and make more informed trading decisions.
Originality
The originality of the script lies in the combination of the Fourier analysis, white noise calculations, and the Volume Zone Oscillator. It provides a unique perspective on market dynamics and can be used to identify potential trading opportunities based on overbought and oversold conditions as well as trend reversals. Special thanks to @QuantiLuxe for their assistance in the development of this indicator

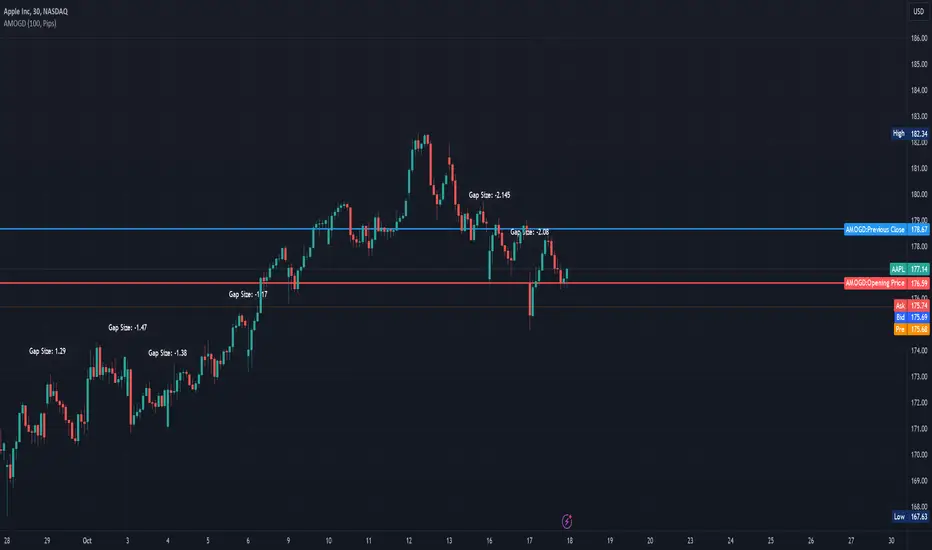
Advanced Market Opening Gap DetectorThe Advanced Market Opening Gap Detector (AMOGD) is a Pine Script indicator designed to help you identify market gaps at the opening of a new trading day. Gaps are areas on a chart where the price of a security moves sharply up or down with little or no trading in between. They are significant as they may indicate a change in market sentiment. This indicator highlights the size and direction of the opening gap, allowing you to potentially adjust your strategies accordingly.
By setting a minimum gap size, you can filter out smaller, less significant gaps, focusing only on larger gaps which may have more substantial implications. You can define the minimum gap size in points or pips, providing flexibility based on your trading preferences and the asset being traded.
How-to Use:
Apply the AMOGD indicator to your TradingView chart.
Configure the minimum gap size and unit (points or pips) based on your preference using the settings panel.
At the opening of each new trading day, the indicator will check for a gap between the previous close and the opening price.
If a valid gap is detected (i.e., the gap size meets or exceeds the minimum gap size specified), the indicator will:
Draw lines to indicate the opening price and previous close.
Display a label indicating the size of the gap.
Highlight the gap on the chart for better visibility.
Importance:
Market gaps can be pivotal points indicating a possible new trend or a continuation of the current trend. Being able to identify and analyze these gaps is crucial for making informed trading decisions. The AMOGD indicator automates the process of identifying and visualizing opening market gaps, saving traders time and allowing for quick assessment of market conditions at the start of each trading day. By setting a minimum gap size, traders can also filter out less significant price movements, allowing them to focus on potentially trend-changing gaps. This tool can be a valuable addition to a trader's toolkit, aiding in the analysis and interpretation of market behavior at the open, which is often a very volatile and crucial period in the trading day.
DISCLAIMER! RISK WARNING!
PAST PERFORMANCE IS NOT NECESSARILY INDICATIVE OF FUTURE RESULTS. TRADERS SHOULD NOT BASE THEIR DECISION ON INVESTING IN ANY TRADING PROGRAM SOLELY ON THE PAST PERFORMANCE PRESENTED, ADDITIONALLY, IN MAKING AN INVESTMENT DECISION, TRADERS MUST ALSO RELY ON THEIR OWN EXAMINATION OF THE PERSON OR ENTITY MAKING THE TRADING DECISIONS.
[Pivots Consolidation Breakout Screener] with Alerts (TSO) This is a pivots consolidation screener indicator, with ability to choose up to 12 different symbols/instruments with alert to be notified when consolidation happens on either one with the new pivots formation (new R3(inner resistance) pivot formed below previous one and new S3(inner support) pivot formed above previous one). Once the alert on a certain symbol/instrument is received - there is an ability to set a Breakout alert for the consolidated symbol/instrument.
This is a very powerful strategy, which doesn't happen often, but when happens - it often causes big moves after a breakout!
NOTE: Every calculation is done on a confirmed closed candle bar state, so the indicator will never repaint!
===========================================================================
Explanation of all the Features/Inputs/Settings
---------------------------------------------------------------------------
>>> On the very top, please read the important NOTES/TIPs.
>>> Next section is where the desired symbols can be turned on/checked to be screened for consolidation - the selected/checked symbols at creation of a 'Any alert() function call' alert will alert on any of the selected/checked symbols. Also, once consolidation forms, until next pivots formation - it will show it on the "Consolidation Stats" table. Once alerted on a specific symbol for consolidation - manual alert - 'Consolidation BREAKOUT' - can be created (MUST be done on the actual symbol chart, Right-Click > Add Alert) to be notified when actual breakout takes place.
>>> Pivots Settings section is where a manual timeframe/length can be set for the pivots as by Default it uses "Daily" timeframe. So, if want to experiment with more signals, but less accurate - a smaller timeframe can be set for Pivots Timeframe with smaller chart timeframe.
>>> Final section is simply the "Consolidation Stats" table location.
===========================================================================
Adding Alerts in TradngView
---------------------------------------------------------------------------
1) Consolidation alert(s) for the selected/checked symbols
- Select/check/find the desired symbols/instruments (when selecting symbols, make sure - they are from correct BROKER/SOURCE as pricing may differ between different brokers, causing confusion (under 1 broker/source, the symbol will be consolidated, under another it will not...))
-Right-click anywhere on any TradingView chart
-Click on Add alert
-Condition: Select this indicator by it’s name
-Immediately below, change it to "alert() function calls only"
-Expiration: Open-ended (that may require higher tier TradingView account, otherwise the alert will need to be occasionally re-triggered)
-Alert name: Whatever you desire
-Hit “Create”
-Note: If you change ANY Settings within the indicator – you must DELETE the current alert and create a new one per steps above, otherwise it will continue triggering alerts per old Settings!
* Once alert triggers, don't get confused, as it will show "Alert on SYMBOL", the SYMBOL will be where you created the major alert for all the symbols within the screener list! Within the alert, on the bottom, it will say: "EURUSD: Camarilla Pivots R3S3 Consolidation ALERT!" - this is where the correct symbol is for which the alert for consolidation was triggered!
---------------------------------------------------------------------------
2) Consolidation BREAKOUT alert(s)
-Right-click anywhere on any TradingView chart
-For the actual symbol (which got consolidated), open the chart (make sure timeframe is the same as with which "Consolidation alert(s)" were created prior), then Right-Click on the chart > Add Alert
-Click on Add alert
-Condition: Select this indicator by it’s name
-Immediately below, change it to "Consolidation BREAKOUT1"
-Expiration: Open-ended (that may require higher tier TradingView account, otherwise the alert will need to be occasionally re-triggered)
-Alert name: Whatever you desire
-Hit “Create”
* It will alert when a breakout occurs in any direction - once you open the chart for the symbol/instrument for which alert has occurred - you can immediately see into which direction the breakout occured, it will be marked on the chart with green/red triangle.
===========================================================================
If you have any questions or issues with the indicator, please message me directly via TradingView.
---------------------------------------------------------------------------
Good Luck! (NOTE: Trading is very risky, past performance is not necessarily indicative of future results, so please trade responsibly!)

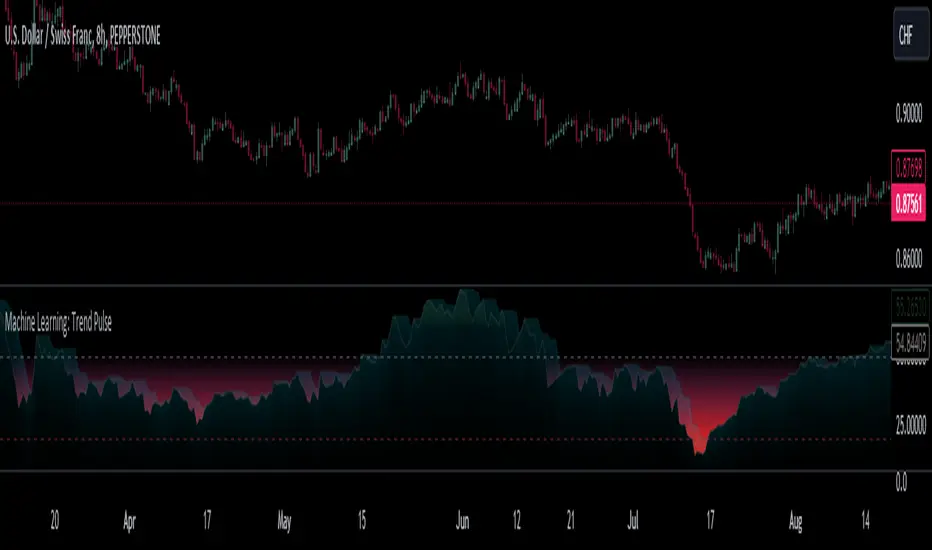
Machine Learning: Trend Pulse⚠️❗ Important Limitations: Due to the way this script is designed, it operates specifically under certain conditions:
Stocks & Forex : Only compatible with timeframes of 8 hours and above ⏰
Crypto : Only works with timeframes starting from 4 hours and higher ⏰
❗Please note that the script will not work on lower timeframes.❗
Feature Extraction : It begins by identifying a window of past price changes. Think of this as capturing the "mood" of the market over a certain period.
Distance Calculation : For each historical data point, it computes a distance to the current window. This distance measures how similar past and present market conditions are. The smaller the distance, the more similar they are.
Neighbor Selection : From these, it selects 'k' closest neighbors. The variable 'k' is a user-defined parameter indicating how many of the closest historical points to consider.
Price Estimation : It then takes the average price of these 'k' neighbors to generate a forecast for the next stock price.
Z-Score Scaling: Lastly, this forecast is normalized using the Z-score to make it more robust and comparable over time.
Inputs:
histCap (Historical Cap) : histCap limits the number of past bars the script will consider. Think of it as setting the "memory" of model—how far back in time it should look.
sampleSpeed (Sampling Rate) : sampleSpeed is like a time-saving shortcut, allowing the script to skip bars and only sample data points at certain intervals. This makes the process faster but could potentially miss some nuances in the data.
winSpan (Window Size) : This is the size of the "snapshot" of market data the script will look at each time. The window size sets how many bars the algorithm will include when it's measuring how "similar" the current market conditions are to past conditions.
All these variables help to simplify and streamline the k-NN model, making it workable within limitations. You could see them as tuning knobs, letting you balance between computational efficiency and predictive accuracy.
MACD Bands - Multi Timeframe [TradeMaster Lite]We present a customizable MACD indicator, with the following features:
Multi-timeframe
Deviation bands to spot unusual volatility
9 Moving Average types
Conditional coloring and line crossings
👉 What is MACD?
MACD is a classic, trend-following indicator that uses moving averages to identify changes in momentum. It can be used to identify trend changes, overbought and oversold conditions, and potential reversals.
👉 Multi-timeframe:
This feature allows to analyze the same market data on multiple time frames, which can be in help to identify trends and patterns that would not be visible on a single time frame. When using the multi-timeframe feature, it is important to start with the higher time frame and then look for confirmation on the lower time frames. This will help you to avoid false signals. Please note that only timeframes higher than the chart timeframe is supported currently with this feature enabled. Might get updated in the future.
👉 Deviation bands to spot unusual volatility:
Deviation bands are plotted around the Signal line that can be in help to identify periods of unusual volatility. When the MACD line crosses outside of the deviation bands, it suggests that the market is becoming more volatile and a strong trend may form in that direction.
👉 9 Moving Average types can be used in the script. Each type of moving average offers a unique perspective and can be used in different scenarios to identify market trends.
SMA (Simple Moving Average): This calculates the average of a selected range of values, by the number of periods in that range.
SMMA (Smoothed Moving Average): This takes into account all data available and assigns equal weighting to the values.
EMA (Exponential Moving Average): This places a greater weight and significance on the most recent data points.
DEMA (Double Exponential Moving Average): This is a faster-moving average that uses a proprietary calculation to reduce the lag in data points.
TEMA (Triple Exponential Moving Average): This is even quicker than the DEMA, helping traders respond more quickly to changes in trend.
LSMA (Least Squares Moving Average): This moving average applies least squares regression method to determine the future direction of the trend.
HMA (Hull Moving Average): This moving average is designed to reduce lag and improve smoothness, providing quicker signals for short-term market movements.
VWMA (Volume Weighted Moving Average): This assigns more weight to candles with a high volume, reflecting the true average values more accurately in high volume periods.
WMA (Weighted Moving Average): This assigns more weight to the latest data, but not as much as the EMA.
👉 Conditional coloring :
This feature colors the MACD line line based on it's direction and fills the area between the MACD line and Deviation band edges to highlight the potential volatility and the strength of the momentum. This can be useful to identify when the market is trending strongly and when it is in a more neutral or choppy state.
👉 MACD Line - Signal Line crossings:
This is a classic MACD trading signal that occurs when the MACD line crosses above or below the signal line. Crossovers can be used to identify potential trend reversals. This can be a bullish or bearish signal, depending on the direction of the crossover.
👉 General advice
Confirming Signals with other indicators:
As with all technical indicators, it is important to confirm potential signals with other analytical tools, such as support and resistance levels, as well as indicators like RSI, MACD, and volume. This helps increase the probability of a successful trade.
Use proper risk management:
When using this or any other indicator, it is crucial to have proper risk management in place. Consider implementing stop-loss levels and thoughtful position sizing.
Combining with other technical indicators:
The indicator can be effectively used alongside other technical indicators to create a comprehensive trading strategy and provide additional confirmation.
Keep in Mind:
Thorough research and backtesting are essential before making any trading decisions. Furthermore, it's crucial to have a solid understanding of the indicator and its behavior. Additionally, incorporating fundamental analysis and considering market sentiment can be vital factors to take into account in your trading approach.
Limitations:
This is a lagging indicator. Please note that the indicator is using moving averages, which are lagging indicators.
The indicators within the TradeMaster Lite package aim for simplicity and efficiency, while retaining their original purpose and value. Some settings, functions or visuals may be simpler than expected.
⭐ Conclusion
We hold the view that the true path to success is the synergy between the trader and the tool, contrary to the common belief that the tool itself is the sole determinant of profitability. The actual scenario is more nuanced than such an oversimplification. Our aim is to offer useful features that meet the needs of the 21st century and that we actually use.
🛑 Risk Notice:
Everything provided by trademasterindicator – from scripts, tools, and articles to educational materials – is intended solely for educational and informational purposes. Past performance does not assure future returns.

Trig-Log Scaled Momentum OscillatorTaylor Series Approximations for Trigonometry:
1. The indicator starts by calculating sine and cosine values of the close price using Taylor Series approximations. These approximations use polynomial terms to estimate the values of these trigonometric functions.
Mathematical Component Formation:
2. The calculated sine and cosine values are then multiplied together. This gives us the primary mathematical component, termed as the 'trigComponent'.
Smoothing Process:
3. To ensure that our indicator is less susceptible to market noise and more reactive to genuine price movements, this 'trigComponent' undergoes a smoothing process using a simple moving average (SMA). The length of this SMA is defined by the user.
Logarithmic Transformation:
4. With our smoothed value, we apply a natural logarithm approximation. Again, this approximation is based on the Taylor expansion. This step ensures that all resultant values are positive and offers a different scale to interpret the smoothed component.
Dynamic Scaling:
5. To make our indicator more readable and comparable over different periods, the logarithmically transformed values are scaled between a range. This range is determined by the highest and lowest values of the transformed component over the user-defined 'lookback' period.
ROC (Rate of Change) Direction:
6. The direction of change in our scaled value is determined. This offers a quick insight into whether our mathematical component is increasing or decreasing compared to the previous value.
Visualization:
7. Finally, the indicator plots the dynamically scaled and smoothed mathematical component on the chart. The color of the plotted line depends on its direction (increasing or decreasing) and its boundary values.

TrapZone ProThis script combines the concepts of Price Action, Trend and Momentum to identify Price Zones (Red and Green filled areas) and Price Bars (Red, Green and Gray) where traders can get trapped in the Market.
It will clearly mark the bars which favor the prevailing Trend and those bars which just don't have the momentum anymore. TrapZone moves with the market trend and will often provide it support. As the TrapZone changes direction & its color, traders can change their trade bias.
Features:
Identify strong & weak price action - By leveraging a regression calculation of price movement on Y axis against the x axis, we identify the strength of current bars. Increasing relative strength of bars indicate Bullish (Green Bars) & Bearish (Red Bars) price movement, respectively. As the relative strength starts to decrease in Bullish or Bearish price action, the indicator immediately changes the color of these bars to Gray (by default). We call these TrapBars .
Current price trend - By using the highs and lows of price in multiple periods, we are calculating the trend of the price. The Bullish trend is shown by the Green zone and Bearish trend is shown by the Red zone. These zones are the shaded areas which are plotted on the chart. If the price is in these Zones, Longs or Short trades are not advised as that price action is weak. We call these TrapZones .
Strength of the Momentum - the thickness of the TrapZone shows the strength of the current Bullish or Bearish trend. That means the wider the shaded area grows the stronger is the current market momentum. A Flat TrapZone indicates sideways price action.
Knowing when NOT to Trade is as important as when to Trade. While this indicator is designed to avoid taking bad trades such as FOMO, Catching a Falling Knife or Fighting The Trend , it successfully reveals the good trade setups!
How these features of this indicator helps Traders avoids common mistakes:
FOMO or Fear of Missing Out - If a Trader Sees TrapBars in a Bullish or Bearish Trend, they will avoid entry as the price action is weak at that time. This will avoid late entries.
Catching a Falling Knife (a.k.a. Picking a Bottom) - When Red TrapZone is being plotted, Traders can avoid taking Long Entries hoping for a price reversal.
Fighting The Trend (a.k.a Picking a Top) - When Green TrapZone is being plotted, Traders can avoid taking Short entries hoping for a price reversal.
TrapZone Pro does all this in a single panel of the chart irrespective of the market or timeframe.
How to use TrapZone Pro indicator for trading [
A. Market Analysis
Green TrapZone is Bullish and traders should not take Shorts. If Green TrapZone is moving higher, Market is Strong
Red TrapZone is Bearish and traders should not take Longs. If Red TrapZone is moving Lower, Market is Strong
No trades when TrapBars are forming
No trades inside the TrapZone
B. Trade Guidance System
Establish Market Bias - Bullish or Bearish using the TrapZone Color
Only Enter Long in Long Color Bars i.e. Green by default
Only Enter Short in Short Color Bars i.e. Red by default
3 Classes of Trades are Possible Class A, B & C. A being the best Reward : Risk ratio and C being the least rewarding. So use trade size accordingly.
Class A - Best bars are always the first & Second, close to the TrapZone
Class B - Long Bar or Short Bar Forming after TrapBar away from the TrapZone in a Strong Market
Class C - Long Bar or Short Bar Forming after TrapBar close to the TrapZone in a Flat Market (identified by Flat TrapZone )
Take profits when Price moves away from the TrapZone & TrapBars start forming OR Your Target is hit !
See a few examples of Trade Classes & Entries/ Exits for a better understanding
Recommendations
Select Session to “Electronic Trading Hours” in chart settings so you can see the Post & Pre Market trading as well. You can change the color of these sessions to the same color as chart background, so it is not distracting.
Start by Trading in the Hourly or Daily time frame to get used to the new indicator and its Trade Guidance System .
Position Size is the best form of Risk Management. Have a fixed dollar loss per trade pre-determined and adjust the size based on market volatility.
Even though this indicator is designed to work on any market or timeframe, trade the markets that you are familiar with and timeframe that matches your lifestyle. Your understanding of the instrument's behavior and knowledge of what makes it move is valuable.
Basic Set-Up
Add the Indicator to the chart
Open Chart Settings and in Symbol Section
Switch off “ Borders ”
Switch off “ Wick ” or Change the colors to a same non-distracting color like Black or Gray
Open TrapZone Pro Settings
Set the colors for the “ Long Bars ”, “ Short Bars ” & “ No Entry Bars ” if you wish to change the default colors
Change “ TrapZone ” colors to your Taste or leave the defaults
Green for “Color 0” that represents Bullish Price Action
Red for “Color 1” that represents Bearish Price Action
Important Advice & Disclaimer: This indicator does not guarantee that you will make money. It is a tool that performs market analysis for you and presents it in a easy to consume fashion. Markets are truly random and can change direction on a dime. You must use prudent risk and money management strategy based on your investor profile, investment objectives and risk appetite.
To Get Access - See Author’s instructions below

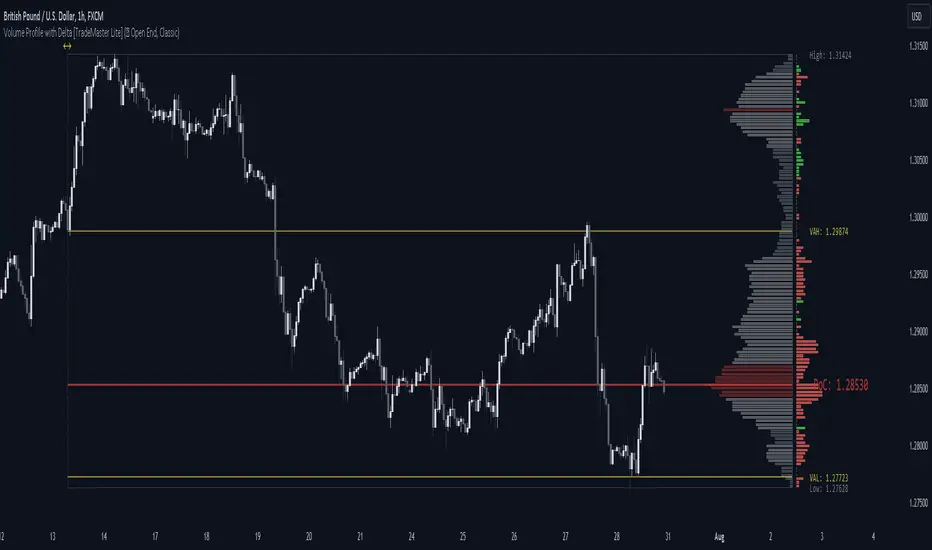
Volume Profile with Delta [TradeMaster Lite]The indicator estimates and displays the total traded volume and it's delta** at each price level during the user-defined period. It can be used to identify key support and resistance levels, determine logical take profit and stop loss levels, identify balanced and unbalanced markets and determine trend strength. The indicator offers different approaches to visualize the volume profile and can be chosen based on your preferred trading strategy and analysis method. The position and size of the Volume Profile is fully customizable, it can even be flipped if needed!
Three different display types (cosmetic effect only):
Classic
Compact
Modern
The Lite version offers three different range types:
Visible Range: displays the volume profile for the visible range of bars or candles on the chart. It adjusts dynamically as you change the chart view making it ideal for the modern trader who values both precision and simplicity.
Open End: displays the volume profile from a specific start date without a defined end, including real delta data. It provides an overview of the volume activity across all price levels of the examined period.
Fixed End: lets you define a specific start and end point for the volume profile. It can be useful if you want to analyze the volume activity within a specific time period or price range.
👉 Usage
The Volume Profile is a histogram that shows the estimated trading volume at certain price levels, how much was sold and how much was bought of the asset. The longer the histogram, the greater the trading volume at that price level. The Delta estimates which side was dominant at that price level and by how much.
To make the most out of the indicator, you can look for
pullbacks to high volume nodes or value areas,
initial equilibrium pullbacks,
buy or sell opportunities for price reversals,
institutional order flow.
The largest histogram node is called the Point of Control (POC). It is the estimated real market price of a coin. There's a common belief that when the price is above this point, the market sentiment is bullish, and when it's below, the sentiment turns bearish. It can act as a strong support if the price is above it and as strong resistance if the price is below it.
Price action usually finds the most support and resistance and the edge of the high volume areas. The indicator can mark these as VAH and VAL (Value Area High and Low).
In addition to the indication of support and resistance zones, the volume profile can also be used to infer the speed of price movements. At levels where there is little trading volume, faster and more volatile price movements are expected. In such scenarios the price may fall or rise faster to the next high volume zone.
👉 General advice
Confirming Signals with other indicators:
As with all technical indicators, it is important to confirm potential signals with other analytical tools, such as support and resistance levels, as well as indicators like RSI, MACD, and volume. This helps increase the probability of a successful trade.
Use proper risk management:
When using this or any other indicator, it is crucial to have proper risk management in place. Consider implementing stop-loss levels and thoughtful position sizing.
Combining with other technical indicators:
The indicator can be effectively used alongside other technical indicators to create a comprehensive trading strategy and provide additional confirmation.
Keep in Mind:
Thorough research and backtesting are essential before making any trading decisions. Furthermore, it's crucial to have a solid understanding of the indicator and its behavior. Additionally, incorporating fundamental analysis and considering market sentiment can be vital factors to take into account in your trading approach.
Limitations:
The Lite version shows simple delta with current timeframe volume data.
The indicators within the TradeMaster Lite package aim for simplicity and efficiency, while retaining their original purpose and value. Some settings, functions or visuals may be simpler than expected.
**The Delta estimates which side was dominant at that price level and by how much. It is the difference between bull and bear volume of the candle.
⭐ Conclusion
We hold the view that the true path to success is the synergy between the trader and the tool, contrary to the common belief that the tool itself is the sole determinant of profitability. The actual scenario is more nuanced than such an oversimplification. Our aim is to offer useful features that meet the needs of the 21st century and that we actually use.
🛑 Risk Notice:
Everything provided by trademasterindicator – from scripts, tools, and articles to educational materials – is intended solely for educational and informational purposes. Past performance does not assure future returns.
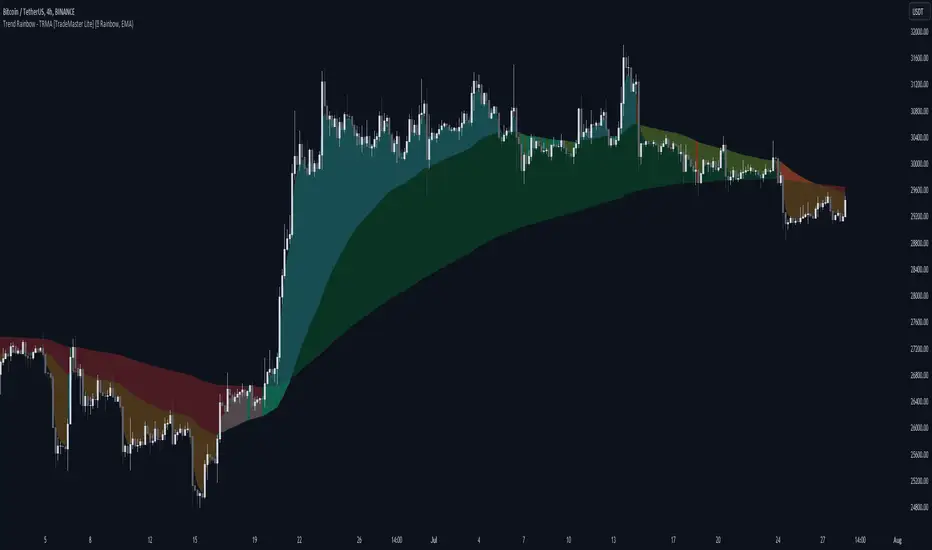
Trend Rainbow Moving Averages [TradeMaster Lite]The Trend Rainbow indicator is a simple technical analysis tool that uses moving averages to identify trends and potential buy and sell signals. It utilizes simple visualization techniques to present trend information in an intuitive, easily interpretable manner. This 21st-century tool is tailored for the modern trader who values both precision and simplicity.
The indicator uses our unique TRMA method to define short-term, intermediate, and long-term market trends. The TRMA (Trend Rainbow Moving Averages) is our own invention: a complex but flexible moving average matrix calculation that is designed to measure market trend direction, strength and shifting. Traders have the flexibility to choose from four types of moving average calculation bases to create a "rainbow".
👉 Example of usage:
General trend direction of the asset can be identified by looking at the slope of the rainbow. If the rainbow is generally pointing up, the asset is in an uptrend, if it is pointing down, the asset is in a downtrend. The indicator can also be used to assess the strength of a trend, identify potential resistance and support levels, and manage risk.
The Lite version of the indicator has 2 main trends to help you assess information about the direction and strength of asset's trend:
Intermediate trend: teal for bull trend, orange for bear trend.
Long-term trend: green for bull trend, red for bear trend.
Left side:
The image clearly shows that during the decline, the bearish intermediate trend was tested multiple times, acting as a resistance. This is a sign of weakness in the intermediate trend. The price did not have enough strength test the long-term trend yet, which is a sign that the long-term trend is still bearish.
Right side:
The intermediate trend first turned into neutral, then bullish. This is a sign of strength in the short-term and medium-term trends. This strength did not weaken and eventually. By maintaining the bullish intermediate trend, the long term trend was able to turn bullish again and a strong uptrend is now unfolding. This is a sign that the long-term trend is changing to bullish.
The Trend Rainbow also helps in risk management. On the right side of the chart the price is making a very steep move and both the intermediate and long-term trends are very far away from the current price. This shows us potential risk and the possibility of a deeper pullback. Trend edges can be used as potential entries or targets, depending on the situation.
👉 General advice
Confirming Signals with other indicators:
As with all technical indicators, it is important to confirm potential signals with other analytical tools, such as support and resistance levels, as well as indicators like RSI, MACD, and volume. This helps increase the probability of a successful trade.
Use proper risk management:
When using this or any other indicator, it is crucial to have proper risk management in place. Consider implementing stop-loss levels and thoughtful position sizing.
Combining with other technical indicators:
The indicator can be effectively used alongside other technical indicators to create a comprehensive trading strategy and provide additional confirmation.
Keep in Mind:
Remember that the example presented highlights how the Trend Rainbow indicator can be used. However, like all indicators, it is not a definitive market predictor. Thorough research and backtesting are essential before making any trading decisions. Furthermore, it's crucial to have a solid understanding of the indicator and its behavior. Additionally, incorporating fundamental analysis and considering market sentiment can be vital factors to take into account in your trading approach.
Limitations:
The indicators within the TradeMaster Lite package aim for simplicity and efficiency, while retaining their original purpose and value. Some settings, functions or visuals may be simpler than expected.
⭐ Conclusion
We hold the view that the true path to success is the synergy between the trader and the tool, contrary to the common belief that the tool itself is the sole determinant of profitability. The actual scenario is more nuanced than such an oversimplification. Our aim is to offer useful features that meet the needs of the 21st century and that we actually use.
🛑 Risk Notice:
Everything provided by trademasterindicator – from scripts, tools, and articles to educational materials – is intended solely for educational and informational purposes. Past performance does not assure future returns.
Flux Charts SFX Algo (Premium)Flux Charts SFX Algo indicator is a comprehensive and sophisticated all-in-one toolkit designed to cater to all the technical analysis needs of traders. Developed and designed by Russell W., head developer at Flux Charts.
The Flux Charts SFX Algo indicator stands apart with its unique ability to seamlessly integrate with various forms of technical analysis, while also offering the option to function as a standalone toolkit adaptable to any trading style. The indicator has been designed to take into account the dynamic nature of market conditions, ensuring that every feature included remains relevant, reliable, and effective.
Traders have countless possibilities when utilizing this indicator, allowing for the exploration and analysis of an array of cutting-edge features over time. This enables traders to selectively employ the features that align best with their individual trading styles and build a personal trading strategy.
The Flux Charts SFX Algo indicator is set to revolutionize the way traders approach technical analysis, providing them with the tools and insights needed to navigate complex financial markets with confidence and precision.
Flux Charts SFX Algo works in all markets (stocks, crypto, forex, futures, bonds, options, etc) and has many features including:
Buy signals (Not to be followed blindly)
Sell signals (Not to be followed blindly)
Buy & Sell Signal Ratings (Higher rating doesn't necessarily mean a "better" signal)
Algorithm Weighting Customization
Algorithm Sensitivity Customization
Algorithm Signal Strength Filter
Take Profit signals
Take Profit Retest signals
Take Profit Level Optimization
Trend Candle Coloring
Volatility Bands
+ more
What it does
The indicator uses an Adjusted Weighted majority algorithm to generate "buy" and "sell" signals. The algorithm takes into account several market metrics and weights them based on their recent performance. How far back the algorithm checks is based on the “Time Weighting” setting. This allows users to choose between having more data points or having more recency bias within the algorithm, but less data to decipher.
How it works and what differentiates it
There are many popular strategies in the market all of which go in and out of successful periods. The SFX algorithm effectively uses popular indicators or "experts" and weights them using a period decided through the "Time Weighting" Setting. The "experts" include popular indicators that cover Momenutmn, ATR trends, and EMA trends. Adjusted Weighted Majority typically weighs only through binary events however the SFX also uses a dynamic system to punish larger losses. The total weighting is then used to confirm a signal is agreeing with the most successful "experts" or indicators within the time period. This effectively will filter poor signals during periods of underperformance compared to other indicators and the converse during performant periods.
This weighting algorithm was inspired by the Princeton University lecture "Multiplicative Weight Algorithm" by Sanjeev Arora!
Usage
CME_MINI:ES1! 3 minute timeframe, July 7 2023.
Indicator Settings: (Sensitivity: 70, Signal Strength: 40, Time Weighting: Recent Trends)
The star-rated signals show the strength of the signals based on our weighting system
The colored candles (green & red) simplify the market into basic uptrends/downtrends
The volatility bands show areas of potential reversals
The volatility bands also show potential breakouts (Tight bands = consolidation, which could lead to an impulsive move)
The take profit signals suggest areas where profits should be taken in a trade
Settings and their Usage
Algorithm Settings Explained
Sensitivity determines how frequently signals appear. A higher sensitivity would lead to more frequent signals (Buy & Sell) appearing on your chart
Signal Strength helps filter out low-rated signals based on our Stochastic Weighting Algorithm. A higher signal strength will lead to fewer signals on your chart. A higher-rated signal doesn't necessarily make it a better signal than a lower-rated signal.
Time Weighting allows you to choose how much historic data you want the indicator to use when interpreting data for the signals. There are three options to choose from including:
- Recent Trends
- Mixed Trends
- Longterm Trends
Using the "Recent Trends" option will only use recent market data when looking at the market metrics our algorithm uses for generating "Buy" and "Sell" signals. Thus, there will be a recency bias which means the metrics the algorithm is weighing more heavily have recently performed well.
Using the "Longterm Trends" option will use more historic market data when looking at the market metrics our algorithm uses. This will give more data points for the algorithm to use, but it won't count for recent performances, but rather an overall performance in the past. Thus, if one metric has been doing poorly recently, it will still receive the same weight, even though it was performing well at the start of our lookback period for data.
Using the "Mixed Trends" option will give you a choice that is in between these two options. This will give you a good balance between having enough data points for market metrics, while also sustaining a good bit of market recency bias.

Cryptosmart Trading Tool (by heswaikcrypt)Introducing the Cryptosmart Trading Tool (CSTP) - An optimized into Market Sentiment and direction tool
The Cryptosmart Trading Tool (CSTP) is an advanced indicator developed to provide valuable insights into market sentiment and direction. This tool combines existing TA tools and intelligently develops smart algorithms to empower traders with a deeper understanding of market dynamics. Some classic elements are included in the scripting, such as the exponential moving average (EMA), volume, and Relative Strength Index (RSI), to provide a comprehensive analysis of market conditions. By combining these indicators, the script aims to capture different aspects of market sentiment and enhance the accuracy of the analysis.
The Cryptosmart Trading Tool (CSTP) incorporates a unique algorithm that combines trend following analysis, momentum analysis, and volume analysis to provide insights into market sentiment and price action.
Trend Following Analysis:
The algorithm utilizes two exponential moving averages (EMAs): EMA1 and EMA2.
When EMA1 crosses above EMA2, it indicates an uptrend (isUptrend).
When EMA1 crosses below EMA2, it indicates a downtrend.
You adjust the input value to suit your trading strategy, however, 7, 8, 21, 34, and 200 have been tested to produce a fine tuned output.
The bar color indicates blue for bullish sentiment (is uptrend) and white for bearish sentiment (is downtrend).
Momentum Analysis:
The relative strength index (RSI) is calculated based on the closing prices and the specified RSI length.
RSI values above 70 indicate overbought conditions (isOverbought).
RSI values below 30 indicate oversold conditions (isOversold).
Using the isOversoldExtreme and isOverboughtExtreme, the CSTP algorithm detect extreme over bought and oversold conditions and alert with label color green and red.
Volume Analysis:
The algorithm calculates the average volume over a specified length (averageVolume).
The volume ratio is obtained by dividing the current volume by the average volume.
High volume activity is identified when the volume ratio is greater than 1 (isHighVolume).
Major Flip and Arrow Plots:
Major bullish or bearish flips are identified when EMA1 crosses above EMA2 with RSI values above 50 and high volume activity (isBullishFlip) or when EMA1 crosses below EMA2 with RSI values below 50 and high volume activity (isBearishFlip).
Arrow plots are used to display trend direction, upward arrows for major bullish flips and downward arrows for major bearish flips.
The algorithm calculates the bullBearRatio and RSIValueAtFlip to capture the volume ratio and RSI values at major flips.
The bullishRatio and bearishRatio variables store the volume ratio values for the corresponding trend conditions.
Labels are also displayed on the chart to provide information about EMA values and RSI values. This can be independently disabled by the user
The uniqueness of the CSTP algorithm lies in its combination of trend following analysis, momentum analysis, and volume analysis. By considering these factors, the algorithm provides insights into market sentiment and price action. The use of EMAs, RSIs, and volume ratios allows traders to identify potential trends, overbought/oversold conditions, and high volume activity. The visual representation of bar colors and arrows enhances the ease of understanding the sentiment and major flips. CSTP is uniquely presented by using dots, arrows, candlestick colors, and shape labels to indicate the market scenario. This is explained below.
By leveraging multiple indicators and analysis techniques, CSTP aims to provide traders with a holistic understanding of market dynamics and enhance their decision-making process.
It's important to note that while the individual components used in CSTP are not new or unique on their own, the specific algorithm, parameters, and calculations used within the script are what make it distinctive and valuable. By carefully integrating these components, CSTP generates results that are greater than the sum of its parts, providing traders with a comprehensive analysis of market conditions.
Through extensive research, analysis, and testing, we have created a useful tool, fine-tuned to optimize the accuracy and reliability of the script's output, which can assist traders in making more informed trading decisions.
How to Use:
1. Apply the CSTP Script:
- Apply the CSTP script to your TradingView chart to start analyzing market conditions. (Access instructions can be found in the author's details section.)
- Ensure you have the latest version of TradingView to access all the features and functionalities.
2. Customize Parameters:
- Customize the input variables to match your trading preferences and adapt the tool to different markets.
- Experiment with different settings, such as RSI Length and EMA Lengths, to find the optimal configuration for your trading strategy.
3. Interpret the Color-Coded Bars and Wave Labels:
- Green bars indicate bullish sentiment, suggesting potential buying opportunities.
- Red bars indicate bearish sentiment, indicating potential selling opportunities.
- Blue and white bars represent sentiment backed by smart money liquidity, adding an extra layer of analysis.
- The wave labels provide insights into market structure and potential wave patterns.
4. Combine with Candlestick philosophy strategy and parameters used:
- Wait for candlestick closure before making trading decisions based on CSTP's analysis.
- Consider the EMA (yellow) line as an additional tool to confirm entry or exit points.
- Combining CSTP's analysis with candlestick patterns can enhance your decision-making process and improve trade timing.
- Volume Analysis: Compares the current volume to the Simple Moving Average (SMA) of volume using the RSI Length parameter to determine high-volume periods.
- Color-Coded Bars: The color of the bars represents different market sentiments based on all the parameters used including Relative strength index, bullish and bearish
divergence and volume conditions.
- Open Close Cross (OCC) Alerts: Generates dot alert with color code (red=Bearish, green=Bullish) when there is a crossover or crossunder between the close and open
prices
Important Notes:
- Candlestick color matter a lot as then show the sentiment of the market at a given time. and it is an added advantage for a trader to understand candlestick Psychology.
Candlestick conditions
I will use this BINANCE:MTLUSDT chart to explain how it works
Long green Arrow: Bullish call, with green isBullish arrow
Long red Arrow: Bearish call, with isBearish arrow
Blue with red wick and tape: this indicate a bearish sentiment but with some bullish volume, this position is dice which requires a proper understanding of entry and exit. when if this said candle stick closes below the EMA line, wait for the the next candle after it t determining your move. If the next one closes above it, then the direction is still bullish, else the direction has flipped bearish. (special scenario: in the range or consolidative market phase, you may need to wait 3-7 day candle close before you decide. use the coloration as guide to help with your decision making).
Blue with green wick and tape: this indicated strong bullish sentiment backed by liquidity to push. it is important to not the candle close, if the candle closes above the EMA (7 and/or 21) that validates the move, else, you may need to wait for the next candle close to determine the move and momentum of the market. Example is the $COOMPUST chart
White with green wick and tape: this works just like the "Blue candlestick with red wick and tape". follow same procedure
White with red wick and tape: White candle with red wick, indicates bearish sentiment backed by available market liquidity at the time.
If you see the market moving upward and the candlestick keep closing with white color, it is an indication of inorganic move (Check BITFINEX:SUIUST ) the best thing to do is to wait at resistance. a similar scenario can be seen here
Market test:
below are picture of the indicator tested on different assets
CRYPTOCAP:BNB
AUD
Tesla
it is best to book an entry after an arrow indicate (especially for a bullish market) and the candle closes above the EMA (Yellow line).
Risk management.
- ALWAYS PROTECT YOUR PROFIT WHEN YOU SEE ON. THE MARKET IS DYNAMIC
- Trading involves risks, and no tool can guarantee absolute accuracy in predicting market direction. Conduct thorough research and exercise caution when making trading decisions.
- Apply proper risk management strategies and adjust position sizes according to your risk tolerance.
- Stay updated with market news and events that may impact your trading decisions.
Conclusion:
The Cryptosmart Trading Tool (CSTP) provides traders with a powerful advantage by offering valuable insights into market sentiment and direction. To gain access or trial, refer to the author's details section. This indicator combines various analysis techniques to provide a comprehensive view of the market. Remember to apply your own analysis and expertise in conjunction with CSTP for optimal results.
This indicator combines my 8years of trading experience. Enjoy
Disclaimer:
Trading involves risks, and the CSTP script is designed to assist traders by providing valuable insights. It should be used as a supplement to your own analysis and expertise. Exercise caution and make informed trading decisions based on your own research.

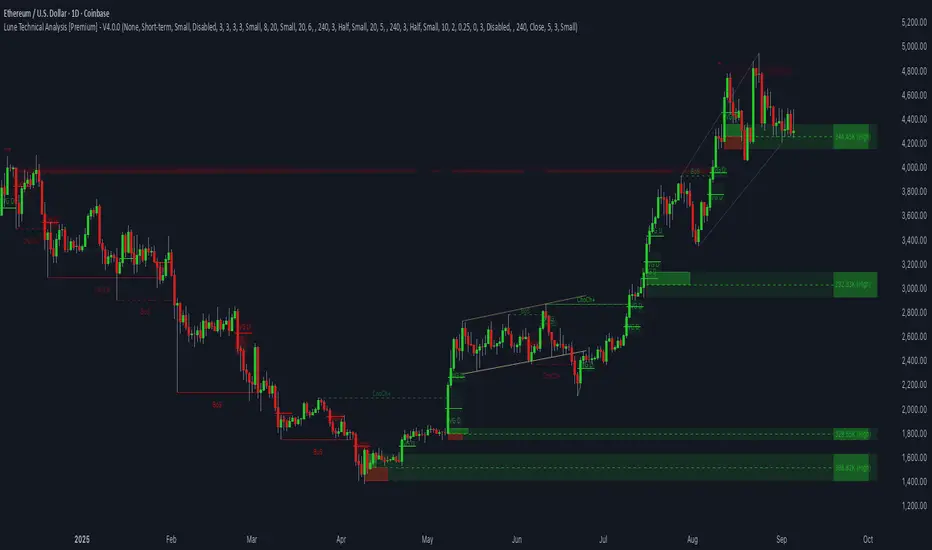
Lune Technical Analysis Premium⬛️ Overview
Lune Technical Analysis is a state-of-the-art TradingView indicator, meticulously designed to provide real-time market insights. Distinguished by its non-repainting features that operate in real-time, this tool brings enhanced accuracy and timeliness to your market analysis.
🟦 Features
Lune Technical Analysis equips traders with an array of innovative features:
🔹 Candle Coloring: The Candle Coloring feature introduces an innovative approach to visualizing market sentiment by coloring chart candles. It is devised to streamline your market analysis, offering a readily digestible snapshot of market trends. For example, if you aim to gauge the predominant market sentiment promptly, enable this feature for instant candle color-coding in accordance with prevailing bullish or bearish market structures. Though it currently supports only Market Structure-based Candle Coloring, its settings can be manipulated for enabling or disabling this feature. This feature operates by applying predefined algorithms that interpret market sentiment, coloring the candles accordingly.
🔹 Chart Pattern Detection: This sophisticated tool automatically detects and illustrates common chart patterns on your chart, simplifying the process of pattern identification. It identifies a range of patterns such as Head & Shoulders, Inverted Head & Shoulders, Ascending/Descending Wedges, Broadening Wedges, various Triangles, and Double Tops/Bottoms, enhancing your confluence detection in the market. For example, upon detecting a Double Top pattern, you could anticipate a potential price reversal due to this bearish signal. The sensitivity of this tool can be customized according to your trading style, with lower settings for short-term changes and higher for long-term. This feature leverages predefined formulas and price action analysis to identify these patterns.
🔹 Trendlines: With the Automatic Trendline Drawing tool, your technical analysis becomes significantly more efficient and precise. This feature is engineered to identify upward and downward Trendlines, aiding in locating potential pivots, and market support/resistance. For instance, if the price consistently rebounds off a Trendline, it may continue to do so, serving as a support/resistance level. However, a break through the Trendline could signal potential volatility and trend change. This feature's sensitivity to price changes can be adjusted to either short or long-term. It works by tracing Trendlines based on price action and wick formations to detect potential pivots.
🔹 Liquidity Bubbles: Liquidity Bubbles is an advanced tool that pinpoints key liquidity areas and large positions in real-time. This feature significantly contributes to effective trading strategy formulation by highlighting potential entry and exit points. It operates in real-time, ensuring zero repaint or lag, and supports two modes: Enhanced Bubbles and Basic Bubbles. For instance, the detection of multiple bullish Liquidity Bubbles during a ranging market could suggest an upward price movement due to dominant bullish volume. This feature's settings include thresholds for insignificant bubble filtering and a mode selection feature. Liquidity Bubbles operates by applying a proprietary formula to volume data, determining general volume direction and potential positions.
🔹 Market Structure: The Market Structure tool identifies key market structures such as Break of Structures (BoS) and Change of Character (ChoCh), thereby enhancing your ability to read market trends and sentiment. This smart money concept gives you a unique insight into short-term and long-term market trends. For instance, the appearance of a bullish Break of Structure and Change of Character after a predominantly bearish market sentiment could suggest a new bullish trend. This feature allows users to select which Market Structures to display and calculates these structures based on the market's high and low points.
🔹 Order Blocks: Order Blocks provide a visual representation of areas where large market participants are likely to place orders. These zones, where significant buying or selling activity has occurred in the past, offer insightful data for future price movements. The Order Blocks feature operates in real-time, providing real-time Order Blocks without any lag. For instance, if the price enters a large Order Block with predominantly bullish volume, an upward price movement can be anticipated. However, if the price breaks through the block, it could suggest the block's invalidation and a likely continued price fall. You can configure the settings to enable an additional Order Block, customize timeframes, overlap functions, and apply a quality filter. This feature calculates Order Blocks using the volume and candle size data.
🔹 Supply/Demand Zones: This real-time tool identifies crucial supply and demand zones, revealing potential price reaction points. These zones, where supply (selling pressure) and demand (buying pressure) have historically impacted price significantly, provide traders with insights into potential areas of strong support (demand) and resistance (supply). For example, if the price enters a large supply zone, a price rejection could be anticipated due to historical selling pressure at this zone. The settings enable users to add an additional Supply/Demand Zone, customize the timeframe, and apply a quality filter. This feature identifies common Supply/Demand Zones patterns based on volume and the size of the zone and displays them on the chart.
🔹 Fair Value Gaps: The Fair Value Gaps tool is designed to identify potential price correction zones or "gaps". These areas, where the market price sharply deviated from the fair value, suggest potential price adjustments in the future. For instance, the formation of a bullish Fair Value Gap could indicate a future price drop to fill this gap, potentially followed by an upward movement if the gap was of fair value. The settings allow users to enable additional Fair Value Gaps, customize the timeframe, and apply a quality filter. This feature measures large market gaps based on the size of the gap and its volume.
These features and tools collectively offer a comprehensive solution for traders to understand and navigate the financial markets. It's important to remember that they are designed to assist in making informed trading decisions and should be used as part of a balanced trading strategy.
🟧 Usage
Lune Technical Analysis's unique feature set can be leveraged both individually and synergistically. It is important to understand each feature and experiment with different configurations to best suit your unique trading needs.
🔸 Example #1: The following example demonstrates how the Order Block and Liquidity Bubbles feature can be used together to enhance your market analysis.
Order Blocks work in real-time to identify key order zones based on price action. These zones are often crucial for predicting price fluctuations. Meanwhile, Liquidity Bubbles act as real-time visual cues that detect significant market positions, facilitating an understanding of market accumulation, distribution, and trapped positions.
In this instance, at point 1, a bearish Basic and Enhanced Liquidity Bubble is visible within a crucial Order Block. The combination of these indicators augments the bearish sentiment, leading to a potential price decrease. Similarly, at point 2, the conjunction of two bullish Basic Liquidity Bubbles within an Order Block strengthens the bullish sentiment, culminating in a subsequent price increase.
🔸 Example #2: The following example demonstrates how Supply and Demand Zones can be used to detect strong and quality supports and resistance.
Supply and Demand Zones operate in real-time, detecting crucial zones based on price action and volume. This feature is invaluable for predicting potential price reaction points.
At point 1, the price enters a Supply Zone, a historical hotspot for selling activity, which usually leads to a price rejection and consequent decrease. At point 2, a Demand Zone indicating a bullish sentiment suggests a potential reversal when the price touches this level.
🔸 Example #3: The following example demonstrates how the Chart Pattern Detection feature is able to detect chart patterns to help enhance your trades.
Chart Pattern Detection employs formulas and price action analysis to identify common chart patterns as they form. Here, it successfully detects a 'Head and Shoulders' pattern, a conventionally bearish pattern, indicating a potential price drop.
🟥 Conclusion
Lune Technical Analysis stands as an exceptional blend of real-time insights into market activity. Its real-time, non-repainting features offer traders a more precise and timely approach to market analysis, promoting improved decision making in ever-changing market conditions.
🔻 Access
You can see the Author's instructions below to get instant access to this indicator & our Premium Suite.
🔻 Disclaimer
Lune Technical Analysis is a tool for aiding in market analysis and is not a guarantee of future market performance or individual trading success. We strongly recommend that users combine our tool with their trading strategies and do their due diligence before making any trading decisions.
Remember, past performance is not indicative of future results. Please trade responsibly.
Volume-Weighted Trend Filter CloudThe Volume-Weighted Trend Filter Cloud is a powerful technical analysis tool designed to identify trend directions and potential buy/sell signals in a trading instrument. The indicator combines volume-weighted moving averages, average true range (ATR), and cloud plotting techniques to provide a comprehensive view of the market trend.
Inputs:
Length: Specifies the length of Algo used for trend analysis. Default value is 14.
Multiplier: Adjusts the width of the trend filter bands based on the ATR. Default value is 2.0.
Tenkan-sen Period: Defines the period for calculating the Tenkan-sen line. Default value is 200.
Kijun-sen Period: Sets the period for calculating the Kijun-sen line. Default value is 400.
Senkou Span Period: Determines the period for calculating the Senkou Span A and Senkou Span B lines. Default value is 600.
Calculation:
Average True Range (ATR): The indicator calculates the ATR based on the specified moving average length.
Trend Filter Bands: The basic upper and lower bands are calculated using the highest high and lowest low values, respectively, along with the multiplier and ATR. These bands are then adjusted to create the final upper and lower bands, taking into account the previous values.
Trend Direction: The indicator determines the trend direction by comparing the close price with the lower and upper bands. If the close price is above the lower band, it indicates an upward trend (trendUp = 1). If the close price is below the upper band, it indicates a downward trend (trendDown = 1).
Volume-Weighted Z-Score: The indicator calculates the volume-weighted Z-Score by determining the mean and standard deviation of the close price with volume weighting. The Z-Score represents the deviation of the close price from the mean in terms of standard deviations.
Tenkan-sen, Kijun-sen, Senkou Span A, and Senkou Span B: These lines are calculated using the respective periods and the average of the high and low prices.
Sigmoid Transformation: The indicator applies the sigmoid function to the Z-Score values to obtain sigmoid-transformed values for open, high, low, and close prices. These transformed values help in visualizing the trend strength.
Plotting:
Trend Filter: The trend filter is plotted as a line that changes color based on the trend direction. The lower band is displayed for an upward trend, while the upper band is displayed for a downward trend.
Trend Cloud: The cloud plot represents the Senkou Span A and Senkou Span B lines. The cloud color changes based on the trend direction, providing a visual representation of the market trend.
Buy and Sell Signals: The indicator generates buy and sell signals based on the crossover of fast and slow moving averages, Z-Score values, trend direction, and other conditions. These signals are labeled on the chart, indicating potential entry points for traders.
The indicator generates buy and sell signals based on specific conditions, including the intersection of fast and slow moving averages, Z-Score values, trend direction, and more.
Buy signals are described as a "buy signal" on the chart, which indicates potential entry points for buy trades.
Sell signals are described as a "sell signal", which indicates potential entry points for sell trades. The signals in light color represent that they are signals in the opposite direction of the cloud that can be considered as exit points

SmartVPSGTitle: Identifying Volume Spikes, Price Movements and Gap Ups: A TradingView Script
Introduction:
In the world of trading, identifying volume spikes and price movements can provide valuable insights into market trends and potential trading opportunities. In this article, we'll explore a TradingView script that helps traders visualize volume spikes, price up moves with volume spikes, and gap-up days on their charts.
Detecting Price Up Moves:
The script starts by calculating price up moves. It compares the current day's closing price with the previous day's closing price and checks if it has increased by 3% or more. This helps traders spot significant upward price movements.
Detecting Volume Spurts:
Next, the script focuses on detecting volume spikes, which are often associated with increased market activity and potential trading opportunities. It compares the current day's volume with the highest volume of the previous nine sessions. If the current volume exceeds all the volumes of the previous nine sessions, it is considered a volume spurt.
Example:
Let's consider a hypothetical scenario where we have the following volume data for a stock:
Day 1: 100,000
Day 2: 80,000
Day 3: 120,000
Day 4: 150,000
Day 5: 200,000
Day 6: 90,000
Day 7: 110,000
Day 8: 130,000
Day 9: 140,000
Day 10: 250,000 (current day)
To determine if there is a volume spurt on Day 10, the script compares the current day's volume (250,000) with the highest volume of the previous nine sessions. In this case, the highest volume among the previous nine sessions is 200,000 (on Day 5). Since the current day's volume (250,000) exceeds the highest volume of the previous nine sessions (200,000), it is considered a volume spurt.
Identifying Gap-Up Days:
Gap-up days occur when the market opens significantly higher than the previous day's close. To identify these days, the script compares the current day's low price with the previous day's high price. If the low price is greater than the previous day's high, it is marked as a gap-up day.
Visualizing the Findings:
To provide a clear visual representation of the identified patterns, the script uses different shapes and colors. First, it plots small red dots above the candles whenever a volume spurt is detected. These dots help traders quickly identify periods of increased volume activity.
For price up moves with volume spikes, the script utilizes blue triangular shapes below the candles. This allows traders to pinpoint instances where both price and volume are showing positive signs, indicating potential bullish movements.
Additionally, the script incorporates green candles to represent gap-up days. These candles help traders recognize days when the market opens with a significant upward gap, suggesting a potential shift in market sentiment.
Conclusion:
The TradingView script discussed in this article provides traders with a visual representation of volume spikes , price up moves with volume spikes , and gap-up days . By incorporating these visual cues into their analysis, traders can gain valuable insights into market trends and potential trading opportunities.
Remember, this script should be used for educational and informational purposes only and does not serve as financial advice or recommendations. Traders are encouraged to customize and modify the script according to their specific trading strategies and risk tolerance.
Share this script with other traders on TradingView to enhance their chart analysis and trading decisions.
PS: This TradingView script is designed to work specifically on the daily timeframe (daily candles). It calculates and identifies volume spurts based on the volume data of the daily timeframe. Since it is designed for the daily timeframe, it may not produce accurate results or work as intended on other timeframes.

Heikin Ashi ROC Percentile Strategy**User Guide for the "Heikin Ashi ROC Percentile Strategy"**
This strategy, "Heikin Ashi ROC Percentile Strategy", is designed to provide an easy-to-use framework for trading based on the Heikin Ashi Rate of Change (ROC) and its percentiles.
Here's how you can use it:
1. **Setting the Start Date**: You can set the start date for the strategy in the user inputs at the top of the script. The variable `startDate` defines the point from which the script begins executing trades. Simply input the desired date in the format "YYYY MM DD". For example, to start the strategy from March 3, 2023, you would enter `startDate = timestamp("2023 03 03")`.
2. **Adjusting the Midline, Lookback Period, and Stop Loss Level**: The `zerohLine`, `rocLength`, and `stopLossLevel` inputs allow you to adjust the baseline for ROC, the lookback period for the SMA and ROC, and the level at which the strategy stops the loss, respectively. By tweaking these parameters, you can fine-tune the strategy to better suit your trading style or the particular characteristics of the asset you are trading.
3. **Understanding the Trade Conditions**: The script defines conditions for entering and exiting long and short positions based on crossovers and crossunders of the ROC and the upper and lower "kill lines". These lines are defined as certain percentiles of the ROC's highest and lowest values over a specified lookback period. When the ROC crosses above the lower kill line, the script enters a long position; when it crosses below the upper kill line, it exits the position. Similarly, when the ROC crosses below the upper kill line, the script enters a short position; when it crosses above the lower kill line, it exits the position.
In my testing, this strategy performed best on a day and hour basis. However, I encourage you to experiment with different timeframes and settings to see how the strategy performs under various conditions. Remember, there's no one-size-fits-all approach to trading; what works best will depend on your specific circumstances, goals, and risk tolerance.
If you find other useful applications for this strategy, please let me know in the comments. Your feedback is invaluable in helping to refine and improve this tool. Happy trading!
Volume Accumulation Oscillator (VAO)The Volume Accumulation Oscillator (VAO) is a powerful momentum-based indicator designed to assess the strength of volume accumulation in a given asset. It helps traders identify periods of intense buying or selling pressure and potential trend reversals.
The VAO calculates the Net Volume Accumulation (NVA) by considering the volume, open, close, high, and low prices. It then applies exponential moving averages (EMAs) to smooth the NVA and calculates the VAO by comparing the smoothed NVA with its EMA over a specified signal period.
The VAO is plotted as a line chart, providing a clear visual representation of its values. Positive VAO values indicate strong bullish volume accumulation, suggesting potential upward price movement. Conversely, negative VAO values indicate significant selling pressure and the possibility of a downtrend.
To enhance the analysis, the indicator includes reference levels such as the zero line and +/-1 levels. These levels serve as important reference points for interpreting the VAO values and identifying key turning points in the market.
Additionally, the VAO histogram is included, which further illustrates the strength and direction of volume accumulation. The histogram bars are color-coded, with green bars representing positive VAO values and red bars representing negative VAO values.
The Volume Accumulation Oscillator is a versatile tool that can be used in various trading strategies. Traders can look for divergences between the VAO and the price chart to identify potential trend reversals. Combining the VAO with other technical analysis techniques can provide valuable insights into market dynamics and help traders make informed trading decisions.
Note: It is recommended to customize the indicator's parameters and conduct thorough backtesting to align it with your specific trading strategy and preferences before using it for live trading.
Disclaimer: This indicator is provided for educational and informational purposes only. Trading involves risks, and it is important to exercise caution and conduct your own analysis before making any investment decisions.

52 Week High/Low FibonacciThe primary purpose of this indicator is to calculate and plot the 52-week high and low prices along with the Fibonacci retracement levels on the price chart. Fibonacci levels are commonly used in trading to identify potential support, resistance, and price reversal points.
First, the script initializes the Fibonacci levels and their corresponding colors, which will be used to plot the levels on the chart. Next, it calculates the 52-week high and low prices by finding the highest and lowest prices over the last 252 trading days, approximately equivalent to one year. Then, it identifies the overall trend direction by comparing the number of bars since the highest high and the lowest low. If the highest high is more recent, the trend is considered downwards; if the lowest low is more recent, the trend is upwards.
The script then plots the Fibonacci retracement levels on the chart, using horizontal lines at the respective price levels. It also creates labels for each level, displaying the percentage and the price value. Additionally, it draws a line connecting the 52-week high and low prices, providing a visual representation of the price range during the 52-week period.
Pros of this indicator include:
-Automatic calculation and plotting of Fibonacci levels, saving time for traders
-Clear trend identification based on 52-week high and low prices
-Visually appealing and easy-to-read chart representation with color-coded levels
-Provides insight into potential price reversal areas based on widely used Fibonacci levels
Cons of this indicator include:
-Only works on daily timeframes, limiting its usefulness for intraday and weekly traders
-Assumes that the trend will continue in the same direction, which may not always be accurate in real-world markets
-Does not provide explicit buy or sell signals, leaving the trading decision-making process up to the trader
-Solely relies on Fibonacci levels, which may not always be accurate; it is recommended to use other technical indicators or strategies alongside this indicator for a comprehensive trading approach
In conclusion, the '52 Week High Low Fibonacci' indicator is a valuable tool for traders interested in using Fibonacci levels for identifying potential price reversal points. By automatically calculating and plotting these levels based on 52-week high and low prices, the indicator provides a clear, color-coded visual aid, which can be especially helpful for traders who base their strategies on these levels.
However, it's worth noting that this indicator is limited to daily timeframes and doesn't provide explicit buy or sell signals, requiring traders to incorporate their own analysis and judgement in their decision-making process. The indicator also operates on the assumption of trend continuation, which may not always hold true.
While it's a beneficial tool, relying solely on this indicator for trading decisions may not be advisable. It's best used in conjunction with other indicators and trading strategies, providing a more balanced and comprehensive approach to trading in the financial markets. As always, risk management should be a key part of any trading strategy.
**YOUR INSIGHTFUL FEEDBACK OR SUGGESTIONS FOR REVISIONS TO THIS CODE ARE HIGHLY APPRECIATED. PLEASE FEEL FREE TO SHARE YOUR THOUGHTS TO FOSTER ITS CONTINUAL IMPROVEMENT**

DCA Detective | v1.0BINANCE:FETBUSD
The DCA Detective | v1.0 strategy revolutionizes the realm of DCA (Dollar Cost Averaging) trading, integrating advanced trade initiation predicated on savvy Technical Analysis (TA) signals. This strategy's distinctive feature rests in its capacity to leverage TA signals or preset percentage levels to trigger safety orders, providing adaptability based on your preference. Bid farewell to rudimentary safety order placements.
The strategy incorporates a comprehensive array of parameters:
RSI Oversold Level - a predetermined level signaling a potential oversold condition where a price rebound may be imminent.
Divergence Lookback Period - this parameter specifies the duration over which the system scrutinizes for any disparity between price and RSI.
Minimum Bars Between Trades - this guarantees a specific interval between trades, thwarting excessive trading and promoting diversification over time.
Rate of Change (ROC) - a momentum-oriented technical indicator that gauges the percentage alteration in price between the current price and the price a certain number of periods back.
Stochastic Length and Oversold - parameters that delineate the Stochastic Oscillator, another momentum indicator that compares a particular closing price of a security to a spectrum of its prices over a specified period.
Higher Timeframe RSI Length and Oversold Level - for heightened precision, these parameters operate on lower timeframes, offering a wider outlook and aiding in the filtering of market noise.
The DCA Detective | v1.0 strategy deploys bullish divergence identified by the RSI and a crossover of the RSI over the oversold level as primary entry signals. Safety order conditions can be set to either Percentage or Smart, based on your preference. The "Smart" condition utilizes the same rules as the initial entry order to place safety orders.
The strategy also entails additional configuration settings such as the maximum safety orders, safety order price deviation, safety order volume scale, safety order step scale, and take profit percentage.
Main goal is to catch possible market bottom/dip.
In summary, the DCA Detective | v1.0 strategy proposes a sophisticated and nuanced approach to DCA trading. It taps into the potential of TA signals to initiate trades, while using safety orders as a risk management tool, with the intent to minimize possible losses and decrease overall time in trade. This strategy stands as a testament to refined trading tactics, crafted for those who endorse strategic investment and measured risk-taking.
Through webhook integration, the DCA Detective | v1.0 strategy can send signals to 3commas to initiate trades, adjust safety orders, and take profit at the designated percentages. This provides traders with a hands-off approach to trading, allowing them to focus on other areas of their portfolio or strategy while the DCA Detective | v1.0 strategy runs in the background.
So far, I haven't come across a good DCA strategy based on TA orders, so I created my own. I was troubled by my prolonged exposure to red bags, but with proper configuration, this strategy should get you out of the trade as soon as possible. I have managed to enter most of the good coins at an unbeatable average trade time and also eliminate the maximum trade time to less than 10 days !

User Defined Momentum Change with Swing VisualsThis script is a groundbreaking, math-centric technical analysis tool that blends two well-established indicators, the Stochastic Oscillator and the Exponential Moving Average (EMA), to deliver a unique and visually engaging way of identifying momentum swings and stochastic indicators. Unlike mashups, this script is tailored to accommodate a wide range of trading strategies, providing traders with a distinctive perspective on market trends.
The innovation in this script lies in its mathematically-driven ability to effectively combine the Stochastic Oscillator and EMA, setting it apart from other available tools that simply offer a rehash of old ideas or slight modifications to popular indicators. The EMA is employed instead of a Simple Moving Average (SMA), enhancing the uniqueness of the calculations. This novel approach creates a new dimension for traders to evaluate potential momentum swings and visualize them on the chart, proving it to be more than just a mere mashup of existing indicators.
Central to the script's utility is its extensive customization options, which allow traders to adjust various inputs to suit their preferences and trading strategies. Users can modify the EMA length, swing range signal offsets, and smoothing factors for both the fast and slow components of the Stochastic Oscillator. Additionally, the script offers the ability to personalize the color thresholds, transparency, and line properties for the Stochastic Oscillator and swing range signal.
This script's visually dynamic representation of momentum swings empowers traders to make more informed trading decisions, particularly on the 6-hour timeframe. The swing range signal, represented by vertical lines on the chart, acts as a valuable visual aid for identifying potential entry or exit points. Furthermore, the Stochastic Oscillator provides insights into the strength and direction of momentum, which is beneficial for confirming potential trade signals.
To conclude, this script is not just another combination of MAs or a slightly modified version of a popular indicator. Instead, it offers traders a comprehensive, visually appealing, and customizable tool for technical analysis, which is both original and useful. By uniquely combining the EMA and the Stochastic Oscillator with a strong mathematical foundation, and allowing traders to adjust a variety of settings, this script adds value to the TradingView community and enhances the body of knowledge available for traders. It is designed to support traders in tailoring their analysis based on their own strategies and preferences, enabling them to make well-informed decisions in the financial markets.
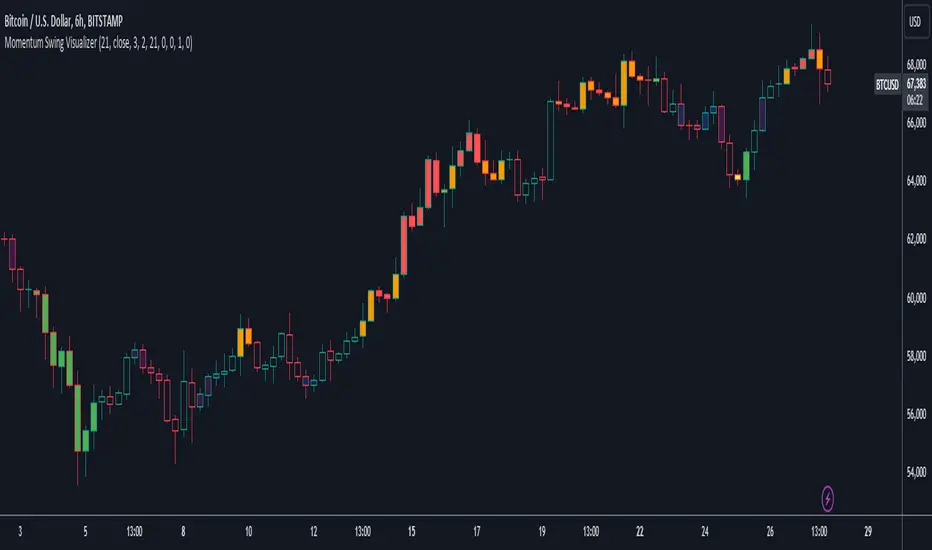
Fundamental Value and Dividend Growth InvestingThis script is an original implementation of a Fundamental Value and Dividend Growth Investing Strategy for traders who want to incorporate these concepts in their trading decisions. The script uses technical indicators to determine buy and sell signals based on a set of criteria.
To use the script, traders can input various parameters, such as the length of the simple moving averages (SMA), the rate of change (ROC) length, and the dividend yield. The script calculates the SMA for the long and short periods, the ROC, and the dividend.
The buy signal is triggered when the current closing price is greater than the short-term SMA, the short-term SMA crosses above the long-term SMA, the ROC is positive, and the closing price is greater than the dividend. The sell signal is triggered when the current closing price is less than the long-term SMA, the long-term SMA crosses above the short-term SMA, and the ROC is negative.
The script plots the signals and the indicators, such as the SMA200, the SMS50, the dividend, and the ROC. The script also includes alert conditions for the buy and sell signals.
The concept underlying the calculations of this script is the Fundamental Value and Dividend Growth Investing Strategy. This strategy aims to identify stocks that are trading below their intrinsic value and have a history of increasing dividends. The SMA and ROC indicators help identify the trends in the stock price, while the dividend yield helps identify stocks with a history of dividend growth.
Overall, this script offers traders an original and useful tool for incorporating Fundamental Value and Dividend Growth Investing Strategy into their trading decisions.
Stock Dissect DashboardI developed this script, to help me in my analysis process of Stocks.
In it I have combined several things that I look at when evaluating a company.
First, there is the Macro part, where I have added the most important (at least for me) macro indicators, such as inflation, interest rates, initial jobless claims etc.
Under the last is the latest reported value, next we have the previous, and next to them is the change.
Underneath it is the technical part.
I have added the 1-Week, 1-Month, 3-Month, and 1-Year returns. This way I can easily see the performance of the stock over time.
We have a market regime indicator, which tells us whether the stock is Trending, Mean-Reverting, or Neutral.
Also, I've added the RSI and 50 and 200 Day Moving Averages for additional analysis
At the bottom, I've included some of the fundamentals that I look at in my analysis process. We have the PE and PB ratio, as well as the debt-to-equity and profit margins.
I hope you guys like it and saves you as much time and energy as it did for me.
Happy trading!
