ADR Checker - Breakouts📈 ADR Checker – Breakouts
Gain the edge by knowing when a stock has already made its move.
🚀 What It Does:
The ADR Checker - Breakouts is a powerful yet simple visual tool that helps traders instantly assess whether a stock has already exceeded its Average Daily Range (ADR) for the day — a critical piece of information for momentum traders, swing traders, and especially those following breakout, VCP, or CANSLIM strategies.
Using a customizable on-screen table that always stays in view (regardless of zoom or chart scaling), this script shows:
✅ Average ADR% – 20-day average range, calculated in %.
📊 Today’s Move – how much the stock has moved today.
🔥 % of Avg ADR – today's move relative to its historical average, with live color feedback:
🟥 Over 100% (Overextended – danger!)
🟧 70-100% (Caution zone)
🟩 Below 70% (Room to move)
💡 Why It Matters:
One of the most overlooked mistakes by breakout traders is entering a trade after the move has already happened. If a stock has already moved more than its typical daily range, the odds of further continuation sharply decrease, while the risk of pullback or chop increases.
With this tool, you can:
🚫 Avoid chasing extended breakouts
🎯 Time entries before the real move
⚠️ Quickly assess risk/reward potential intraday
🧠 Example Use Case:
Imagine you're watching a classic VCP setup or flat base breakout. The stock breaks out on volume—but when you check this indicator, you see:
Today’s Move: 7.2%
Avg ADR: 5.3%
% of ADR: 135% 🟥
This tells you the stock is already well beyond its average daily range. While it may continue higher, odds now favor a consolidation, shakeout, or pullback. This is your cue to wait for a better entry or pass entirely.
On the flip side, if the breakout just started and the % of ADR is still under 50%, you have confirmation that there’s room to run — giving you more confidence to enter early.
⚙️ Fully Customizable:
Choose position on screen (top/bottom left/right)
Customize text color, background, and size
🔧 Install This Tool and:
✅ Stop chasing extended moves
✅ Add discipline to your entries
✅ Improve your breakout win rate
Perfect for VCP, CANSLIM, and BREAKOUT traders who want a clean, edge-enhancing visual guide.
Swingtrading

Daily Movement AnalysisDaily Volatility Explorer: 7-Day Market Pulse Indicator
Unlock the hidden rhythms of market movements with this powerful analytical tool designed for both traditional and crypto traders. This indicator meticulously tracks and analyzes price volatility patterns across all seven days of the week, giving you a strategic edge in planning your trades.
🎯 Key Features:
• Dynamic 3-month rolling analysis of daily price movements
• Real-time volatility comparison across all trading days
• Clear visual representation through color-coded bar charts
• Detailed statistical table with exact pip movements
• Sample size tracking for statistical reliability
• Works seamlessly on both traditional and crypto markets
💡 Why Traders Need This:
1. Optimal Trade Timing
- Identify the most volatile trading days for maximum opportunity
- Discover the quietest days to avoid choppy markets
- Perfect for swing traders and day traders alike
2. Risk Management Enhancement
- Set smarter stop-losses based on typical daily ranges
- Adjust position sizes according to daily volatility patterns
- Avoid overtrading during historically low-volatility periods
3. Strategic Planning
- Plan your trading week around peak volatility days
- Optimize entry and exit points based on historical movements
- Better time management by focusing on the most active days
4. Market Psychology Insights
- Understand weekly market rhythm and institutional patterns
- Identify how weekend gaps affect crypto markets
- Spot changes in market behavior across different days
🔍 Perfect For:
• Forex traders tracking major currency pairs
• Crypto traders navigating 24/7 markets
• Gold and commodity traders
• Day traders optimizing their trading schedule
• Swing traders planning optimal entry/exit days
📊 Data-Driven Decisions:
The indicator maintains a rolling 3-month window of data, providing fresh, relevant insights while filtering out outdated patterns. Each day's analysis is based on actual market movements, giving you reliable, actionable intelligence for your trading decisions.
⚡ Pro Tip: Use this indicator alongside your existing strategy to enhance your trading plan and improve your timing. The color-coded visual system makes it easy to spot patterns at a glance, while the detailed statistics table provides the hard numbers you need for precise planning.
Remember: Markets evolve, and this indicator helps you stay on top of changing patterns in real-time. Whether you're trading traditional markets or crypto, understanding daily volatility patterns is crucial for consistent trading success.

Adaptive Fibonacci Volatility Bands (AFVB)
**Adaptive Fibonacci Volatility Bands (AFVB)**
### **Overview**
The **Adaptive Fibonacci Volatility Bands (AFVB)** indicator enhances standard **Fibonacci retracement levels** by dynamically adjusting them based on market **volatility**. By incorporating **ATR (Average True Range) adjustments**, this indicator refines key **support and resistance zones**, helping traders identify **more reliable entry and exit points**.
**Key Features:**
- **ATR-based adaptive Fibonacci levels** that adjust to changing market volatility.
- **Buy and Sell signals** based on price interactions with dynamic support/resistance.
- **Toggleable confirmation filter** for refining trade signals.
- **Customizable color schemes** and alerts.
---
## **How This Indicator Works**
The **AFVB** operates in three main steps:
### **1️⃣ Detecting Key Fibonacci Levels**
The script calculates **swing highs and swing lows** using a user-defined lookback period. From this, it derives **Fibonacci retracement levels**:
- **0% (High)**
- **23.6%**
- **38.2%**
- **50% (Mid-Level)**
- **61.8%**
- **78.6%**
- **100% (Low)**
### **2️⃣ Adjusting for Market Volatility**
Instead of using **fixed retracement levels**, this indicator incorporates an **ATR-based adjustment**:
- **Resistance levels** shift **upward** based on ATR.
- **Support levels** shift **downward** based on ATR.
- This makes levels more **responsive** to price action.
### **3️⃣ Generating Buy & Sell Signals**
AFVB provides **two types of signals** based on price interactions with key levels:
✔ **Buy Signal**:
Occurs when price **dips below** a support level (78.6% or 100%) and **then closes back above it**.
- **Optionally**, a confirmation buffer can be enabled to require price to close **above an additional threshold** (based on ATR).
✔ **Sell Signal**:
Triggered when price **breaks above a resistance level** (0% or 23.6%) and **then closes below it**.
📌 **Important:**
- The **buy threshold setting** allows traders to **fine-tune** entry conditions.
- Turning this setting **off** generates **more frequent** buy signals.
- Keeping it **on** reduces false signals but may result in **fewer trade opportunities**.
---
## **How to Use This Indicator in Trading**
### 🔹 **Entry Strategy (Buying)**
1️⃣ Look for **buy signals** at the **78.6% or 100% Fibonacci levels**.
2️⃣ Ensure price **closes above** the support level before entering a long trade.
3️⃣ **Enable or disable** the buy threshold filter depending on desired trade strictness.
### 🔹 **Exit Strategy (Selling)**
1️⃣ Watch for **sell signals** at the **0% or 23.6% Fibonacci levels**.
2️⃣ If price **breaks above resistance and then closes below**, consider exiting long positions.
3️⃣ Can be used **alone** or **combined with trend confirmation tools** (e.g., moving averages, RSI).
### 🔹 **Using the Toggleable Buy Threshold**
- **ON**: Buy signal requires **extra confirmation** (reduces false signals but fewer trades).
- **OFF**: Buy triggers as soon as price **closes back above support** (more signals, but may include weaker setups).
---
## **User Inputs**
### **🔧 Customization Options**
- **ATR Length**: Defines the period for **ATR calculation**.
- **Swing Lookback**: Determines how far back to find **swing highs and lows**.
- **ATR Multiplier**: Adjusts the size of **volatility-based modifications**.
- **Buy/Sell Threshold Factor**: Fine-tunes the **entry signal strictness**.
- **Show Level Labels**: Enables/disables **Fibonacci level annotations**.
- **Color Settings**: Customize **support/resistance colors**.
### **📢 Alerts**
AFVB includes built-in **alert conditions** for:
- **Buy Signals** ("AFVB BUY SIGNAL - Possible reversal at support")
- **Sell Signals** ("AFVB SELL SIGNAL - Possible reversal at resistance")
- **Any Signal Triggered** (Useful for automated alerts)
---
## **Who Is This Indicator For?**
✅ **Scalpers & Day Traders** – Helps identify **short-term reversals**.
✅ **Swing Traders** – Useful for **buying dips** and **selling rallies**.
✅ **Trend Traders** – Can be combined with **momentum indicators** for confirmation.
**Best Timeframes:**
⏳ **15-minute, 1-hour, 4-hour, Daily charts** (works across multiple assets).
---
## **Limitations & Considerations**
🚨 **Important Notes**:
- **No indicator guarantees profits**. Always **combine** it with **risk management strategies**.
- Works best **in trending & mean-reverting markets**—may generate false signals in **choppy conditions**.
- Performance may vary across **different assets & timeframes**.
📢 **Backtesting is recommended** before using it for live trading.

Fractal Breakout Trend Following System█ OVERVIEW
The Fractal Breakout Trend Following System is a custom technical analysis tool designed to pinpoint significant fractal pivot points and breakout levels. By analyzing price action through configurable pivot parameters, this indicator dynamically identifies key support and resistance zones. It not only marks crucial highs and lows on the chart but also signals potential trend reversals through real-time breakout detections, helping traders capture shifts in market momentum.
█ KEY FEATURES
Fractal Pivot Detection
Utilizes user-defined left and right pivot lengths to detect local highs (pivot highs) and lows (pivot lows). This fractal-based approach ensures that only meaningful price moves are considered, effectively filtering out minor market noise.
Dynamic Line Visualization
Upon confirmation of a pivot, the system draws a dynamic line representing resistance (from pivot highs) or support (from pivot lows). These lines extend across the chart until a breakout occurs, offering a continuous visual guide to key levels.
Trend Breakout Signals
Monitors for price crossovers relative to the drawn pivot lines. A crossover above a resistance line signals a bullish breakout, while a crossunder below a support line indicates a bearish move, thus updating the prevailing trend.
Pivot Labelling
Assigns labels such as "HH", "LH", "LL", or "HL" to detected pivots based on their relative values.
It uses the following designations:
HH (Higher High) : Indicates that the current pivot high is greater than the previous pivot high, suggesting continued upward momentum.
LH (Lower High) : Signals that the current pivot high is lower than the previous pivot high, which may hint at a potential reversal within an uptrend.
LL (Lower Low) : Shows that the current pivot low is lower than the previous pivot low, confirming sustained downward pressure.
HL (Higher Low) : Reveals that the current pivot low is higher than the previous pivot low, potentially indicating the beginning of an upward reversal in a downtrend.
These labels provide traders with immediate insight into the market structure and recent price behavior.
Customizable Visual Settings
Offers various customization options:
• Adjust pivot sensitivity via left/right pivot inputs.
• Toggle pivot labels on or off.
• Enable background color changes to reflect bullish or bearish trends.
• Choose preferred colors for bullish (e.g., green) and bearish (e.g., red) signals.
█ UNDERLYING METHODOLOGY & CALCULATIONS
Fractal Pivot Calculation
The script employs a sliding window technique using configurable left and right parameters to identify local highs and lows. Detected pivot values are sanitized to ensure consistency in subsequent calculations.
Dynamic Line Plotting
When a new pivot is detected, a corresponding line is drawn from the pivot point. This line extends until the price breaks the level, at which point it is reset. This method provides a continuous reference for support and resistance.
Trend Breakout Identification
By continuously monitoring price interactions with the pivot lines, the indicator identifies breakouts. A price crossover above a resistance line suggests a bullish breakout, while a crossunder below a support line indicates a bearish shift. The current trend is updated accordingly.
Pivot Label Assignment
The system compares the current pivot with the previous one to determine if the move represents a higher high, lower high, higher low, or lower low. This classification helps traders understand the underlying market momentum.
█ HOW TO USE THE INDICATOR
1 — Apply the Indicator
• Add the Fractal Breakout Trend Following System to your chart to begin visualizing dynamic pivot points and breakout signals.
2 — Adjust Settings for Your Market
• Pivot Detection – Configure the left and right pivot lengths for both highs and lows to suit your desired sensitivity:
- Use shorter lengths for more responsive signals in fast-moving markets.
- Use longer lengths to filter out minor fluctuations in volatile conditions.
• Visual Customization – Toggle the display of pivot labels and background color changes. Select your preferred colors for bullish and bearish trends.
3 — Interpret the Signals
• Support & Resistance Lines – Observe the dynamically drawn lines that represent key pivot levels.
• Pivot Labels – Look for labels like "HH", "LH", "LL", and "HL" to quickly assess market structure and trend behavior.
• Trend Signals – Watch for price crossovers and corresponding background color shifts to gauge bullish or bearish breakouts.
4 — Integrate with Your Trading Strategy
• Use the identified pivot points as potential support and resistance levels.
• Combine breakout signals with other technical indicators for comprehensive trade confirmation.
• Adjust the sensitivity settings to tailor the indicator to various instruments and market conditions.
█ CONCLUSION
The Fractal Breakout Trend Following System offers a robust framework for identifying critical fractal pivot points and potential breakout opportunities. With its dynamic line plotting, clear pivot labeling, and customizable visual settings, this indicator equips traders with actionable insights to enhance decision-making and optimize entry and exit strategies.

RSI Trend Bias█ OVERVIEW
The RSI Trend Bias indicator is a custom technical analysis tool that utilizes the Relative Strength Index (RSI) to gauge market momentum and identify potential trend shifts. By monitoring RSI crossovers and crossunders relative to customizable threshold levels, the indicator provides clear visual cues that distinguish between bullish and bearish market conditions. This flexible approach makes it suitable for both short-term scalping and longer-term trend analysis.
█ KEY FEATURES
Dynamic RSI Trend Detection
The indicator dynamically determines market bias by monitoring the RSI for crossovers above the upper threshold and crossunders below the lower threshold. This method ensures that only significant momentum shifts trigger a change in trend, reducing false signals in volatile markets.
Adaptive Visualizations
The RSI Trend Bias indicator enhances clarity by plotting the RSI with colors that reflect current market conditions. Additionally, it offers an optional background color change to further emphasize bullish or bearish states, providing immediate visual feedback to traders.
Clear Threshold Indicators
Upper and lower threshold levels are plotted as constant reference lines, clearly delineating overbought and oversold regions. These markers help traders quickly assess market conditions at a glance.
Customizable Settings
Users have full control over key parameters including the RSI length, threshold levels, and visual settings. This customization allows the indicator to be tailored for different markets and trading styles, ensuring optimal performance across various timeframes.
█ UNDERLYING METHODOLOGY & CALCULATIONS
RSI Calculation
The indicator computes the Relative Strength Index over a user-defined period (default is 14), providing a measure of market momentum that reflects price changes over time.
Trend Determination Logic
By detecting when the RSI crosses above the upper threshold, the indicator signals a shift towards bullish momentum. Conversely, a crossunder below the lower threshold indicates bearish conditions. This straightforward binary approach filters out minor fluctuations, ensuring clarity in trend analysis.
Visual Signal Integration
Based on the detected trend, the RSI line is dynamically colored—green for bullish conditions and red for bearish conditions. An optional background color change further reinforces these signals, offering an immediate visual cue of prevailing market sentiment.
█ HOW TO USE THE INDICATOR
1 — Apply the Indicator
• Add the RSI Trend Bias indicator to a separate pane in your trading platform.
2 — Adjust Settings for Your Market
• RSI Length – Define the period for RSI calculation (default is 14).
• Threshold Levels – Set the upper (default 70) and lower (default 30) thresholds to identify overbought and oversold conditions.
• Visual Customization – Choose the bullish (green) and bearish (red) colors, and enable background color changes to enhance visual trend recognition.
3 — Interpret the Signals
• RSI Line – Observe the dynamically colored RSI line; a shift to green signals bullish momentum, while red indicates bearish conditions.
• Threshold Levels – Use the constant upper and lower lines as reference points for overbought and oversold states.
• Signal Timing – A crossover above the upper threshold or a crossunder below the lower threshold suggests potential entry or exit points.
4 — Integrate with Your Trading Strategy
• Combine RSI Trend Bias signals with other technical analysis tools to confirm market direction.
• Utilize the visual cues for fine-tuning your entry and exit decisions, ensuring robust risk management and optimized trade timing.
█ CONCLUSION
The RSI Trend Bias indicator offers a streamlined yet effective approach to monitoring market momentum. By leveraging the established principles of RSI analysis alongside dynamic visual cues, it enables traders to quickly identify bullish and bearish trends. Its customizable features and clear threshold indicators make it a valuable tool for enhancing technical analysis and making informed trading decisions.

Percentage Based ZigZag█ OVERVIEW
The Percentage-Based ZigZag indicator is a custom technical analysis tool designed to highlight significant price reversals while filtering out market noise. Unlike many standard zigzag tools that rely solely on fixed price moves or generic trend-following methods, this indicator uses a configurable percentage threshold to dynamically determine meaningful pivot points. This approach not only adapts to different market conditions but also helps traders distinguish between minor fluctuations and truly significant trend shifts—whether scalping on shorter timeframes or analyzing longer-term trends.
█ KEY FEATURES & ORIGINALITY
Dynamic Pivot Detection
The indicator identifies pivot points by measuring the percentage change from the previous extreme (high or low). Only when this change exceeds a user-defined threshold is a new pivot recognized. This method ensures that only substantial moves are considered, making the indicator robust in volatile or noisy markets.
Enhanced ZigZag Visualization
By connecting significant highs and lows with a continuous line, the indicator creates a clear visual map of price swings. Each pivot point is labelled with the corresponding price and the percentage change from the previous pivot, providing immediate quantitative insight into the magnitude of the move.
Trend Reversal Projections
In addition to marking completed reversals, the script computes and displays potential future reversal points based on the current trend’s momentum. This forecasting element gives traders an advanced look at possible turning points, which can be particularly useful for short-term scalping strategies.
Customizable Visual Settings
Users can tailor the appearance by:
• Setting the percentage threshold to control sensitivity.
• Customizing colors for bullish (e.g., green) and bearish (e.g., red) reversals.
• Enabling optional background color changes that visually indicate the prevailing trend.
█ UNDERLYING METHODOLOGY & CALCULATIONS
Percentage-Based Filtering
The script continuously monitors price action and calculates the relative percentage change from the last identified pivot. A new pivot is confirmed only when the price moves a preset percentage away from this pivot, ensuring that minor fluctuations do not trigger false signals.
Pivot Point Logic
The indicator tracks the highest high and the lowest low since the last pivot. When the price reverses by the required percentage from these extremes, the algorithm:
1 — Labels the point as a significant high or low.
2 — Draws a connecting line from the previous pivot to the current one.
3 — Resets the extreme-tracking for detecting the next move.
Real-Time Reversal Estimation
Building on traditional zigzag methods, the script incorporates a projection calculation. By analyzing the current trend’s strength and recent percentage moves, it estimates where a future reversal might occur, offering traders actionable foresight.
█ HOW TO USE THE INDICATOR
1 — Apply the Indicator
• Add the Percentage-Based ZigZag indicator to your trading chart.
2 — Adjust Settings for Your Market
• Percentage Move – Set a threshold that matches your trading style:
- Lower values for sensitive, high-frequency analysis (ideal for scalping).
- Higher values for filtering out noise on longer timeframes.
• Visual Customization – Choose your preferred colors for bullish and bearish signals and enable background color changes for visual trend cues.
• Reversal Projection – Enable or disable the projection feature to display potential upcoming reversal points.
3 — Interpret the Signals
• ZigZag Lines – White lines trace significant high-to-low or low-to-high movements, visually connecting key swing points.
• Pivot Labels – Each pivot is annotated with the exact price level and percentage change, providing quantitative insight into market momentum.
• Trend Projections – When enabled, projected reversal levels offer insight into where the current trend might change.
4 — Integrate with Your Trading Strategy
• Use the indicator to identify support and resistance zones derived from significant pivots.
• Combine the quantitative data (percentage changes) with your risk management strategy to set optimal stop-loss and take-profit levels.
• Experiment with different threshold settings to adapt the indicator for various instruments or market conditions.
█ CONCLUSION
The Percentage-Based ZigZag indicator goes beyond traditional trend-following tools by filtering out market noise and providing clear, quantifiable insights into price action. With its percentage threshold for pivot detection and real-time reversal projections, this original methodology and customizable feature set offer traders a versatile edge for making informed trading decisions.

[SHORT ONLY] Consecutive Bars Above MA Strategy█ STRATEGY DESCRIPTION
The "Consecutive Bars Above MA Strategy" is a contrarian trading system aimed at exploiting overextended bullish moves in stocks and ETFs. It monitors the number of consecutive bars that close above a chosen short-term moving average (which can be either a Simple Moving Average or an Exponential Moving Average). Once the count reaches a preset threshold and the current bar’s close exceeds the previous bar’s high within a designated trading window, a short entry is initiated. An optional EMA filter further refines entries by requiring that the current close is below the 200-period EMA, helping to ensure that trades are taken in a bearish environment.
█ HOW ARE THE CONSECUTIVE BULLISH COUNTS CALCULATED?
The strategy utilizes a counter variable, `bullCount`, to track consecutive bullish bars based on their relation to the short-term moving average. Here’s how the count is determined:
Initialize the Counter
The counter is initialized at the start:
var int bullCount = na
Bullish Bar Detection
For each bar, if the close is above the selected moving average (either SMA or EMA, based on user input), the counter is incremented:
bullCount := close > signalMa ? (na(bullCount) ? 1 : bullCount + 1) : 0
Reset on Non-Bullish Condition
If the close does not exceed the moving average, the counter resets to zero, indicating a break in the consecutive bullish streak.
█ SIGNAL GENERATION
1. SHORT ENTRY
A short signal is generated when:
The number of consecutive bullish bars (i.e., bars closing above the short-term MA) meets or exceeds the defined threshold (default: 3).
The current bar’s close is higher than the previous bar’s high.
The signal occurs within the specified trading window (between Start Time and End Time).
Additionally, if the EMA filter is enabled, the entry is only executed when the current close is below the 200-period EMA.
2. EXIT CONDITION
An exit signal is triggered when the current close falls below the previous bar’s low, prompting the strategy to close the short position.
█ ADDITIONAL SETTINGS
Threshold: The number of consecutive bullish bars required to trigger a short entry (default is 3).
Trading Window: The Start Time and End Time inputs define when the strategy is active.
Moving Average Settings: Choose between SMA and EMA, and set the MA length (default is 5), which is used to assess each bar’s bullish condition.
EMA Filter (Optional): When enabled, this filter requires that the current close is below the 200-period EMA, supporting entries in a downtrend.
█ PERFORMANCE OVERVIEW
This strategy is designed for stocks and ETFs and can be applied across various timeframes.
It seeks to capture mean reversion by shorting after a series of bullish bars suggests an overextended move.
The approach employs a contrarian short entry by waiting for a breakout (close > previous high) following consecutive bullish bars.
The adjustable moving average settings and optional EMA filter allow for further optimization based on market conditions.
Comprehensive backtesting is recommended to fine-tune the threshold, moving average parameters, and filter settings for optimal performance.

Month of Year Performance█ OVERVIEW
The Month of Year Performance indicator is designed to visualize and compare the cumulative percentage change for each month of the year. By aggregating monthly returns, it helps uncover seasonal trends and potential anomalies in financial markets.
In financial analysis, a calendar based anomaly refers to recurring patterns or tendencies associated with specific time periods, such as days of the week. By calculating the cumulative percentage change for each month (January through December) and displaying the results both graphically and in a summary table, this indicator helps identify whether certain months
consistently outperform others.
█ FEATURES
Customisable time window via Time Settings.
Calculates cumulative percentage change for each month (January to December) separately.
Built-in error check to ensure the indicator is applied on a Monthly timeframe.
Distinct visual representation for each month using unique colours.
Customisable table settings including location and font size.
Displays a performance summary table with metrics such as performance, average return, % positive, and count.
█ HOW TO USE
Add the indicator to a chart set to a Monthly timeframe.
Select your desired Start Time and End Time in the Time Settings.
Toggle the performance table on or off in the Table Settings.
Adjust the table’s location and font size as needed.
View the cumulative monthly performance plotted in distinct colours.
Colour Scheme:
January: Blue
February: Red
March: Green
April: Orange
May: Purple
June: Fuchsia
July: Teal
August: Yellow
September: Navy
October: Lime
November: Maroon
December: Aqua

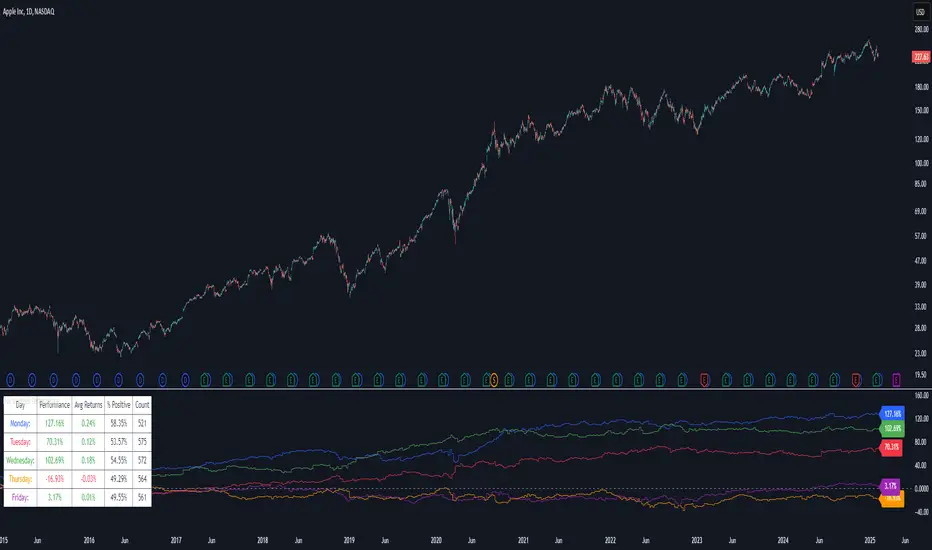
Day of Week Performance█ OVERVIEW
The Day of Week Performance indicator is designed to visualise and compare the cumulative percentage change for each day of the week. This indicator explores one of the many calendar based anomalies in financial markets.
In financial analysis, a calendar based anomaly refers to recurring patterns or tendencies associated with specific time periods, such as days of the week. By calculating the cumulative percentage change for each day (Monday through Friday) and displaying the results both graphically and in a summary table, this indicator helps identify whether certain days consistently outperform others.
█ FEATURES
Customisable time window via Time Settings.
Calculates cumulative percentage change for each day (Monday to Friday) separately.
Option to use Sunday instead of Friday for CFDs and Futures analysis.
Distinct visual representation for each day using unique colours.
Customisable table settings including position and font size.
Built-in error checks to ensure the indicator is applied on a Daily timeframe.
█ HOW TO USE
Add the indicator to a chart set to a Daily timeframe.
Select your desired Start Time and End Time in the Time Settings.
Toggle the performance table on or off in the Table Settings.
Adjust the table’s location and font size as needed.
Use the "Use Sunday instead of Friday" option if your market requires it.
View the cumulative performance plotted in distinct colours.
Colour Scheme:
Monday: Blue
Tuesday: Red
Wednesday: Green
Thursday: Orange
Friday: Purple
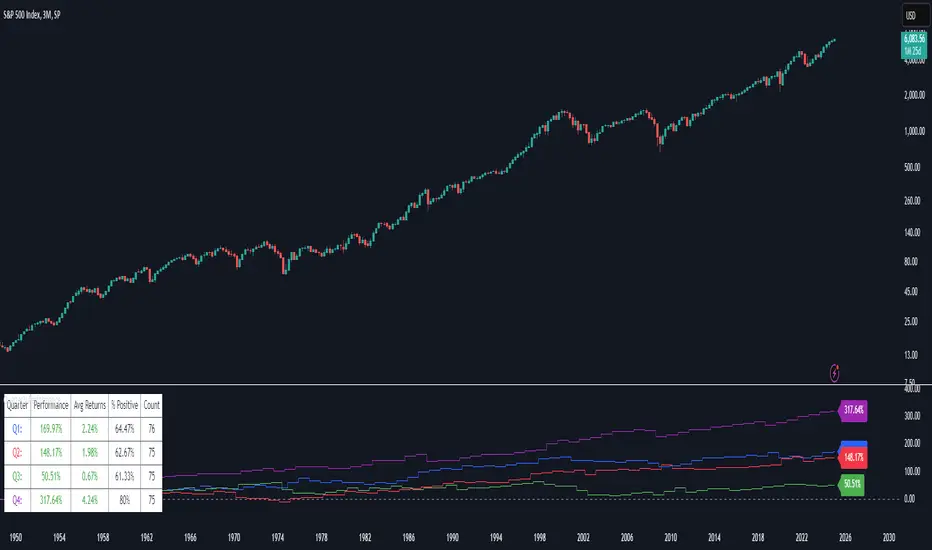
Quarterly Performance█ OVERVIEW
The Quarterly Performance indicator is designed to visualise and compare the performance of different Quarters of the year. This indicator explores one of the many calendar based anomalies that exist in financial markets.
In the context of financial analysis, a calendar based anomaly refers to patterns or tendencies that are linked to specific time periods, such as days of the week, weeks of the month, or months of the year. This indicator helps explore whether such a calendar based anomaly exists between quarters.
By calculating cumulative quarterly performance and counting the number of quarters with positive returns, it provides a clear snapshot of whether one set of quarters tends to outperform the others, potentially highlighting a calendar based anomaly if a significant difference is observed.
█ FEATURES
Customisable time window through input settings.
Tracks cumulative returns for each quarter separately.
Easily adjust table settings like position and font size via input options.
Clear visual distinction between quarterly performance using different colours.
Built-in error checks to ensure the indicator is applied to the correct timeframe.
█ HOW TO USE
Add the indicator to a chart with a 3 Month (Quarterly) timeframe.
Choose your start and end dates in the Time Settings.
Enable or disable the performance table in the Table Settings as needed.
View the cumulative performance, with Q1 in blue, Q2 in red, Q3 in green and Q4 in purple.
Even vs Odd Days Performance█ OVERVIEW
The Even vs Odd Days Performance indicator is designed to visualise and compare the performance of even-numbered days versus odd-numbered days. This indicator explores one of the many calendar based anomalies that exist in financial markets.
In the context of financial analysis, a calendar based anomaly refers to patterns or tendencies that are linked to specific time periods, such as days of the week, weeks of the month, or months of the year. This indicator helps explore whether such a calendar based anomaly exists between even and odd days.
By calculating cumulative daily performance and counting the number of days with positive returns, it provides a clear snapshot of whether one set of days tends to outperform the other, potentially highlighting a calendar based anomaly if a significant difference is observed.
█ FEATURES
Customisable time window through input settings.
Tracks cumulative returns for even and odd days separately.
Easily adjust table settings like position and font size via input options.
Clear visual distinction between even and odd day performance using different colours.
Built-in error checks to ensure the indicator is applied to the correct timeframe.
█ HOW TO USE
Add the indicator to a chart with a Daily timeframe.
Choose your start and end dates in the Time Settings.
Enable or disable the performance table in the Table Settings as needed.
View the cumulative performance, with even days in green and odd days in red.

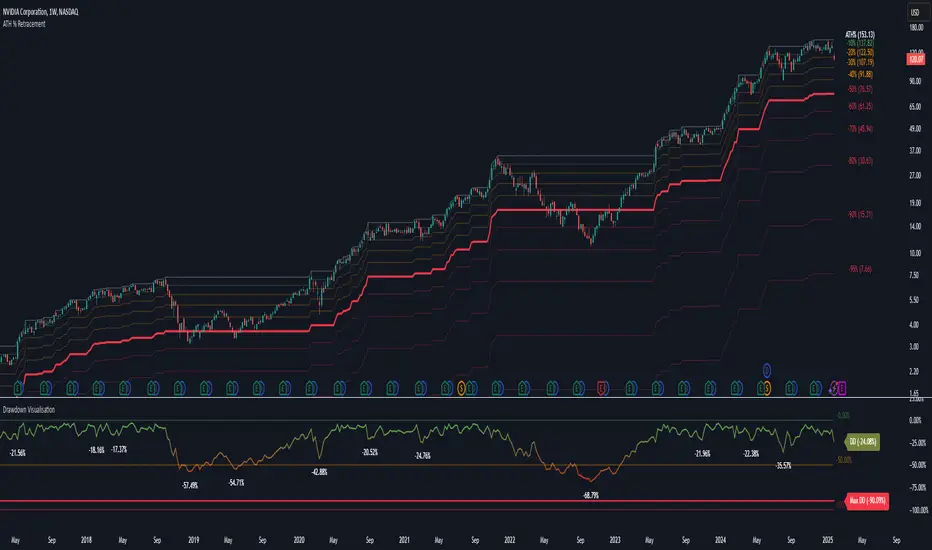
Drawdown Visualisation█ OVERVIEW
The Drawdown Visualisation indicator calculates and displays the instrument’s drawdown (in percent) relative to its all‐time high (ATH) from a user‐defined start date. It provides customisable options for label appearance, threshold lines (0%, –50%, –100%), and can plot historic drawdown levels via pivot detection.
█ USAGE
This indicator should be used with the Percentage Retracement from ATH indicator.
█ KEY FEATURES
Custom Date Settings — Use a custom start date so that only specified price action is considered.
Retracement Level Calculation — Determines ATH and computes multiple retracement levels using percentages from 0% to –100%.
Visual Signals and Customisation — Plots configurable horizontal lines and labels that display retracement percentages and prices.
Time Filtering — Bases calculations on data from the desired time period.
Historic Drawdowns — Display historical drawdowns
█ PURPOSE
Assist traders in visualising the depth of price retracements from recent or historical peaks.
Identify critical zones where the market may find support or resistance after reaching an ATH.
Facilitate more informed entry and exit decisions by clearly demarcating retracement levels on the chart.
█ IDEAL USERS
Swing Traders — Looking to exploit pullbacks following strong upward moves.
Technical Analysts — Interested in pinpointing key retracement levels as potential reversal or continuation points.
Price Action Traders — Focused on the nuances of market peaks and subsequent corrections.
Strategy Developers — Keen to backtest and refine approaches centred on retracement dynamics.
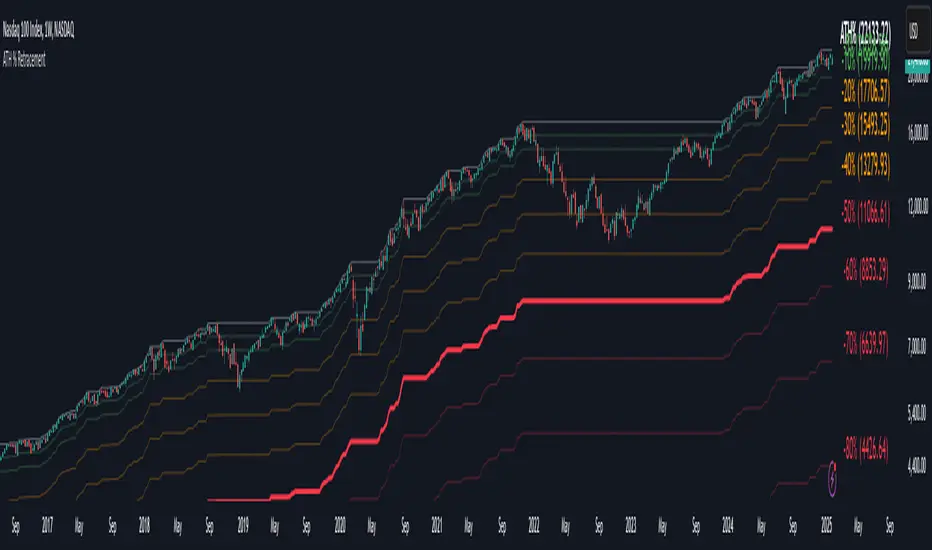
Percentage Retracement from ATH█ OVERVIEW
The Percentage Retracement from ATH indicator is a dynamic trading utility designed to help traders gauge market pullbacks from the peak price. By calculating key retracement levels based on the All-Time High (ATH) and user‑defined percentage inputs, it offers clear visual cues to assist in identifying potential support and resistance zones.
█ KEY FEATURES
Custom Date — Use a custom start date so the indicator only considers specified price action.
Retracement Calculation — Determines ATH and calculates levels based on user‑defined percentages (0% to –100%).
Visual Customisation — Plots configurable horizontal lines and labels showing retracement percentages and prices.
Time Filtering — Uses time filtering to base levels on the desired data period.
█ PURPOSE
Assist traders in visualising the depth of price retracements from recent or historical peaks.
Identify critical zones where the market may find support or resistance after reaching an ATH.
Facilitate more informed entry and exit decisions by clearly demarcating retracement levels on the chart.
█ IDEAL USERS
Swing Traders — Looking to exploit pullbacks following strong upward moves.
Technical Analysts — Interested in pinpointing key retracement levels as potential reversal or continuation points.
Price Action Traders — Focused on the nuances of market peaks and subsequent corrections.
Strategy Developers — Keen to backtest and refine approaches centred on retracement dynamics.
Power Trend [MacAlgo]Description:
The Power Trend Indicator is a sophisticated technical analysis tool that overlays on your trading charts to identify prevailing market trends. It utilizes a combination of ATR-based trend calculations, moving averages, volume analysis, and momentum indicators to generate reliable buy and sell signals. Additionally, it offers customizable settings to adapt to various trading styles and timeframes.
Key Features:
Adaptive ATR Calculation: Automatically adjusts the ATR (Average True Range) period and multiplier based on the selected timeframe for more accurate trend detection.
Dynamic Trend Lines: Plots continuous trend lines with color-coded bars to visually represent bullish and bearish trends.
Buy/Sell Signals: Generates standard and power buy/sell signals to help you make informed trading decisions.
Volume Analysis: Incorporates average buy and sell volumes to identify strong market movements.
Multiple Timeframe Support: Automatically adjusts the indicator's timeframe or allows for manual selection to suit your trading preferences.
Highlighting: Highlights trending bars for easy visualization of market conditions.
Alerts: Customizable alert conditions to notify you of potential trading opportunities in real-time.
How it Works:
1. ATR-Based Trend Calculation:
ATR Period & Multiplier: Calculates ATR based on user-defined periods and multipliers, dynamically adjusting according to the chart's timeframe.
Trend Determination: Identifies trends as bullish (1) or bearish (-1) based on price movements relative to ATR-based upper (up) and lower (dn) trend lines.
2. Moving Averages:
EMA & SMA: Calculates exponential and simple moving averages to smooth price data and identify underlying trends.
AlphaTrend Line: Combines a 50-period EMA and a 30-period SMA on a 4-hour timeframe to create the AlphaTrend line, providing a robust trend reference.
3. Volume Analysis:
Buy/Sell Volume: Differentiates between buy and sell volumes to gauge market strength.
Average Volume: Compares current volume against average buy/sell volumes to detect significant market movements.
4. Momentum Indicators:
RSI, MACD, OBV: Incorporates Relative Strength Index (RSI), Moving Average Convergence Divergence (MACD), and On-Balance Volume (OBV) to assess momentum and confirm trend strength.
5. Signal Generation:
Standard Signals: Basic buy and sell signals based on trend crossovers.
Power Signals: Enhanced signals requiring multiple conditions (e.g., increased volume, momentum confirmation) for higher confidence trades.
Customization Options:
Tailor the Power Trend Indicator to your specific trading needs with the following settings:
ATR Period: Set the period for ATR calculation (default: 8).
ATR Multiplier: Adjust the ATR multiplier to fine-tune trend sensitivity (default: 3.0).
Source: Choose the price source (e.g., HL2, Close) for calculations.
Change ATR Calculation Method: Toggle between different ATR calculation methods.
Show Buy/Sell Signals: Enable or disable the display of buy and sell signals on the chart.
Highlighting: Turn on or off the bar highlighting feature.
Timeframe Adjustment: Choose between automatic timeframe adjustment or manually set
the indicator's timeframe.
Manual Indicator Timeframe: If manual adjustment is selected, specify the desired timeframe (default: 60 minutes).
Visual Components:
Trend Lines: Continuous lines representing the current trend, color-coded for easy identification (green for bullish, red for bearish, orange for neutral).
Bar Coloring: Bars are colored based on the current trend and its relationship to the AlphaTrend line.
Buy/Sell Triangles: Triangular markers appear on the chart to indicate buy and sell signals.
Power Signals: Larger triangles highlight strong buy and sell opportunities based on multiple confirming factors.
Highlighting: Transparent overlays highlight trending areas to enhance visual clarity.
Alerts:
Stay informed with customizable alerts that notify you of important market movements:
SuperTrend Buy/Sell: Alerts when standard buy or sell signals are generated.
Power Buy/Sell Alerts: Notifications for strong buy or sell signals based on comprehensive conditions.
Trend Direction Change: Alerts when the trend changes from bullish to bearish or vice versa.
How to Use:
Add to Chart: Apply the Power Trend Indicator to your preferred trading chart on TradingView.
Configure Settings: Adjust the input parameters to match your trading style and the timeframe you are analyzing.
Analyze Trends: Observe the trend lines, bar colors, and AlphaTrend line to understand the current market trend.
Follow Signals: Look for buy and sell signals or power signals to identify potential entry and exit points.
Set Alerts: Enable alerts to receive real-time notifications of significant trading opportunities.
Adjust as Needed: Fine-tune the settings based on market conditions and your trading experience.
Important Notes:
Backtesting: While the Power Trend Indicator is built using robust technical analysis principles, it's essential to backtest and validate its performance within your trading strategy.
Market Conditions: The indicator performs best in trending markets. In sideways or highly volatile markets, signal reliability may vary.
Risk Management: Always employ proper risk management techniques when trading based on indicator signals to protect your capital.
Disclaimer:
This indicator is intended for educational purposes only and does not provide financial advice or guarantee future performance. Trading involves risk, and past results are not indicative of future outcomes. Always conduct your own analysis and risk management.

RSI & DPO support/resistanceThis indicator combines the Relative Strength Index (RSI) to identify overbought and oversold conditions with the Detrended Price Oscillator (DPO) to highlight support and resistance levels.
Unlike traditional indicators that display these metrics in a separate window, this tool integrates them directly onto the main price chart.
This allows for a more cohesive analysis, enabling traders to easily visualize the relationship between price movements and momentum indicators in one unified view.
How to Use It:
Identify Overbought and Oversold Conditions:
Look for RSI values above 70 to identify overbought conditions, suggesting a potential price reversal or pullback. Conversely, RSI values below 30 indicate oversold conditions, which may signal a potential price bounce or upward movement.
Analyze Support and Resistance Levels:
Observe the DPO lines on the main chart to identify key support and resistance levels. When the price approaches these levels, it can provide insights into potential price reversals or breakouts.
Combine Signals for Trading Decisions:
Use the RSI and DPO signals together to make informed trading decisions. For example, if the RSI indicates an overbought condition while the price is near a resistance level identified by the DPO, it may be a good opportunity to consider selling or taking profits.
Monitor Divergences:
Watch for divergences between the RSI and price movements. If the price is making new highs while the RSI is not, it could indicate weakening momentum and a potential reversal.
Set Alerts:
Consider setting alerts for when the RSI crosses above or below the overbought or oversold thresholds, or when the price approaches significant support or resistance levels indicated by the DPO.
Practice Risk Management:
Always use proper risk management techniques, such as setting stop-loss orders and position sizing, to protect your capital while trading based on these indicators.
By following these steps, traders can effectively utilize this indicator to enhance their market analysis and improve their trading strategies.

Choppiness IndexThis Pine Script v6 indicator calculates the Choppiness Index over a user-defined length and segments it based on user-defined thresholds for choppy and trending market conditions. The indicator allows users to toggle the visibility of choppy, trending, and neutral segments using checkboxes.
Here's how it works:
Inputs: Users can set the length for the Choppiness Index calculation and thresholds for choppy and trending conditions. They can also choose which segments to display.
Choppiness Index Calculation: The script calculates the Choppiness Index using the ATR and the highest-high and lowest-low over the specified length.
Segment Determination: The script determines which segment the current Choppiness Index value falls into based on the thresholds. The color changes exactly at the threshold values.
Dynamic Plotting: The Choppiness Index is plotted with a color that changes based on the segment. The plot is only visible if the segment is "turned on" by the user.
Threshold Lines: Dashed horizontal lines are plotted at the choppy and trending thresholds for reference.
This indicator helps traders visualize market conditions and identify potential transitions between choppy and trending phases, with precise color changes at the threshold values.

Monthly DividerThis Trading View indicator visually marks the beginning of each month starting from January 2024. It draws vertical lines on the chart at the start of each month and labels them with the corresponding month abbreviation (e.g., "Jan", "Feb"). Users can customize the color and thickness of the lines through the indicator settings, allowing for personalized chart aesthetics. This tool is ideal for traders and analysts who want to easily identify month transitions and enhance their technical analysis.

Bearish Wick Reversal█ STRATEGY OVERVIEW
The "Bearish Wick Reversal Strategy" identifies potential bullish reversals following significant bearish price rejection (long lower wicks). This counter-trend approach enters long positions when bearish candles show exaggerated downside wicks relative to closing prices, then exits on bullish confirmation signals. Includes optional EMA trend filtering for improved reliability.
█ What is a Bearish Wick?
A price rejection pattern where:
Bearish candle (close < open) forms with extended lower wick
Wick represents failed selloff: Low drops significantly below close
Measured as: (Low - Close)/Close × 100 (Negative percentage indicates downward extension)
█ SIGNAL GENERATION
1. LONG ENTRY CONDITION
Bearish candle forms with close < open
Lower wick exceeds user-defined threshold (Default: -1% of close price)
The signal occurs within the specified time window
If enabled, the close price must also be above the 200-period EMA (Exponential Moving Average)
2. EXIT CONDITION
A Sell Signal is generated when the current closing price exceeds the highest high of the previous seven bars (`close > _highest `). This indicates that the price has shown strength, potentially confirming the reversal and prompting the strategy to exit the position.
█ PERFORMANCE OVERVIEW
Ideal Market: Volatile instruments with frequent price rejections
Key Risk: False signals in sustained bearish trends
Optimization Tip: Test various thresholds
Filter Impact: EMA reduces trades but improves win rate and reduces drawdown

Gap Down Reversal Strategy█ STRATEGY OVERVIEW
The "Gap Down Reversal Strategy" capitalizes on price recovery patterns following bearish gap-down openings. This mean-reversion approach enters long positions on confirmed intraday recoveries and exits when prices breach previous session highs. This strategy is NOT optimized.
█ What is a Gap Down Reversal?
A gap down reversal occurs when:
An instrument opens significantly below its prior session's low (price gap)
Selling pressure exhausts itself during the session
Buyers regain control, pushing price back above the opening level
Creates a candlestick with:
• Open < Prior Session Low (true gap)
• Close > Open (bullish reversal candle)
█ SIGNAL GENERATION
1. LONG ENTRY CONDITION
Previous candle closes BELOW its opening price (bearish candle)
Current session opens BELOW prior candle's low (gap down)
Current candle closes ABOVE its opening price (bullish reversal)
Executes market order at session close
2. EXIT CONDITION
A Sell Signal is generated when the current closing price exceeds the highest high of the previous seven bars (`close > _highest `). This indicates that the price has shown strength, potentially confirming the reversal and prompting the strategy to exit the position.
█ PERFORMANCE OVERVIEW
Ideal Market: High volatility instruments with frequent gaps
Key Risk: False reversals in sustained downtrends
Optimization Tip: Test varying gap thresholds (1-3% ranges)

SPY/TLT Strategy█ STRATEGY OVERVIEW
The "SPY/TLT Strategy" is a trend-following crossover strategy designed to trade the relationship between TLT and its Simple Moving Average (SMA). The default configuration uses TLT (iShares 20+ Year Treasury Bond ETF) with a 20-period SMA, entering long positions on bullish crossovers and exiting on bearish crossunders. **This strategy is NOT optimized and performs best in trending markets.**
█ KEY FEATURES
SMA Crossover System: Uses price/SMA relationship for signal generation (Default: 20-period)
Dynamic Time Window: Configurable backtesting period (Default: 2014-2099)
Equity-Based Position Sizing: Default 100% equity allocation per trade
Real-Time Visual Feedback: Price/SMA plot with trend-state background coloring
Event-Driven Execution: Processes orders at bar close for accurate backtesting
█ SIGNAL GENERATION
1. LONG ENTRY CONDITION
TLT closing price crosses ABOVE SMA
Occurs within specified time window
Generates market order at next bar open
2. EXIT CONDITION
TLT closing price crosses BELOW SMA
Closes all open positions immediately
█ ADDITIONAL SETTINGS
SMA Period: Simple Moving Average length (Default: 20)
Start Time and End Time: The time window for trade execution (Default: 1 Jan 2014 - 1 Jan 2099)
Security Symbol: Ticker for analysis (Default: TLT)
█ PERFORMANCE OVERVIEW
Ideal Market Conditions: Strong trending environments
Potential Drawbacks: Whipsaws in range-bound markets
Backtesting results should be analyzed to optimize the MA Period and EMA Filter settings for specific instruments

3 Down, 3 Up Strategy█ STRATEGY DESCRIPTION
The "3 Down, 3 Up Strategy" is a mean-reversion strategy designed to capitalize on short-term price reversals. It enters a long position after consecutive bearish closes and exits after consecutive bullish closes. This strategy is NOT optimized and can be used on any timeframes.
█ WHAT ARE CONSECUTIVE DOWN/UP CLOSES?
- Consecutive Down Closes: A sequence of trading bars where each close is lower than the previous close.
- Consecutive Up Closes: A sequence of trading bars where each close is higher than the previous close.
█ SIGNAL GENERATION
1. LONG ENTRY
A Buy Signal is triggered when:
The price closes lower than the previous close for Consecutive Down Closes for Entry (default: 3) consecutive bars.
The signal occurs within the specified time window (between Start Time and End Time).
If enabled, the close price must also be above the 200-period EMA (Exponential Moving Average).
2. EXIT CONDITION
A Sell Signal is generated when the price closes higher than the previous close for Consecutive Up Closes for Exit (default: 3) consecutive bars.
█ ADDITIONAL SETTINGS
Consecutive Down Closes for Entry: Number of consecutive lower closes required to trigger a buy. Default = 3.
Consecutive Up Closes for Exit: Number of consecutive higher closes required to exit. Default = 3.
EMA Filter: Optional 200-period EMA filter to confirm long entries in bullish trends. Default = disabled.
Start Time and End Time: Restrict trading to specific dates (default: 2014-2099).
█ PERFORMANCE OVERVIEW
Designed for volatile markets with frequent short-term reversals.
Performs best when price oscillates between clear support/resistance levels.
The EMA filter improves reliability in trending markets but may reduce trade frequency.
Backtest to optimize consecutive close thresholds and EMA period for specific instruments.

RSI OB/OS Strategy Analyzer█ OVERVIEW
The RSI OB/OS Strategy Analyzer is a comprehensive trading tool designed to help traders identify and evaluate overbought/oversold reversal opportunities using the Relative Strength Index (RSI). It provides visual signals, performance metrics, and a detailed table to analyze the effectiveness of RSI-based strategies over a user-defined lookback period.
█ KEY FEATURES
RSI Calculation
Calculates RSI with customizable period (default 14)
Plots dynamic overbought (70) and oversold (30) levels
Adds background coloring for OB/OS regions
Reversal Signals
Identifies signals based on RSI crossing OB/OS levels
Two entry strategies available:
Revert Cross: Triggers when RSI exits OB/OS zone
Cross Threshold: Triggers when RSI enters OB/OS zone
Trade Direction
Users can select a trade bias:
Long: Focuses on oversold reversals (bullish signals)
Short: Focuses on overbought reversals (bearish signals)
Performance Metrics
Calculates three key statistics for each lookback period:
Win Rate: Percentage of profitable trades
Mean Return: Average return across all trades
Median Return: Median return across all trades
Metrics calculated as percentage changes from entry price
Visual Signals
Dual-layer signal display:
BUY: Green triangles + text labels below price
SELL: Red triangles + text labels above price
Semi-transparent background highlighting in OB/OS zones
Performance Table
Interactive table showing metrics for each lookback period
Color-coded visualization:
Win Rate: Gradient from red (low) to green (high)
Returns: Green for positive, red for negative
Time Filtering
Users can define a specific time window for the indicator to analyze trades, ensuring that performance metrics are calculated only for the desired period.
Customizable Display
Adjustable table font sizes: Auto/Small/Normal/Large
Toggle option for table visibility
█ PURPOSE
The RSI OB/OS Strategy Analyzer helps traders:
Identify mean-reversion opportunities through RSI extremes
Backtest entry strategy effectiveness across multiple time horizons
Optimize trade timing through visual historical performance data
Quickly assess strategy robustness with color-coded metrics
█ IDEAL USERS
Counter-Trend Traders: Looking to capitalize on RSI extremes
Systematic Traders: Needing quantitative strategy validation
Educational Users: Studying RSI behavior in different market conditions
Multi-Timeframe Analysts: Interested in forward returns analysis

Internal Bar Strength (IBS) Strategy█ STRATEGY DESCRIPTION
The "Internal Bar Strength (IBS) Strategy" is a mean-reversion strategy designed to identify trading opportunities based on the closing price's position within the daily price range. It enters a long position when the IBS indicates oversold conditions and exits when the IBS reaches overbought levels. This strategy was designed to be used on the daily timeframe.
█ WHAT IS INTERNAL BAR STRENGTH (IBS)?
Internal Bar Strength (IBS) measures where the closing price falls within the high-low range of a bar. It is calculated as:
IBS = (Close - Low) / (High - Low)
- **Low IBS (≤ 0.2)**: Indicates the close is near the bar's low, suggesting oversold conditions.
- **High IBS (≥ 0.8)**: Indicates the close is near the bar's high, suggesting overbought conditions.
█ SIGNAL GENERATION
1. LONG ENTRY
A Buy Signal is triggered when:
The IBS value drops below the Lower Threshold (default: 0.2).
The signal occurs within the specified time window (between `Start Time` and `End Time`).
2. EXIT CONDITION
A Sell Signal is generated when the IBS value rises to or above the Upper Threshold (default: 0.8). This prompts the strategy to exit the position.
█ ADDITIONAL SETTINGS
Upper Threshold: The IBS level at which the strategy exits trades. Default is 0.8.
Lower Threshold: The IBS level at which the strategy enters long positions. Default is 0.2.
Start Time and End Time: The time window during which the strategy is allowed to execute trades.
█ PERFORMANCE OVERVIEW
This strategy is designed for ranging markets and performs best when prices frequently revert to the mean.
It is sensitive to extreme IBS values, which help identify potential reversals.
Backtesting results should be analyzed to optimize the Upper/Lower Thresholds for specific instruments and market conditions.
