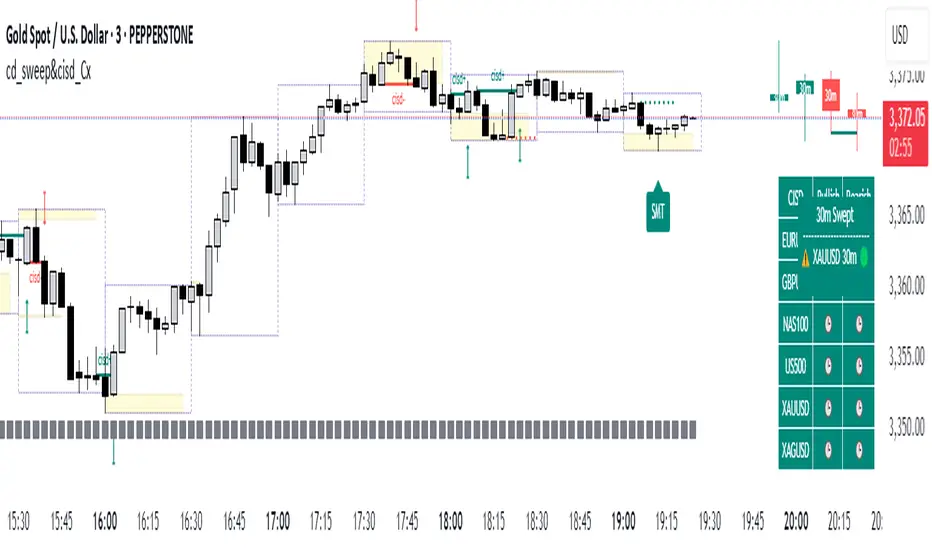
cd_sweep&cisd_CxOverview:
When the price is at a significant zone/level on a higher time frame (HTF), and it sweeps (breaks through and then closes back below/above) the high or low of the previous HTF candle, it is common to look for a Change in State of Delivery (CISD) on a lower time frame (LTF) to enter a trade.
This model can be summarized as:
HTF Sweep → LTF CISD (Optional: SMT / Divergences)
________________________________________
Working Principle & Details:
1. The indicator monitors price action on the selected HTF and tracks any sweep (violation) of the previous HTF candle's high or low. Simultaneously, it identifies CISD levels on the LTF. If SMT is enabled, it will appear as a label on the chart.
When both HTF sweep and LTF CISD conditions are met, the indicator marks the chart at the open of the next candle and triggers an alert if set.
CISD levels are tracked and updated whenever a new HTF high/low is formed.
2. The indicator monitors the formation of entry models on up to six selected pairs, displaying results in two separate tables:
o HTF Sweep Query Table: Monitors live HTF candles and reports pairs that meet the sweep condition.
o CISD Table: Displays the pairs where a valid entry model has formed. A "🔥" symbol indicates the condition has occurred.
3. Bias Visualization:
Based on the selected HTF, a visual band is shown at the bottom of the chart using the chosen bullish/bearish colors.
Bias is determined by:
o Candle closing above/below the previous one suggesting continuation.
o A failed close after a sweep implying potential reversal.
4. HTF Candles:
Displays HTF candles based on the user-defined time frame.
5. Optional SMT (Smart Money Technique):
Must be enabled in the menu and requires the correlated pair to be entered correctly for accurate results.
Displayed only as a visual confirmation, not a requirement for model formation.
If the currently open symbol sweeps the previous candle while the correlated symbol does not (or vice versa), an "SMT" label appears on the chart.
6. Color & Table Positioning:
Controlled via the settings menu.
________________________________________
Warnings:
• The indicator only marks CISDs that form at HTF high/low zones.
• Entering every time the model forms does not guarantee profitability.
• Waiting for the model to appear at significant HTF levels/zones increases the likelihood of success.
• HTF and LTF selections should follow commonly accepted combinations or user-tested time frames.
• If you want to trigger alerts only for symbols entered in the indicator, ensure the "Use indicator alerts" option is enabled.
• To set alerts for the TradingView watchlist instead, disable the "Use indicator alerts" option.
________________________________________
Feel free to share your thoughts and suggestions.
Happy trading! 💫
Sweep
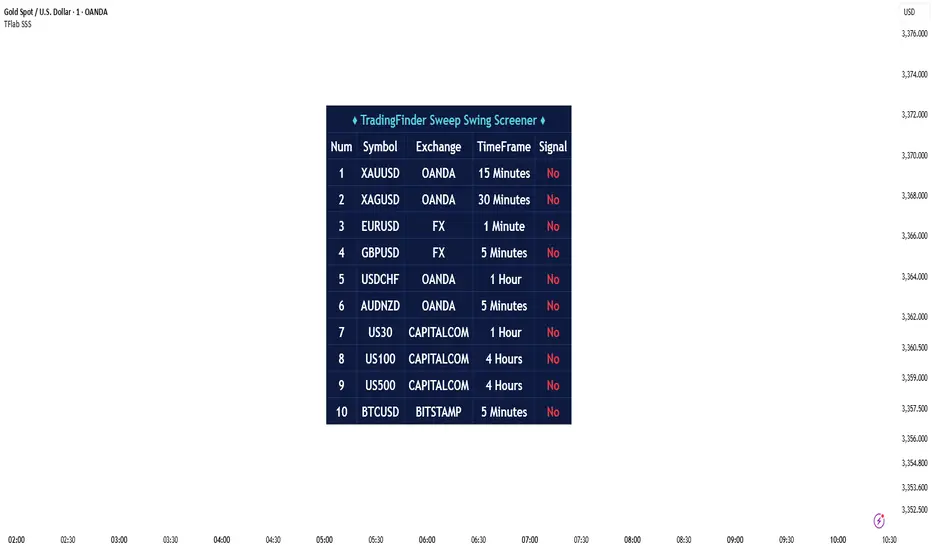
Sweep Swing Screener [TradingFinder]🔵 Introduction
Understanding how liquidity forms and how price reacts around key structural levels is essential for identifying precise, low-risk entry points. The Sweep Swing Screener is a specialized tool developed to continuously monitor market activity and detect liquidity sweeps, reaction zones, and valid confirmation candles across various trading instruments and timeframes.
This tool can be applied both to scan multiple symbols at once and to analyze all timeframes of a specific asset for potential reversal points. It begins by identifying a clear swing point, whether a swing high or a swing low, and then outlines a reaction zone between that level and either the highest or lowest value of the swing candle's open or close.
If the price revisits this zone, performs a liquidity grab, and prints an indecision candle like a doji or a narrow-bodied bar that closes within the zone, this may indicate a rejection of the level and the failure of a breakout attempt. At that moment, depending on the context, the screener may identify a bullish or bearish reversal and generate a corresponding Long or Short signal.
By emphasizing accurate entry timing, alignment with institutional order flow, and avoidance of common traps, this approach highlights market areas where liquidity engineering, reversal probability, and price inefficiency come together. As a result, the Sweep Swing Screener becomes a valuable part of any trader’s toolkit, particularly for those who rely on price action and liquidity logic to drive their decisions. It allows traders to focus on clean, actionable setups without getting lost in noise or misleading breakouts.
🔵 How to Use
The Sweep Swing Screener is designed to track market structure in real time and alert users when conditions for a potential reversal are present. Its methodology combines liquidity behavior with swing analysis and candle confirmation, all within predefined reaction zones.
To better understand this logic, consider a basic market flow where a swing high or low forms, followed by a return to that level. If the price sweeps the previous extreme and forms a confirming candle within the reaction zone, a signal is issued.
🟣 Long Signal
To identify a long setup, the screener looks for a valid swing low, often a level below which sell-side liquidity is likely to be clustered. Once found, it defines a reaction zone from the swing low to the lowest point between the candle’s open and close.
If the price returns to this area and creates a lower wick that extends beneath the swing low, the tool checks whether the price manages to close back inside the range, rejecting the breakdown. This indicates absorption of selling pressure and failure to sustain the move lower.
The screener then waits for a confirmation candle to appear. Typically, this is a doji or other small-bodied candle that closes inside the zone. If these conditions are met, the screener records a Long signal for that asset and, if enabled, sends a notification to alert the user.
🟣 Short Signal
For bearish setups, the screener begins by identifying a valid swing high, which usually marks a level where buy-side liquidity is concentrated. It then creates a reaction zone from the swing high to the highest point between the candle’s open and close.
When price returns to this level, sweeps above the swing high, and then fails to close higher, it may signal the presence of a bull trap and early exhaustion in the upward move.
A confirmation candle, usually a doji or a rejection bar that closes back within the zone, is then required. Once that occurs, the screener marks the asset with a Short signal and optionally sends a real-time alert to the user.
This type of setup helps highlight potential institutional sell zones, offering insight into where price is likely to reverse following a liquidity event.
🔵 Settings
🟣 Logical settings
Swing period : You can set the swing detection period.
Max Swing Back Method : It is in two modes "All" and "Custom". If it is in "All" mode, it will check all swings, and if it is in "Custom" mode, it will check the swings to the extent you determine.
Max Swing Back : You can set the number of swings that will go back for checking.
Maximum Distance Between Swing and Signal : The maximum number of candles allowed between the swing point and the potential signal. The default value is 50, ensuring that only recent and relevant price reactions are considered valid.
🟣 Display Settings
Table Size : Lets you adjust the table’s visual size with options such as: auto, tiny, small, normal, large, huge.
Table Position : Sets the screen location of the table. Choose from 9 possible positions, combining vertical (top, middle, bottom) and horizontal (left, center, right) alignments.
🟣 Symbol Settings
Each of the 10 symbol slots comes with a full set of customizable parameters :
Symbol : Define or select the asset (e.g., XAUUSD, BTCUSD, EURUSD, etc.).
Timeframe : Set your desired timeframe for each symbol (e.g., 15, 60, 240, 1D).
🟣 Alert Settings
Alert : Enables alerts for SSS.
Message Frequency : Determines the frequency of alerts. Options include 'All' (every function call), 'Once Per Bar' (first call within the bar), and 'Once Per Bar Close' (final script execution of the real-time bar). Default is 'Once per Bar'.
Show Alert Time by Time Zone : Configures the time zone for alert messages. Default is 'UTC'.
🔵 Conclusion
The Sweep Swing Screener provides a systematic method for identifying potential reversal zones by combining price structure, liquidity behavior, and candle-based confirmation. In markets that are often noisy and full of failed breakouts, focusing on these three elements helps clarify directional bias and supports more confident decision-making.
With the ability to scan multiple symbols and timeframes efficiently, this tool allows traders to stay focused on high-quality setups without the need to manually sift through dozens of charts. The inclusion of optional alerts further enhances its utility by offering timely updates when criteria are met.
By moving away from reactive strategies and toward structural anticipation, this screener supports traders who align their methods with institutional logic and the mechanics of smart money.
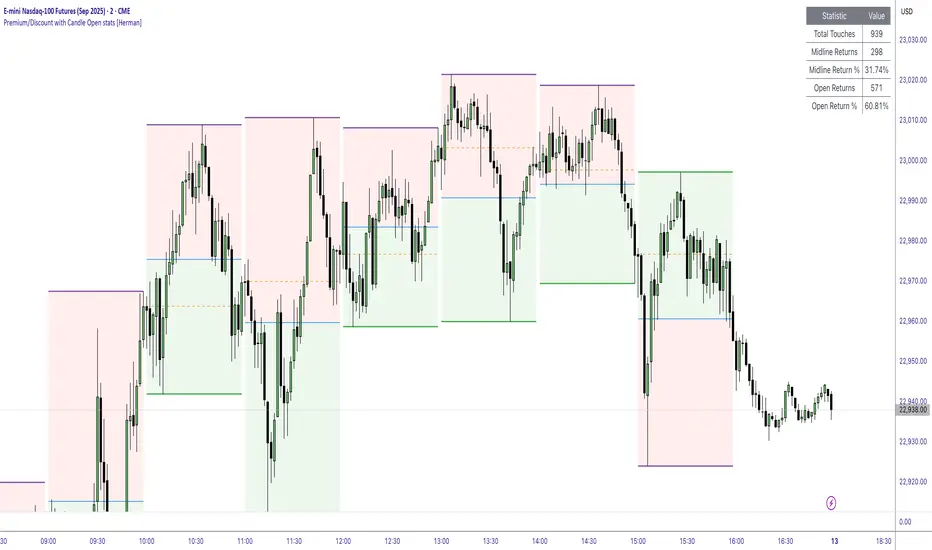
Premium/Discount with Candle Open stats [Herman]Premium/Discount with Stats
This indicator is designed to help traders identify and analyze premium/discount zones on any timeframe while automatically tracking statistics on price behavior relative to these zones. It is especially valuable for traders looking to structure entries, manage targets, and quantify market reactions to prior session ranges.
What it draws on the chart
✅ Range High and Low Lines
For each selected timeframe period (15min, 30min 1H, 4H, Daily), the indicator plots the high and low of the completed previous period.
These lines are color-coded dynamically based on sweep detection:
If the high was swept (price broke the previous high), the high line is marked as Premium.
If the low was swept, the low line is marked as Discount.
If both were swept or neither, it uses the default color settings.
✅ Midline
An optional midline at the 50% level of the previous period’s high-low range.
Helpful for mean-reversion traders or anyone watching for retests of equilibrium.
✅ Quartile Lines (25%–75%)
Optional additional lines at 25% and 75% of the previous range, helping traders visualize inner range subdivisions.
✅ Open Price Line
Marks the open price of the previous period as a horizontal reference.
✅ Background Fills
The region between low and midline is shaded with the Discount color.
The region between high and midline is shaded with the Premium color.
These optional fills help highlight the premium and discount zones visually.
✅ Current Incomplete Period Lines (optional)
You can choose to display provisional high, low, midline, quartiles, and open for the current forming period.
These update in real-time until the period closes.
Sweep Detection Logic
The indicator automatically tracks if the current period price sweeps above the previous period’s high or below the low.
A "sweep" is simply defined as price exceeding the previous high/low while tracking is active.
The sweep status affects the colors of the premium/discount lines, helping traders see potential liquidity grabs or stop hunts.
What it counts and tracks (Statistics)
The script automatically compiles statistics over time:
✅ Total Touches
Counts how many times the price in a new period touches either the previous period’s high or low.
A “touch” is registered once per side per period.
✅ Midline Returns
Counts how often, after touching the previous high/low, price returns to the previous period’s midline.
Gives you a measure of mean-reversion success.
✅ Open Returns
Similarly, tracks how often price returns to the previous period’s open after touching the previous high/low.
✅ Return Percentages
Displays the percentage of touches that result in a return to midline or open.
These percentages are calculated live on your chart and updated after each period closes.
✅ Stats Table
A customizable on-chart table summarizing all of these stats in real-time.
Helps traders evaluate the effectiveness of range-based trading setups over time.
How it Works (Technical details)
On each new bar, the script checks if a new period (as defined by your timeframe selection) has begun.
When a new period starts, the previous period’s high, low, open, midline, quartiles are recorded and drawn on the chart.
The script then “watches” the current period:
Updates provisional high and low.
Detects sweeps of previous highs/lows.
Tracks if price returns to the previous period’s midline or open after those sweeps.
Increments statistical counters if conditions are met.
Background fills and lines update dynamically based on real-time data.
Intended Use Cases
This indicator is ideal for:
✅ Identifying premium/discount zones for swing or intraday trades.
✅ Spotting liquidity sweeps and possible manipulation zones.
✅ Structuring trades with logical, data-driven target zones (midline, open).
✅ Quantifying the probability of mean-reversion moves after liquidity events.
✅ Developing and backtesting range-based trading models with live stats.
Highly Customizable
Choose any timeframe for defining the premium/discount range.
Toggle visibility of midline, quartiles, open line, current period preview.
Full control over colors, line styles, line widths, and background shading.
Optional real-time statistical table with total counts and return percentages.
Price Range Retrace statisticks [HERMAN]📈 Price Range Retrace Stats
This indicator is designed to help traders quantify how often price retraces to a selected equilibrium level (e.g., 50%) after sweeping the high/low of a defined time-based range.
It is especially useful for modeling sessions such as the London Opening Range (e.g., 02:00–03:00 NY time), checking if price sweeps that range in a subsequent window (e.g., 03:00–04:00), and returns to its 50% level.
✅ What does it do?
Lets you define multiple time ranges (e.g. London, NY Open, custom ranges).
Draws the range box for the selected session time.
Calculates and plots the retracement level (default 50%).
Checks if price sweeps the high/low of the range before retracing.
Tracks success rate, average distance, sample size and displays these stats in a table.
⚙️ Key Features:
Fully customizable time windows (range box time and retracement check time).
-Configurable retracement % (default 50% equilibrium).
-Optional sweep condition (only count retracements if price sweeps the high/low first).
-Clean, theme-adaptive stats table with success rates and averages.
-Supports two independent levels (e.g. London and NY sessions).
📊 Why use it?
This tool turns session-based setups into statistical models:
Backtest session strategies over many days.
Quantify edge with % success over time.
Validate trading ideas with data.
Use probabilities instead of gut feeling.
Example insight you can track:
“Between 3–4 AM NY time, price swept the high/low of the 2–3 AM London Opening Range and returned to its 50% equilibrium level in 64% of 234 sessions.”
📌 Ideal for:
ICT concepts (Opening Range, Sweep, Equilibrium Return).
Algo developers wanting probabilities.
Anyone who wants data-driven confirmation for session range mean-reversion.
Instructions:
1️⃣ Enable the desired Price Range (1 or 2).
2️⃣ Set your Range Time (e.g. 02:00–03:00).
3️⃣ Set your Retracement Check Time (e.g. 03:00–04:00).
4️⃣ Choose retracement % (e.g. 50%).
5️⃣ Watch the box and retrace line plot on chart.
6️⃣ Review the success statistics in the table.

ICT Setup 04 [TradingFinder] SFP Sweep Liquidity Fake CHoCH/BOS🔵 Introduction
In smart money and ICT based trading, liquidity is never random. Some of the most meaningful market moves begin with a liquidity sweep where price intentionally hunts a previous swing high or swing low to trigger stop loss orders and absorb volume.
This manipulation is often followed by a sharp reversal from a reaction zone, creating ideal conditions for a high probability entry. This indicator is built to detect exactly that. It identifies a valid swing point and defines a reaction zone where price is likely to react.
For short setups, the zone lies between the swing high and the maximum of the candle’s open or close. For long setups, it’s drawn from the swing low to the minimum of the open or close.
When price returns to this zone and forms a qualified confirmation candle typically a doji or a small bodied candle that closes inside the zone while sweeping the liquidity this is a potential sign of reversal.
The candle must show both the sweep and the inability to hold above or below the key level, signaling a fake breakout or failed move. By combining elements of liquidity hunt, reaction zone rejection, and candle based entry confirmation, this tool highlights sniper entry points used by smart money to trap retail traders and reverse the trend. It helps filter out noise and enhances timing, making it ideal for trading in alignment with institutional order flow.
Long Position :
Short Position :
🔵 How to Use
This indicator is designed to highlight precise moments where price sweeps liquidity and reacts within a high probability reversal zone. By identifying clean swing highs and lows and defining a smart reaction zone around them, it filters out weak fakeouts and focuses only on setups with strong institutional footprints.
The tool works best when combined with market structure analysis and is suitable for both scalping and intraday trading. Below is a breakdown of how to interpret the signals for long and short positions based on the visual setups provided.
🟣 Long Setup
In a long setup, the indicator first detects a valid swing low where liquidity has likely accumulated below. A reaction zone is then drawn between the swing low and the minimum of the open or close of the swing candle.
When price returns to this zone, it must sweep the previous low and form a precise confirmation candle, such as a doji or a small bodied candle, that closes inside the zone. This candle must also reject the lower level, showing failure to continue downward.
As shown in the chart, once the liquidity grab is complete and the confirmation candle forms, a clean long signal is issued, indicating a potential bullish reversal backed by smart money behavior.
🟣 Short Setup
In a short setup, the indicator identifies a swing high where buy-side liquidity is resting. It then constructs a reaction zone between the high and the maximum of the open or close of the swing candle. Price must return to this zone, sweep the swing high, and form a bearish confirmation candle inside the zone.
A classic example is a doji or rejection candle that traps breakout buyers and fails to hold above the previous high. In the provided chart, the price aggressively hunts the liquidity above the swing high, but the close within the reaction zone signals exhaustion, prompting a short signal with high reversal probability.
These setups represent moments where price action, liquidity behavior, and candle structure align to offer strong entries. By focusing on clean sweeps and reactive confirmations, the indicator helps traders stay on the side of smart money and avoid common breakout traps.
🔵 Settings
🟣 Logical settings
Swing period : You can set the swing detection period.
Max Swing Back Method : It is in two modes "All" and "Custom". If it is in "All" mode, it will check all swings, and if it is in "Custom" mode, it will check the swings to the extent you determine.
Max Swing Back : You can set the number of swings that will go back for checking.
Maximum Distance Between Swing and Signal :The maximum number of candles allowed between the swing point and the potential signal. The default value is 50, ensuring that only recent and relevant price reactions are considered valid.
🟣 Display settings
Displaying or not displaying swings and setting the color of labels and lines.
🟣 Alert Settings
Alert SFP : Enables alerts for Swing Failure Pattern.
Message Frequency : Determines the frequency of alerts. Options include 'All' (every function call), 'Once Per Bar' (first call within the bar), and 'Once Per Bar Close' (final script execution of the real-time bar). Default is 'Once per Bar'.
Show Alert Time by Time Zone : Configures the time zone for alert messages. Default is 'UTC'.
🔵 Conclusion
This indicator is built for traders who rely on liquidity driven setups and smart money principles. By combining swing structure analysis with precision reaction zones and strict entry confirmation, it isolates the exact moments where price sweeps liquidity and fails to continue. These are high value points where institutional activity often reveals itself, and retail traps unfold.
Unlike generic breakout tools, this script focuses on quality over quantity by requiring both a sweep of a swing high or low and a confirmed rejection candle that closes inside a predefined zone. With customizable swing depth, proximity filters, visual highlights, and alert functions, it offers a complete framework for identifying and acting on fake breakouts with confidence. Whether you trade forex, crypto, or indices, this tool enhances your ability to align with true order flow and take entries where liquidity is most likely to shift.

Liquidity Sweep Candlestick Pattern with MA Filter📌 Liquidity Sweep Candlestick Pattern with MA Filter
This custom indicator detects liquidity sweep candlestick patterns—price action events where the market briefly breaks a previous candle’s high or low to trap traders—paired with optional filters such as moving averages, color change candles, and strictness rules for better signal accuracy.
🔍 What is a Liquidity Sweep?
A liquidity sweep occurs when the price briefly breaks the high or low of a previous candle and then reverses direction. These events often occur around key support/resistance zones and are used by institutional traders to trap retail positions before moving the price in the intended direction.
🟢 Bullish Liquidity Sweep Criteria
The current candle is bullish (closes above its open).
The low of the current candle breaks the low of the previous candle.
The candle closes above the previous candle’s open.
Optionally, in Strict mode, it must also close above the previous candle’s high.
Optionally, it can be filtered to only show if the candle changed color from the previous one (e.g., red to green).
Can be filtered to only show when the price is above or below a moving average (if MA filter is enabled).
🔴 Bearish Liquidity Sweep Criteria
The current candle is bearish (closes below its open).
The high of the current candle breaks the high of the previous candle.
The candle closes below the previous candle’s open.
Optionally, in Strict mode, it must also close below the previous candle’s low.
Optionally, it can be filtered to only show if the candle changed color from the previous one (e.g., green to red).
Can be filtered to only show when the price is above or below a moving average (if MA filter is enabled).
⚙️ Features & Customization
✅ Signal Strictness
Choose between:
Less Strict (default): Basic wick break and close conditions.
Strict: Must close beyond the wick of the previous candle.
✅ Color Change Candles Only
Enable this to only show patterns when the candle color changes (e.g., from red to green or green to red). Helps filter fake-outs.
✅ Moving Average Filter (optional)
Supports several types of MAs: SMA, EMA, WMA, VWMA, RMA, HMA
Choose whether signals should only appear above or below the selected moving average.
✅ Custom Visuals
Show short (BS) or full (Bull Sweep / Bear Sweep) labels
Plot triangles or arrows to represent bullish and bearish sweeps
Customize label and shape colors
Optionally show/hide the moving average line
✅ Alerts
Includes alert options for:
Bullish sweep
Bearish sweep
Any sweep
📈 How to Use
Add the indicator to your chart.
Configure the strictness, color change, or MA filters based on your strategy.
Observe signals where price is likely to reverse after taking out liquidity.
Use with key support/resistance levels, order blocks, or volume zones for confluence.
⚠️ Note
This tool is for educational and strategy-building purposes. Always confirm signals with other indicators, context, and sound risk management.

RunRox - Entry Model🎯 RunRox Entry Model is an all-in-one reversal-pattern indicator engineered to help traders accurately identify key price-reversal points on their charts. It will be part of our premium indicator package and improve the effectiveness of your trading strategies.
The primary concept of this indicator is liquidity analysis, making it ideal for Smart Money traders and for trading within market structure. At the same time, the indicator is universal and can be integrated into any strategy. Below, I will outline the full concept of the indicator and its settings so you can better understand how it works.
🧬 CONCEPT
In the screenshot below, I’ll schematically illustrate the core idea of this indicator. It’s one of the patterns that the indicator automatically detects on the chart using a two-timeframe approach. We use the higher timeframe to identify liquidity zones, and the lower timeframe to capture liquidity removal and structure breaks. The schematic is shown in the screenshot below.
Our indicator includes three entry models in total , and I will discuss its functionality and features in more detail later in this post.
💡 FEATURES
Three entry models
PO3 HTF Bar
Entry Area
Optimization for each Entry Area
Filters
HTF FVG
Alert customization
Next, we will examine each entry model in detail.
🟠 ENTRY MODEL 1
The first model is the core one we’ll work with; all other models rely on its structure and construction. In the screenshot below, I’ll schematically show the complete model.
As shown in the screenshot above, we display higher-timeframe candles on the current chart to better visualize the entry model and keep the trader informed of what’s happening on the larger timeframe. The screenshot also highlights both the Long and Short models, as well as the Entry Area, which I will explain in more detail below.
The schematic model on the lower timeframe is shown in the screenshot above. It illustrates that after the Entry Model forms, we draw the Entry Area on the next candle and wait for a price pullback into this zone for the optimal trade entry. Statistically, before moving higher, the price typically revisits the Entry Area, covering the imbalances created by MSS; thus, the Entry Area represents the ideal entry point.
🟩 Entry Area
Once the Entry Model has formed, we focus on identifying the optimal pullback zone for taking a position. To determine which retracement area performs best, we conducted extensive historical backtesting on potential zones and selected those that consistently delivered the strongest results. This process yields Entry Areas with the highest probability of a successful reversal.
On the screenshot above, you can see an example of the Entry Area and which zones carry a higher versus lower probability of reversal. Zones rendered with greater transparency have historically delivered weaker results than the more opaque zones. The deeper-colored areas represent the optimal entry zones and can improve your risk-reward ratio by allowing you to enter at more favorable prices.
It’s important to remember that the entire Entry Area functions as a potential zone for scaling into a position. However, if your risk-to-reward ratio isn’t favorable, you can wait for the price to retrace to lower levels within the Entry Area and enter with a more attractive risk-to-reward.
🟢 Pattern Rating
Each entry model receives a rating in the form of green circles next to its name 🟢. The rating ranges from one to four circles, based on the historical performance of similar patterns. To calculate this rating, we backtest past data by analyzing candle behavior during the model’s formation and assign circles according to how similar patterns performed historically.
Example Ratings:
🟢 – One circle
🟢🟢 – Two circles
🟢🟢🟢 – Three circles
🟢🟢🟢🟢 – Four circles
The more green circles a model has, the more reliable it is—but it’s crucial to rely on your own analysis when identifying strong reversal points on the chart. This rating reflects the model’s historical performance and does not guarantee future results, so keep that in mind!
Below is a screenshot showing four model variations with different ratings on the chart.
⚠️ Unconfirmed Pattern
Entry Model 1 is designed so that, until the higher-timeframe candle closes, the pattern remains unconfirmed and is hidden on the chart. For traders who prefer to see setups as they form, there’s a dedicated feature that displays the unconfirmed pattern at the moment of its appearance - triggered by the Market Structure Shift - before the HTF candle closes. The screenshot below shows what the pattern looks like prior to confirmation.
‼️IMPORTANT: Until the pattern is confirmed and the higher-timeframe candle has closed, the model may disappear from the chart if price reverses and the HTF candle closes below the previous bar. Therefore, this mode is suitable only for experienced traders who want to see market moves in advance. Remember that the pattern can be removed from the chart, so we recommend waiting for the HTF candle to close before deciding to enter a trade.‼️
✂️ Filters
For the primary model, there are four filters designed to enhance entry points or exclude less-confirmed patterns. The filters available in the indicator are:
Bounce Filter
Market Shift Mode
Same Wave Filter
Only with Divergence
I will explain how each of these filters works below.
- Bounce Filter
The Bounce Filter identifies significant deviations of price from its mean and only displays the Entry Model once the asset’s price moves beyond the average level. The screenshot below illustrates how this appears on the chart.
The actual average-price calculation is more sophisticated than what’s shown in the screenshot, that image is just an illustrative example. When the price deviates significantly from the N-bar average, we start looking for the Entry Model. This approach works particularly well in range-bound markets without a clear trend, as it lets you trade strong deviations from the mean.
- Market Shift Mode
This filter works by detecting the initial impulse that triggered the liquidity sweep on the previous higher-timeframe candle, and then holding the Market Structure Shift level at that point after the sweep. If the filter is turned off, price may move higher following the liquidity removal, creating a new MSS level and potentially producing a false structure shift and entry signal on the formed model.
This filter helps you more accurately identify genuine shifts - but keep in mind that the model can still perform well without it, so choose the setting that best suits your trading style.
- Same Wave Filter
The Same Wave Filter removes entry models that form without a clear lower-timeframe structure when liquidity is swept from the previous higher-timeframe candle. In other words, if the prior HTF candle and the current one belong to the same impulse wave - without any retracements on the LTF - the model is filtered out.
Keep in mind that this filter may also exclude patterns that could have produced positive results, so whether to enable it depends on your trading system.
- Only with Divergence
The Only with Divergence filter detects divergence between the lows of successive candles and indicators like RSI. When the low that swept liquidity diverges from the previous candle’s low, the indicator displays a “DIV” label. Although RSI is cited as an example, our divergence calculation is more advanced. This filter highlights patterns where low divergence signals genuine liquidity manipulation and a likely aggressive price reversal.
🌀 Model Settings
Trade Direction: Choose whether to display models for Long or Short trades.
Fractal: Select between automatic fractal detection—which adapts the lower-timeframe (LTF) and higher-timeframe (HTF) candles—or Custom.
Custom Fractal: When Custom is selected, manually specify the LTF and HTF timeframes used to detect the patterns.
History Pattern Limit: Set the maximum number of patterns to display on the chart to keep it clean and uncluttered.
🎨 Model Style
You can flexibly customize the model’s appearance by choosing your preferred line thickness, color, and the other settings we discussed above.
🔵 ENTRY MODEL 2
This model appears under specific conditions when Model 1 cannot form. It’s a price-reversal model constructed according to different rules than the first model. The screenshot below shows how it looks on the chart.
This model forms less frequently than Model 1 but delivers equally strong performance and is displayed as a position-entry zone.
Like the Entry Area in Entry Model 1, this zone is calculated automatically and highlights the best entry levels: areas that showed the strongest historical results are rendered in a brighter shade.
🎨 Model Style
You can flexibly customize the style of Entry Model 2 - its color, opacity, visibility, and the average price of the previous candle.
🟢 ENTRY MODEL 3
Entry Model 3 is a continuation pattern that only forms after Entry Model 1 has completed and delivered the necessary price move to trigger Model 3.
Below is a schematic illustration of how Model 3 is intended to work.
🎨 Model Style
As with the previous models, you can flexibly customize the style of this zone.
⬆️ HTF CANDLES
One of the standout features of this indicator is the ability to plot higher-timeframe (HTF) candles directly on your lower-timeframe (LTF) chart, giving you clear visualization of the entry models and insight into what’s unfolding on the larger timeframe.
You can fully customize the HTF candles - select their style, the number of bars displayed, and tweak various settings to match your personal trading style.
HTF FVG
Fair Value Gaps (FVGs) can also be drawn on the HTF candles themselves, enabling you to spot key liquidity or interest zones at a glance, without switching between timeframes.
Additionally, you can view all significant historical HTF highs and lows, with demarcation lines showing where each HTF candle begins and ends.
All these options let you tailor the HTF candle display on your chart and monitor multiple timeframes’ trends in a single view.
📶 INFO PANEL
Instrument: the market symbol on which the model is detected
Fractal Timeframes: the LTF and HTF fractal periods used to locate the pattern
HTF Candle Countdown: the time remaining until the higher-timeframe candle closes
Trade Direction: the direction (Long or Short) in which the model is searched for entry
🔔 ALERT CUSTOMIZATION
And, of course, you can configure any alerts you need. There are seven alert types available:
Confirmed Entry Model 1
Unconfirmed Entry Model 1
Confirmed Entry Model 2
Confirmed Entry Model 3
Entry Area 1 Trigger
Entry Area 2 Trigger
Entry Area 3 Trigger
You also get a custom macro field where you can enter any placeholders to fully personalize your alerts. Below are example macros you can use in that field.
{{event}} - Event name ('New M1')
{{direction}} - Trade direction ('Long', 'Short')
{{area_beg}} - Entry Area Price
{{area_end}} - Entry Area Price
{{exchange}} - Exchange ('Binance')
{{ticker}} - Ticker ('BTCUSD')
{{interval}} - Timeframe ('1s', '1', 'D')
{{htf}} - High timeframe ('15', '60', 'D')
{{open}}-{{close}}-{{high}}-{{low}} - Candle price values
{{htf_open}}-{{htf_close}}-{{htf_high}}-{{htf_low}} - Last confirmed HTF candle's price
{{volume}} - Candle volume
{{time}} - Candle open time in UTC timezone
{{timenow}} - Signal time in UTC timezone
{{syminfo.currency}} - 'USD' for BTCUSD pair
{{syminfo.basecurrency}} - 'BTC' for BTCUSD pair
✅ USAGE EXAMPLES
Now I’ll demonstrate several ways to apply this indicator across different trading strategies.
Primarily, it’s most effective within the Smart Money framework - where liquidity and manipulation are the core focus - so it integrates seamlessly into your SMC-based approach.
However, it can also be employed in other strategies, such as classic technical analysis or Elliott Wave, to capitalize on reversal points on the chart.
Example 1
The first example illustrates forming a downtrend using a Smart Money strategy. After the market structure shifts and the first BOS is broken, we begin looking for a short entry.
Once Entry Model 1 is established, a Fair Value Gap appears, which we use as our position-entry zone. The nearest target becomes the newly formed BOS level.
In this trade, it was crucial to wait for a strong downtrend to develop before hunting for entries. Therefore, we waited for the first BOS to break and entered the trade to ride the continuation of the downtrend down to the next BOS level.
Example 2
The next example illustrates a downtrend developing with a Fair Value Gap on the 1-hour timeframe. The FVG is also displayed directly on the HTF candles in the chart.
The pattern forms within the HTF Fair Value Gap, indicating that we can balance this inefficiency and ride the continuation of the downtrend.
The target can simply be a 1:2 or 1:3 risk–reward ratio, as in our case.
📌 CONCLUSION
These two examples illustrate how this indicator can be used to identify reversals or trend continuations. In truth, there are countless ways to incorporate this tool, and each trader can adapt the model to fit their own strategy.
Always remember to rely on your own analysis and only enter trades when you feel confident in them.

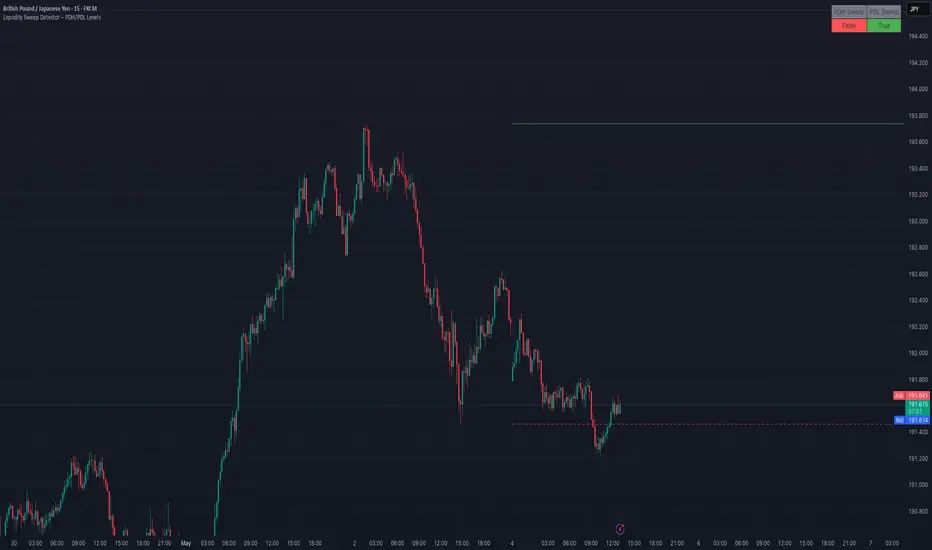
Liquidity Sweep Detector – PDH/PDL LevelsPrevious Day High/Low Liquidity Sweep Detector (Intraday Accurate)
This indicator tracks the previous day's high and low using intraday data, rather than the daily candle, ensuring precise sweep detection across lower timeframes (15m to 4H).
It monitors for liquidity sweeps—moments when price briefly moves above the previous high or below the previous low—and visually marks these events on the chart.
Key Features
Intraday-accurate PDH/PDL tracking
Real-time sweep detection
On-chart labels marking sweep events
Toggleable table showing sweep status
Alert conditions for PDH/PDL sweep triggers
Best For
Traders who use Smart Money Concepts (SMC), liquidity-based strategies, or look for stop hunts and reversal zones tied to key prior-day levels.
Works well across FX, crypto, and indices on 15m, 1H, and 4H charts.
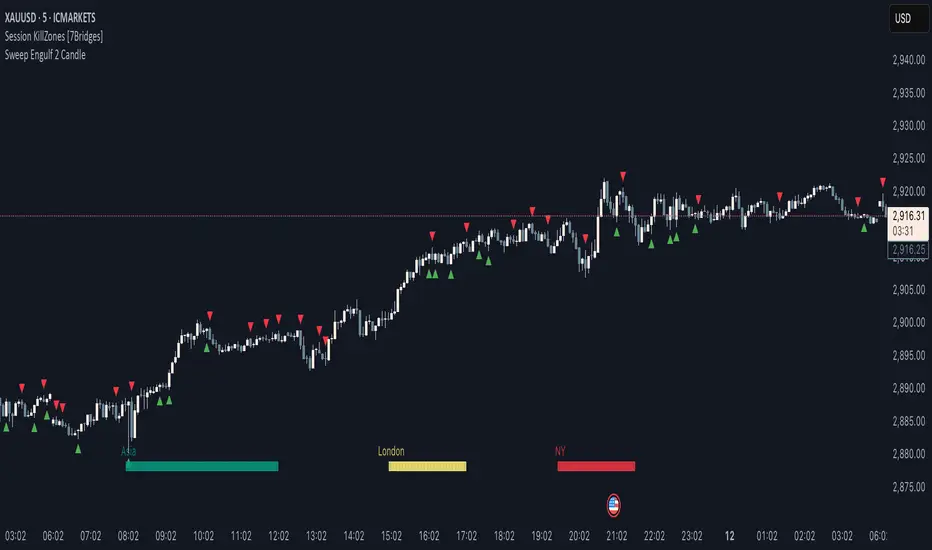
[TTM] ICT Sessions & Ranges🌟 Overview 🌟
The ICT Sessions & Ranges Indicator helps traders identify key intraday price levels by marking custom session highs/lows and opening ranges.
It helps traders spot potential liquidity grabs, reversals, and breakout zones by tracking price behavior around these key areas
🌟 Session Highs & Lows – Liquidity Zones 🌟
Session highs and lows often attract price due to stop orders resting above or below them. These levels are frequently targeted during high-volatility moves.
🔹 Asia Session
- Usually ranges in low volatility.
- Highs/lows often get swept during early London.
- Price may raid these levels, then reverse.
🔹 London Session
- First major volatility of the day.
- Highs/lows often tested or swept in New York.
- Commonly forms the day’s true high or low.
🌟 Opening Range Concepts 🌟
The Opening Range is the first 15, 30, or 60 minutes of a session (e.g., New York).
The high (ORH) and low (ORL) define the market’s initial balance and key reaction levels.
🔹 Breakout Trade
- Price breaks ORH/ORL with momentum.
- Signals directional intent.
- Traders enter on the breakout, with stops inside the range.
🔹 Liquidity Raid
- Price briefly breaks ORH/ORL to trigger stops.
- Reverses after the sweep.
- Look for structure shift and entry near FVG or OB.
🌟 Customizable Settings 🌟
The indicator includes 3 configurable ranges , each with:
Start & End Time – Set any custom time window.
Display Type – Choose Box (highlight range) or Lines (mark high/low).
Color Settings – Set custom colors for boxes and lines.
🌟 Default Settings 🌟
Range 1 : 19:00–00:00 (Asia Session)
Range 2 : 01:45–05:15 (London Session)
Range 3 : 09:30–10:00 (NY Opening Range – 30m)

FVG TheoryThe indicator is intended to facilitate trading with FVGs. It consists of 3 components:
1. Swings:
A swing is a 3-candle formation based on the Williams Fractal Indicator.
The interaction with the last swing is always displayed as a red line. This allows you to recognize the last interaction directly and draw conclusions about the further course of the price (sweep / break).
In addition, the closest fractal is always shown as a green line, which acts as a potential target.
2. FVGs:
FVGs are also known as Inbalance, it is a 3 candle formation where a gap is created in the market. The market often runs into this and reacts.
If the market reacts from an imbalance before it has reached the swing low in the bullish case, the next FVG appears in a different color.
This formation has more power and is therefore color-coded.
If the FVG is particularly strong, measured by the fact that the 3rd candle in the formation breaks the 2nd candle with a candle body, this is marked with a small arrow in the FVG (break away gap).
3. overlapping
If there is a structure point within an FVG (order block, significant swing), a line is drawn there.
These overlaps have a higher confluence than FVGs alone. The wick is preferred, but if there is no overlap, the body of the structure is used.
The line thickness and colors are individually adjustable.

Liquidity Sweep Filter Strategy [AlgoAlpha X PineIndicators]This strategy is based on the Liquidity Sweep Filter developed by AlgoAlpha. Full credit for the concept and original indicator goes to AlgoAlpha.
The Liquidity Sweep Filter Strategy is a non-repainting trading system designed to identify liquidity sweeps, trend shifts, and high-impact price levels. It incorporates volume-based liquidation analysis, trend confirmation, and dynamic support/resistance detection to optimize trade entries and exits.
This strategy helps traders:
Detect liquidity sweeps where major market participants trigger stop losses and liquidations.
Identify trend shifts using a volatility-based moving average system.
Analyze volume distribution with a built-in volume profile visualization.
Filter noise by differentiating between major and minor liquidity sweeps.
How the Liquidity Sweep Filter Strategy Works
1. Trend Detection Using Volatility-Based Filtering
The strategy applies a volatility-adjusted moving average system to determine trend direction:
A central trend line is calculated using an EMA smoothed over a user-defined length.
Upper and lower deviation bands are created based on the average price deviation over multiple periods.
If price closes above the upper band, the strategy signals an uptrend.
If price closes below the lower band, the strategy signals a downtrend.
This approach ensures that trend shifts are confirmed only when price significantly moves beyond normal market fluctuations.
2. Liquidity Sweep Detection
Liquidity sweeps occur when price temporarily breaks key levels, triggering stop-loss liquidations or margin call events. The strategy tracks swing highs and lows, marking potential liquidity grabs:
Bearish Liquidity Sweeps – Price breaks a recent high, then reverses downward.
Bullish Liquidity Sweeps – Price breaks a recent low, then reverses upward.
Volume Integration – The strategy analyzes trading volume at each sweep to differentiate between major and minor sweeps.
Key levels where liquidity sweeps occur are plotted as color-coded horizontal lines:
Red lines indicate bearish liquidity sweeps.
Green lines indicate bullish liquidity sweeps.
Labels are displayed at each sweep, showing the volume of liquidated positions at that level.
3. Volume Profile Analysis
The strategy includes an optional volume profile visualization, displaying how trading volume is distributed across different price levels.
Features of the volume profile:
Point of Control (POC) – The price level with the highest traded volume is marked as a key area of interest.
Bounding Box – The profile is enclosed within a transparent box, helping traders visualize the price range of high trading activity.
Customizable Resolution & Scale – Traders can adjust the granularity of the profile to match their preferred time frame.
The volume profile helps identify zones of strong support and resistance, making it easier to anticipate price reactions at key levels.
Trade Entry & Exit Conditions
The strategy allows traders to configure trade direction:
Long Only – Only takes long trades.
Short Only – Only takes short trades.
Long & Short – Trades in both directions.
Entry Conditions
Long Entry:
A bullish trend shift is confirmed.
A bullish liquidity sweep occurs (price sweeps below a key level and reverses).
The trade direction setting allows long trades.
Short Entry:
A bearish trend shift is confirmed.
A bearish liquidity sweep occurs (price sweeps above a key level and reverses).
The trade direction setting allows short trades.
Exit Conditions
Closing a Long Position:
A bearish trend shift occurs.
The position is liquidated at a predefined liquidity sweep level.
Closing a Short Position:
A bullish trend shift occurs.
The position is liquidated at a predefined liquidity sweep level.
Customization Options
The strategy offers multiple adjustable settings:
Trade Mode: Choose between Long Only, Short Only, or Long & Short.
Trend Calculation Length & Multiplier: Adjust how trend signals are calculated.
Liquidity Sweep Sensitivity: Customize how aggressively the strategy identifies sweeps.
Volume Profile Display: Enable or disable the volume profile visualization.
Bounding Box & Scaling: Control the size and position of the volume profile.
Color Customization: Adjust colors for bullish and bearish signals.
Considerations & Limitations
Liquidity sweeps do not always result in reversals. Some price sweeps may continue in the same direction.
Works best in volatile markets. In low-volatility environments, liquidity sweeps may be less reliable.
Trend confirmation adds a slight delay. The strategy ensures valid signals, but this may result in slightly later entries.
Large volume imbalances may distort the volume profile. Adjusting the scale settings can help improve visualization.
Conclusion
The Liquidity Sweep Filter Strategy is a volume-integrated trading system that combines liquidity sweeps, trend analysis, and volume profile data to optimize trade execution.
By identifying key price levels where liquidations occur, this strategy provides valuable insight into market behavior, helping traders make better-informed trading decisions.
Key use cases for this strategy:
Liquidity-Based Trading – Capturing moves triggered by stop hunts and liquidations.
Volume Analysis – Using volume profile data to confirm high-activity price zones.
Trend Following – Entering trades based on confirmed trend shifts.
Support & Resistance Trading – Using liquidity sweep levels as dynamic price zones.
This strategy is fully customizable, allowing traders to adapt it to different market conditions, timeframes, and risk preferences.
Full credit for the original concept and indicator goes to AlgoAlpha.

Sweep Engulf CHoCH📖 Indicator Overview
The Sweep Engulf CHoCH indicator is designed to detect the Sweep + Engulf + CHoCH (Change of Character) pattern on price charts. This indicator helps traders identify bullish and bearish entry opportunities based on the last three candles forming this pattern.
📊 How the Indicator Works
The indicator analyzes specific conditions in the last three candles:
🔹 Bullish Entry (Buy Signal)
✔️ Candle 1 must be bearish (close < open )
✔️ Candle 2 must sweep the low of candle 1 (low < low )
✔️ Candle 2 must also engulf candle 1 (close > close )
✔️ Candle 3 must break structure (CHoCH) by closing above the open of candle 1 (close > open )
🔻 Bearish Entry (Sell Signal)
✔️ Candle 1 must be bullish (close > open )
✔️ Candle 2 must sweep the high of candle 1 (high > high )
✔️ Candle 2 must also engulf candle 1 (close < open )
✔️ Candle 3 must break structure (CHoCH) by closing below the open of candle 1 (close < open )

Sweep Engulf 2 Candle🔍 Overview:
This script identifies Bullish Engulfing and Bearish Engulfing candlestick patterns on the chart. These formations are widely used in technical analysis to spot potential reversals in price action. The indicator helps traders quickly identify these patterns by marking them directly on the chart with small arrows.
📌 Features:
✅ Bullish Engulfing & Bearish Engulfing Detection
✅ Customizable Display Options (Enable/Disable Bullish or Bearish signals)
✅ Real-Time Alerts (Receive notifications when a pattern is formed)
✅ Optimized Marker Size (Smaller icons for better chart visibility)
📊 How It Works:
1. Bullish Engulfing Condition:
The second candle's low is lower than the first candle's low.
The second candle's close is higher than the first candle's open (if the first candle is bearish) OR higher than the first candle's close (if the first candle is bullish).
2. Bearish Engulfing Condition:
The second candle's high is higher than the first candle's high.
The second candle's close is lower than the first candle's close (if the first candle is bearish) OR lower than the first candle's open (if the first candle is bullish).
⚙️ How to Use:
Add the script to your TradingView chart.
Adjust settings to enable/disable Bullish or Bearish Engulfing patterns.
Enable alerts to receive real-time notifications when a pattern is detected.
Use this indicator to support your technical analysis and trade decisions.
📌 Notes:
This indicator is best used in combination with other technical analysis tools like support & resistance levels, trendlines, or volume analysis.
It works on all timeframes and asset
MTF Fractals [RunRox]🔽 MTF Fractals is a powerful indicator designed to visualize fractals from multiple timeframes directly on your chart, highlight liquidity sweeps at these fractal levels, and provide several additional features we’ll cover in detail below.
We created this indicator because we couldn’t find a suitable tool that met our specific needs on TradingView. Therefore, we decided to develop a valuable indicator for the entire TradingView community, combining simplicity and versatility.
⁉️ WHAT IS A FRACTALS?
In trading, a fractal is a technical analysis pattern composed of five consecutive candles, typically highlighting local market turning points. Specifically, a fractal high is formed when a candle’s high is higher than the highs of the two candles on either side, whereas a fractal low occurs when a candle’s low is lower than the lows of the two adjacent candles on both sides.
Traders use fractals as reference points for identifying significant support and resistance levels, potential reversal areas, and liquidity zones within price action analysis. Below is a screenshot illustrating clearly formed fractals on the chart.
📙 FRACTAL FORMATION
Here’s how fractals form depending on your chosen setting (3, 5, 7, or 9):
▶️ 3-bar fractal – forms when the central candle is higher (for highs) or lower (for lows) than one candle on each side.
▶️ 5-bar fractal – forms when the central candle is higher or lower than two candles on both sides.
▶️ 7-bar fractal – forms when the central candle is higher or lower compared to the three candles on each side.
▶️ 9-bar fractal – forms similarly but requires four candles on each side, making the fractal significantly more reliable and robust.
A higher number of bars ensures stronger fractal levels, highlighting more significant potential reversal points on the chart.
Now that we’ve covered the theory behind fractal formation, let’s explore the indicator’s functionality in more detail.
Below, I’ll explain each feature clearly and illustrate how you can effectively utilize this indicator in your trading.
🕐 MULTI-TIMEFRAME FRACTALS
We realized that displaying fractals only from the current timeframe isn’t always convenient, so we’ve introduced Multi-Timeframe Fractals into this indicator.
Now you can easily display fractals from higher timeframes directly on your current chart, providing you with broader market context and clearer trading signals.
Fractals from Current Timeframe – Fractals identified directly on the chart’s current timeframe.
Fractals from Higher Timeframes – Fractals sourced from higher timeframes and displayed clearly on your current chart for enhanced market perspective.
📈 FRACTAL LINES
Since fractals represent areas of high liquidity, we’ve added an option to extend fractal levels horizontally as Fractal Lines across your chart.
This feature allows you to clearly visualize critical liquidity areas from higher timeframes, directly on your current timeframe chart, as demonstrated in the screenshot below.
With this approach, you can clearly visualize significant fractal levels from higher timeframes directly on your current chart - for example, projecting fractals from the 1-hour (1H) timeframe onto a 3-minute (3m) chart. ✅ This helps you easily identify critical liquidity areas and potential reversal zones without the need to switch between multiple timeframes.
💰 LIQUDITY SWEEP (LIQUDITY GRAB)
To enhance your trading experience, we’ve introduced a feature that clearly identifies liquidity sweeps of fractal levels.
A Liquidity Sweep occurs when a candle closes beyond a fractal line, leaving a wick that pierces through it, signaling that liquidity has been collected at this level.
Below, you’ll find two examples illustrating this functionality:
▶️ Fractal lines from the current timeframe
▶️ Fractal lines projected from higher timeframes
The first example illustrates liquidity being swept from fractals on the current timeframe .
Here, the candle clearly closes beyond the fractal line, leaving a wick through it. This indicates a liquidity sweep at the fractal level, visually highlighting a potential reversal or continuation opportunity directly on your chart.
In the second example, fractals from the higher timeframe are projected onto your current chart.
When a candle on your current timeframe closes beyond an HTF fractal line - leaving a wick through this level - the indicator highlights it clearly. This signals to traders a potential reversal zone, indicating that liquidity has been swept, and price may reverse or significantly react from this area.
You can also enable the display of additional labels on the chart. These labels clearly mark liquidity sweeps at fractal levels, making it easier to visually identify potential reversal points directly on your chart.
⚙️ SETTINGS
Below are the indicator settings with detailed explanations for each parameter.
🔷 Bars in Fractal – Number of candles to the right and left required to form a fractal.
🔷 Fractal Timeframe – Select the timeframe from which you want to display fractals on the current chart.
🔷 Max Age, bars – Number of bars during which the fractal will remain active.
🔷 Show Fractal Line – Display or hide fractal lines.
🔷 Line Style – Choose the style of the line displayed on the chart.
🔷 Line Width – Thickness of the fractal line.
🔷 High Fractal – Style and color of bearish fractals.
🔷 Low Fractal – Style and color of bullish fractals.
🔷 Fractal Label Size – Select the size of fractal labels.
🔷 Show Sweep Labels – Option to display labels when a liquidity sweep occurs.
🔷 Label Color – Color and transparency of the area marked on the chart during a sweep.
🔷 Shade Sweep Area – Show or hide the sweep area shading.
🔷 Area Color – Color and transparency settings for the sweep area.
🔶 We’d love to hear your feedback and any suggestions for additional features you’d like to see in this indicator. We’ll be happy to consider your ideas and continue improving the indicator!

1H/3m Concept [RunRox]🕘 1H/3m Concept is a versatile trading methodology based on liquidity sweeps from fractal points identified on higher timeframes, followed by price reversals at these key moments.
Below, I will explain this concept in detail and provide clear examples demonstrating its practical application.
⁉️ WHAT IS A FRACTALS?
In trading, a fractal is a technical analysis pattern composed of five consecutive candles, typically highlighting local market turning points. Specifically, a fractal high is formed when a candle’s high is higher than the highs of the two candles on either side, whereas a fractal low occurs when a candle’s low is lower than the lows of the two adjacent candles on both sides.
Traders use fractals as reference points for identifying significant support and resistance levels, potential reversal areas, and liquidity zones within price action analysis. Below is a screenshot illustrating clearly formed fractals on the chart.
📌 ABOUT THE CONCEPT
The 1H/3m Concept involves marking Higher Timeframe (HTF) fractals directly onto a Lower Timeframe (LTF) chart. When a liquidity sweep occurs at an HTF fractal level, we remain on the same LTF chart (since all HTF fractals are already plotted on this lower timeframe) and wait for a clear Market Structure Shift (MSS) to identify our potential entry point.
Below is a schematic illustration clearly demonstrating how this concept works in practice.
Below is another 💡 real-chart example , showing liquidity in the form of a 1H fractal, swept by a rapid impulse move. Immediately afterward, a clear Market Structure Shift (MSS) occurs, signaling a potential entry point into the trade.
Another example is shown below, where we see our hourly fractal, from which price clearly reacts, providing an opportunity to search for an entry point.
As illustrated on the chart, the fractal levels from the higher timeframe are clearly displayed, but we’re working directly on the 5-minute chart. This allows us to remain on one timeframe without needing to switch back and forth between charts to spot such trading setups.
🔍 MTF FRACTALS
This concept can be applied across various HTF-LTF timeframe combinations. Although our examples illustrate 1H fractals used on a 5-minute chart, you can effectively utilize many other timeframe combinations, such as:
30m HTF fractals on 1m chart
1H HTF fractals on 3m chart
4H HTF fractals on 15m chart
1D HTF fractals on 1H chart
The key idea behind this concept is always the same: identify liquidity at fractal levels on the higher timeframe (HTF), then wait for a clear Market Structure Shift (MSS) on the lower timeframe (LTF) to enter trades.
⚙️ SETTINGS
🔷 Trade Direction – Select the preferred trading direction (Long, Short, or Both).
🔷 HTF – Choose the higher timeframe from which fractals will be displayed on the current chart.
🔷 HTF Period – Number of candles required on both sides of a fractal candle (before and after) to confirm fractal formation on the HTF.
🔷 Current TF Period – Sensitivity to the impulse that sweeps liquidity, used for identifying and forming the MSS line.
🔷 Show HTF – Enable or disable displaying HTF fractal lines on your chart. You can also customize line style and color.
🔷 Max Age (Bars) – Number of recent bars within which fractals from the selected HTF will be displayed.
🔷 Show Entry – Enable or disable displaying the MSS line on the chart.
🔷 Enable Alert – Activates TradingView alerts whenever the MSS line is crossed.
You can also enable 🔔 alerts, which notify you whenever price crosses the MSS line. This significantly simplifies the process of identifying these setups on your charts. Simply configure your preferred timeframes and wait for notifications when the MSS line is crossed.
🔶 We greatly appreciate your feedback and suggestions for improving the indicator!

Follow Through Day (FTD) + Sweep [TrendX_]The Follow Through Day (FTD) + Sweep indicator is a Trend-following tool mixing William O'Neil's original FTD concept and Liquidity concept. This indicator helps you identify potential subsequent bullish trends with greater precision by combining volume analysis, price action, and liquidity concepts.
💎 FEATURES
Follow Through Day Candle (FTD Candle)
The FTD, pioneered by William O'Neil, serves as a reliable signal for identifying the beginning of new bull markets. It's particularly valuable because it combines multiple market factors - price action, volume, and timing - to confirm genuine market reversals rather than temporary bounces.
The power of the FTD lies in its ability to distinguish between ordinary market fluctuations and significant trend changes. By requiring specific criteria to be met across multiple sessions, it helps filter out false signals and identifies high-probability reversal points where institutional investors are likely beginning to accumulate positions.
Sweep Area
The Sweep area feature enhances the traditional FTD concept by incorporating modern liquidity analysis. This overlay identifies zones where large market participants are likely to trigger stop losses before continuing the trend. These areas often represent optimal entry points for traders looking to join the new uptrend with reduced risk.
🔎 BREAKDOWN
FTD Candle
The FTD formation process occurs in two distinct phases: Setup and Completion.
Setup Phase
Strong Market Decline
The market must first experience a significant downtrend
This selling pressure helps clear out weak hands and creates oversold conditions
The decline creates the potential energy for a powerful reversal
First Recovery Session
Marks the initial sign of buying pressure emerging
Often characterized by a strong reversal candle
Represents the first indication that selling pressure may be exhausting
Recovery Confirmation
The second and third days must maintain prices above the new pivot low
This consolidation period helps confirm the validity of the initial bounce
Shows that sellers are no longer in control of price action
Completion Phase:
Supply Test Session
Low volume indicates diminishing selling pressure
Price remains above the pivot low
Creates the foundation for institutional buyers to begin accumulating
Breakout Day
Price increase exceeds average profit of bullish candles
Volume increases by at least 15% compared to previous session
Shows strong institutional commitment to the new uptrend
Timing Window
Must occur between the 4th and 8th candle after First Recovery Session
This specific timing helps confirm the sustainability of the reversal
Based on O'Neil's research of historical market bottoms
FTD Sweep
The Post-FTD Phase introduces the Sweep concept, which is crucial for understanding how large market participants operate. This feature leverages the liquidity concept because institutional traders often need to trigger stop losses to accumulate larger positions at better prices. This helps:
Create liquidity pools for large position entries
Shake out weak hands before continuing the trend
Test the strength of the new trend by absorbing selling pressure
⚙️ USAGE
Sweep + TP & SL Strategy
Example: BTCUSDT (1D) - Replay back to 9th November 2024
After an FTD candle forms, traders can adopt a systematic approach to enhance their trading strategy. First, they should determine the swing range and convert the post-FTD zone into concrete stop loss and take profit levels, which are based on the price action during the FTD formation. Next, traders should wait for a sweep formation, as this indicates that institutional players are accumulating positions. A quick price rejection from the sweep level should be observed before executing an entry.
The reasoning behind this strategy is rooted in market microstructure. By waiting for the sweep, traders position themselves alongside institutional players who need to build large positions without causing adverse price movement. The sweep creates the liquidity they need, and the subsequent move often represents the true trend continuation.
DISCLAIMER
This indicator is not financial advice, it can only help traders make better decisions. There are many factors and uncertainties that can affect the outcome of any endeavor, and no one can guarantee or predict with certainty what will occur. Therefore, one should always exercise caution and judgment when making decisions based on past performance.

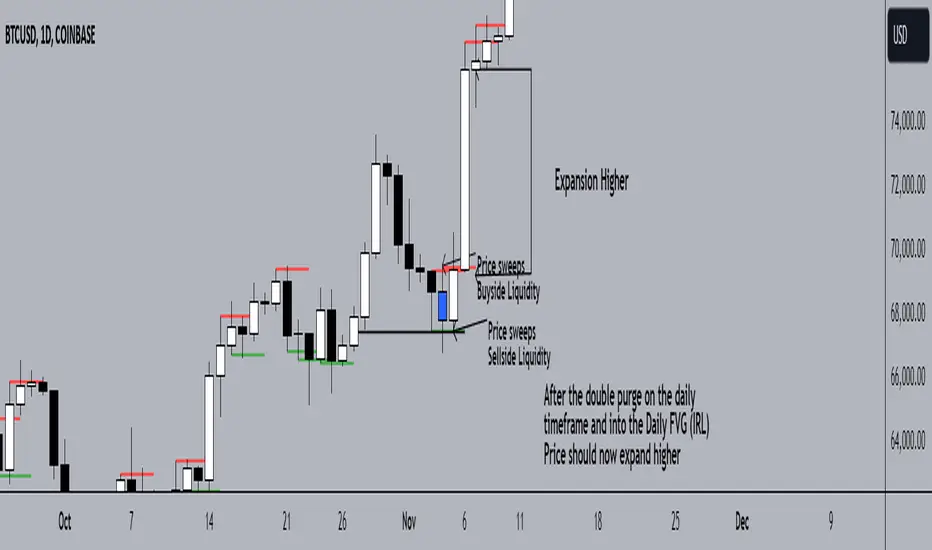
Double Purge Theory (DPT)The purpose of this script is to identify the Double Purge Theory-MMXM i.e. the run on liquidity on both the sell-side and the buy-side liquidity.
The simple use case behind this script is to provide additional entry confluence for your trade setups and more efficient stop loss placement on any given timeframe.
DPT in itself is a price signature that generally occurs before price makes impulsive move in the direction of the higher time frame narrative. It is not to be used as a standalone indicator for building narrative/framing bias.
How to use this script ?
1) Wait for the indicator to display the BLUE CANDLE highlight (DPT candle) that indicates the double purge has occurred.
2) The DPT should occur at/after price has tapped into a key level and is within the ICT killzones.
3) Position to frame your trade setup once you get a candle with a body close below / above the DPT candle , depending on your bias and stop loss placement at DPT candle high/low or after the body closure as mentioned in step 2.
For example :
Smart Money Setup 07 [TradingFinder] Liquidity Hunts & Minor OB🔵 Introduction
The Smart Money Concept relies on analyzing market structure, tracking liquidity flows, and identifying order blocks. Research indicates that traders who apply these methods can improve their accuracy in predicting market movements by up to 30%.
These elements allow traders to understand the behavior of market makers, including banks and large financial institutions, which have the ability to influence price movements and shape major market trends. By recognizing how these entities operate, traders can align their strategies with Smart Money actions and better anticipate shifts in the market.
Smart Money typically enters the market at points of high liquidity where trading opportunities are more attractive. By following these liquidity flows, professional traders can position themselves at market reversal points, leading to profitable trades.
The Smart Money Setup 07 indicator has been specifically designed to detect these complex patterns. Using advanced algorithms, this indicator automatically identifies both bullish and bearish trading setups, assisting traders in discovering hidden market opportunities.
As a powerful technical analysis tool, the Smart Money Setup indicator helps predict the actions of major market participants and highlights optimal entry and exit points. Essentially, this tool enables traders to act like institutional investors and market makers, making the most of price fluctuations in their favor.
Ultimately, the Smart Money Setup 07 indicator transforms complex technical analysis into a simple and practical tool. By detecting order blocks and liquidity zones, this tool helps traders execute their strategies with greater precision, leading to more informed and successful trading decisions.
🟣 Bullish Setup
🟣 Bearish Setup
🔵 How to Use
One of the key strengths of the Smart Money Setup 07 indicator is its ability to accurately identify order blocks and analyze liquidity flows. Order blocks represent areas where large buy or sell orders are placed by Smart Money investors, which often indicate key reversal points in the market. Traders can use these order blocks to pinpoint potential entry and exit opportunities.
The Smart Money Setup indicator detects and visually displays these order blocks on the chart, helping traders identify the best zones to enter or exit trades. Since these zones are frequently used by large institutional investors, following these blocks allows traders to capitalize on price fluctuations and trade with confidence.
🟣 Bullish Smart Money Setup
A Bullish Smart Money Setup forms when the market creates Higher Lows and Higher Highs. In this situation, the indicator analyzes pivot points, liquidity flows, and order blocks to identify buy opportunities. Liquidity points in these setups indicate areas where Smart Money is likely to enter long positions.
In the bullish setup image, multiple Higher Lows and Higher Highs are formed. The green zone represents a Bullish Order Block, signaling traders to enter a long trade. The Smart Money Setup indicator displays a green arrow, indicating a high-probability upward price movement from this liquidity zone.
🟣 Bearish Smart Money Setup
A Bearish Smart Money Setup occurs when the market structure shows Lower Highs and Lower Lows, indicating weakness in price. The indicator identifies these patterns and highlights potential sell opportunities. Liquidity points in this setup mark areas where Smart Money enters sell positions.
In the bearish setup image, a Lower High is followed by a Lower Low, with the red liquidity zone acting as a Bearish Order Block. The Smart Money Setup indicator shows a red arrow, signaling a likely downward move, offering traders an opportunity to enter short positions.
🔵 Settings
Pivot Period : This setting determines how many candles are needed to form a pivot point. A default value of 2 is optimal for quickly identifying key pivot points in price action.
Order Block Validity Period : This parameter defines the lifespan of an order block. Traders can adjust how long each order block remains valid. For instance, setting it to 500 means that an order block will be valid for 500 bars after its formation.
Mitigation Level OB : This setting allows traders to select whether order blocks should be based on the "Proximal," "50% OB," or "Distal" levels, helping traders manage risk more effectively.
Order Block Refinement : Traders can refine the order blocks with precision. The indicator offers two refinement modes: Defensive and Aggressive. The Defensive mode identifies safer order blocks, while the Aggressive mode targets higher-risk blocks with the potential for larger reversals.
🔵 Conclusion
The Smart Money Setup 07 indicator is a powerful tool for identifying key Smart Money movements in the market. It provides traders with essential insights for making informed trading decisions, particularly when combined with technical analysis and liquidity flow analysis. This indicator allows traders to accurately pinpoint entry and exit points, helping them maximize profits and minimize risk.
By offering a range of customizable settings, the Smart Money Setup indicator adapts to different trading styles and strategies. Furthermore, its ability to detect order blocks and identify supply and demand zones makes it an indispensable tool for any trader looking to enhance their strategy.
In conclusion, the Smart Money Setup 07 is a crucial tool for traders aiming to optimize their trading performance. By utilizing the concepts of Smart Money in technical analysis, traders can make more precise decisions and take advantage of market fluctuations.

Market Structure Inducements ICT [TradinFinder] CHoch BOS Sweeps🔵 Introduction
Market Structure is the foundation for identifying trends in the market, crucial in technical analysis and strategies like ICT and SMC. Understanding key concepts such as Break of Structure (BOS) and Change of Character (CHOCH) helps traders recognize critical shifts in the market. BOS, referring to a Market Structure Change (BMS), and CHOCH or Market Structure Shift (MSS) signal trend reversals in the market.
Additionally, the concept of Inducement, a vital tool in Smart Money strategies, allows traders to avoid price traps. Identifying valid pullback, valid inducement, POI, and Liquidity Grab helps traders find optimal entry and exit points and leverage Smart Money movements effectively.
Bullish Market Structure :
Bearish Market Structure :
🔵 How to Use
The Market Structure indicator is designed to help traders better understand market structure and detect price traps. By using this indicator, you can identify the right entry and exit points based on structural changes in the market and avoid unprofitable trades. Below, we explain the key concepts and how to apply them in trading.
🟣 Market Structure
Market Structure refers to the overall pattern of price movement in the market. Using this indicator, traders can identify uptrends and downtrends and make better trading decisions based on changes in market structure. The two key concepts here are Break of Structure (BOS) and Change of Character (CHOCH).
Change of Character (CHOCH) : CHOCH occurs when the market shifts from an uptrend to a downtrend or vice versa. These changes typically indicate a broader trend reversal, and the indicator assists you in identifying them accurately.
Break of Structure (BOS) : When the market breaks a key support or resistance level, it signals a change in market structure. This indicator helps you identify these breakouts in time and take advantage of trading opportunities.
🟣 Inducement
Inducement refers to price traps set by Smart Money to trick retail traders into making the wrong trades. This indicator helps you recognize these traps and avoid unprofitable trades.
Valid Inducement : Valid Inducement refers to deliberately created price traps by major market players to gather liquidity from retail traders. Once the market has collected sufficient liquidity, it makes the real move, and professional traders use this moment to enter.
🟣 Valid Pullback
A Valid Pullback refers to a temporary market retracement, indicating a price correction within the main trend. This concept is crucial in technical analysis as it helps traders enter trades at the right time and profit from the continuation of the trend. The Market Structure indicator can identify these valid retracements, allowing traders to enter trades with greater confidence.
🟣 Point of Interest (POI)
Another important concept in market analysis is the Point of Interest (POI), referring to key price areas on the chart. POI includes zones where significant price movements are likely to occur. The Market Structure indicator helps you locate these key points and use them as entry signals for trades.
🟣 Liquidity Grab
Liquidity Grab refers to a scenario where the market intentionally moves to areas where retail traders' stop losses are placed. The goal is to gather liquidity, allowing major players to execute trades at better prices. By using this indicator, you can spot these liquidity grabs and avoid falling into price traps.
🔵 Setting
ChoCh Detector Period : The period of identifying the major market levels that occur when they break ChoCh.
BoS & Liquidity Detector Period : The period of identifying minor levels, which are used to identify BoS and Liquidity levels.
Inducement Detector Period : The period of identification of Inducement levels.
Fast Trend Detector : This feature will help you update the major market structure levels sooner.
Inducement Type Detector : Two modes "Sweeps" and "Total" can be used to identify the levels of Inducement. In "Sweeps" mode only Levels detected by touch shadow. In "Total" mode, all Levels are detected.
🔵 Conclusion
In financial market analysis and forex trading, identifying Market Structure and Inducement is crucial. Market Structure helps you detect uptrends and downtrends, and understand Break of Structure (BOS) and Change of Character (CHOCH). The concept of Inducement also enables traders to spot Smart Money price traps and avoid unprofitable trades.
The Market Structure indicator is a powerful tool that, by analyzing the market structure and concepts like valid pullback and valid inducement, helps you make more precise trade entries. Additionally, by identifying POI and Liquidity Grab, the indicator gives you the ability to spot key market zones and use them to your advantage in trading.

Change in State of Delivery (CISD) [LuxAlgo]The Change In State Of Delivery (CISD) indicator detects and displays Change in State Of Delivery, a concept related to market structures.
Users can choose between two different CISD detection methods. Various filtering options are also included to filter out less significant CISDs.
🔶 USAGE
A Change in State of Delivery (CISD) is a concept closely related to market structures, where price breaks a level of interest, confirming trends and their continuations from the resulting breakouts.
Unlike more traditional market structures which rely on swing points, CISDs rely on a persistent sequence of candles, using the sequence extremes as breakout levels.
CISDs are detected as follows:
Bullish: The price closes above the opening price of the first candle in a sequence of bearish candles (or its own opening price if it's the only candle).
Bearish: The price closes below the opening price of the first candle in a sequence of bullish candles (or its own opening price if it's the only candle).
If a newly detected CISD aligns with the indicator's current established trend, this confirms a trend continuation (represented with a dashed line).
On the other hand, if a newly detected CISD is in the opposite direction to the detected trend it can confirm a trend reversal (represented with a solid line).
🔹 Liquidity Sweep Detection Method
Using Liquidity Sweeps to update CISD breakout levels allows us to obtain less frequent and more relevant levels that are less sensitive to noisy price variations.
Sweeps are obtained from detected Swing Points , with a higher Swing Length allowing us to obtain longer-term swing levels and potentially more detected sweeps from a specific level over time.
Note: The 'Swing Length' setting is only applicable on the Liquidity Sweep Detection Method and will only change the Liquidity levels.
A Liquidity Sweep is valid when the price reaches an important liquidity level , after which the price closes below/above this level.
Bullish scenario: The price goes below a previous unbroken Swing Low but closes above.
Bearish scenario: The price goes above a previous unbroken Swing High but closes below.
After a Liquidity Sweep has been detected, the last level of importance acts as support/resistance . Breaking this level in the other direction changes the state of delivery .
Users must keep observing the price and significant levels, as highlighted by the white rectangle in the above example.
🔹 CISD Filtering
Users can adjust the following two settings:
Minimum CISD Duration: The minimum length of the 'CISD' line
Maximum Swing Validity: The maximum length of the 'CISD' line; potential CISD lines that aren't broken are deleted when exceeding the limit.
The chart can get cluttered when the Minimum CISD Duration is low. Users could focus on a switch in trend (first solid line CISD ), where the following dashed CISD lines can be seen as extra opportunities/confirmations.
🔶 DETAIL
🔹 Using Different Timeframes
When an important liquidity level (Previous Swing high/low, FVG, etc.) is reached on the higher timeframe, the user can move to a lower timeframe to check whether there is a CISD .
Above example:
The high of the last candle breaches a liquidity level (previous Swing High). The opening price of the last candle acts as a trigger/confirmation level.
A confirmed CISD is seen in a lower timeframe, just after this Liquidity Sweep. This could be an early opportunity.
Later, a confirmed CISD on the higher timeframe is established.
🔶 SETTINGS
Detection Method: Classic or Liquidity Sweep
Swing Length: Period used for the swing detection, with higher values returning longer-term Swing Levels.
Minimum CISD Duration: The minimum length of the CISD line
Maximum Swing Validity: The maximum length of the CISD line; potential CISD lines that aren't broken are deleted when exceeding the limit.

Engulfing Candles with Sweep by AydmaxxEngulfing Candles with Sweep Indicator
The "Engulfing Candles with Sweep" indicator identifies bullish and bearish engulfing candles that exhibit liquidity sweeps. It marks these significant candlestick patterns and draws a 50% Fibonacci retracement line from the high to low of the engulfing candle. The indicator helps traders spot potential reversal points where large market players might be accumulating or distributing positions.
Key Features:
Bullish Engulfing Candle with Sweep:
Identifies when a bullish candle (closing higher than it opened) engulfs the previous bearish candle (closing lower than it opened).
Ensures that the bullish candle’s low is lower than the previous candle’s low, indicating a sweep of liquidity.
Marks the identified bullish candle with a symbol below the candlestick.
Draws a 50% Fibonacci retracement line from the high to the low of the bullish engulfing candle.
Bearish Engulfing Candle with Sweep:
Identifies when a bearish candle (closing lower than it opened) engulfs the previous bullish candle (closing higher than it opened).
Ensures that the bearish candle’s high is higher than the previous candle’s high, indicating a sweep of liquidity.
Marks the identified bearish candle with a symbol above the candlestick.
Draws a 50% Fibonacci retracement line from the high to the low of the bearish engulfing candle.
Customizable Settings:
Fibonacci Line Color: Allows customization of the Fibonacci retracement line color for both bullish and bearish engulfing candles.
Fibonacci Line Style: Provides options to choose the line style (solid, dotted, dashed).
Fibonacci Line Width: Enables adjustment of the line width for better visibility.
Toggle Fibonacci Lines: Option to enable or disable the display of Fibonacci retracement lines.
How to Use:
Apply the indicator to your chart.
Look for symbols below or above the candlesticks, indicating bullish or bearish engulfing candles with liquidity sweeps.
Utilize the 50% Fibonacci retracement lines to identify potential support or resistance levels.
Benefits:
Helps in identifying key reversal patterns in the market.
Provides visual aids with Fibonacci retracement levels for potential entry and exit points.
Enhances trading decisions by confirming engulfing patterns with liquidity sweeps.
Liquidity Swings & SweepsThis Pine script indicator is designed to create a visual representation liquidity as identified by swing Highs/Lows along with an indication of the liquidity level that was swept, optionally rating the strength of the sweep based on time & price.
Relevance:
Liquidity levels & sweeps are crucial for many SMC/ICT setups and can indicate a point at which the price changes direction or may re-trace in an opposite direction to provide additional liquidity for continued move in the original direction. Additionally, liquidity levels may provide targets for setups, as price action will often seek to take out those levels as they main contain many buy/sell stops.
How It Works:
The indicator tracks all swing points, as identified using user-defined strength of the swing. Once a swing is formed that meets the criteria, it is represented by a horizontal line starting at the price of the current swing until the last bar on the chart. While the swing is valid, this line will continue to be extended until the swing is invalid or a new swing is formed. Upon identifying a new swing, the indicator then scans the earlier swings in the same direction looking for a point of greatest liquidity that was taken by the current swing. This level is then denoted by dashed horizontal line, connecting earlier swing point to the current. At the same time any liquidity zones between the two swings are automatically removed from the chart if they had previously been rendered on the chart. If the setting to enable scan for maximum liquidity is enabled, then while looking back, the indicator will look for lowest low or highest high that was taken by the current swing point, which may not be a swing itself, however, is a lowest/highest price point taken (mitigated) by the current swing, which in many cases will be better price then then the one represented by previous swing. If the option to render sweep label is enabled, the sweep line will also be completed by a label, that will score the sweep and a tooltip showing the details of the level swept and the time it took to sweep it. The score explained further in configurability section ranks the strength of the sweep based on time and is complemented by price (difference in price between the two liquidity levels).
Configurability:
A user may configure the strength of the swing using both left/right strength (number of bars) as well as optionally instruct the indicator to seek the lowest/highest price point which may not be previous swing that was taken out by newly formed swing.
From appearance perspective liquidity level colors & line width presenting the liquidity/swing can be configured. There is also an option to render the liquidity sweep label that will generate an icon-based rating of the liquidity sweep and a tooltip that provides details on the scope of the swing, which includes liquidity level swept and when it was formed along with the time it took to sweep the liquidity.
Rating is of sweeps is primarily based on time with a secondary reference to price
💥- Best rating, very strong sweep with an hourly or better liquidity sweep
🔥- Second rating, strong sweep with 15 – 59 minute liquidity sweep, or 5+ minute sweep of 10+ points
✅- Third rating, ok sweep with 5 - 15 minute liquidity sweep, or lower-time-frame sweep of 10+ points
❄️ - Weakest sweep, with liquidity of 5 or less minutes swept
What makes this indicator different:
Designed with high performance in mind, to reduce impact on chart render time.
Only keeps valid liquidity levels & sweeps on the chart
Automatically removes previously taken liquidity levels
Ranks liquidity sweeps to indicate strength of the sweep

Market Structure with Inducements & Sweeps [LuxAlgo]The Market Structure with Inducements & Sweeps indicator is a unique take on Smart Money Concepts related market structure labels that aims to give traders a more precise interpretation considering various factors.
Compared to traditional market structure scripts that include Change of Character (CHoCH) & Break of Structures (BOS) -- this script also includes the detection of Inducements (IDM) & Sweeps which are major components of determining other structures labeled on the chart.
SMC & price action traders have historically considered this a more accurate representation of market structure by including these components.
🔶 USAGE
Below we can see a diagram for how market structure is displayed within the Market Structure with Inducements & Liquidity indicator.
Change of Characters (CHoCH) are based on swing points detection, while Break of Structures (BOS) are based on trailing maximum & minimums from the detected Change of Characters. We do this for a more dynamic & timely display of market structure.
🔹 Inducements (IDM)
Traders that consider inducements as a part of their analysis of Change of Characters & Break of Structures can more easily avoid fakeouts within trends as shown below.
In this script IDM's are always required between each market structures.
🔹 Sweeps of Liquidity (x)
SMC traders looking to properly analyze market structure need to look for sweeps of liquidity to ensure levels that are wicked are noted as sweeps, while levels that are fully closed above / below are labeled as confirmed market structures.
In the chart below we can see a Sweep of Liquidity which typically can occur on the longer term price action and indicate a potential reversal.
Notably, since labels such as CHoCH or BOS's can occur at the same level as a Sweep of liquidity, we have allowed the indicator to display the market structure label at the current bar in the event this happens.
The Sweeps of Liquidity are also based on trailing maximum / minimum, which allows for a continuous evaluation of areas for liquidity sweeps to occur.
This can be helpful for traders looking for longer term & shorter term sweeps.
🔶 SETTINGS
CHoCH Detection Period: Detection period for CHoCH's, higher values will return longer term CHoCH's.
IDM Detection Period: Detection period for IDM's, higher values will return longer term IDM's.
Thank you all for 500k followers on TradingView! Enjoy!
