[PX] Session LevelHello guys,
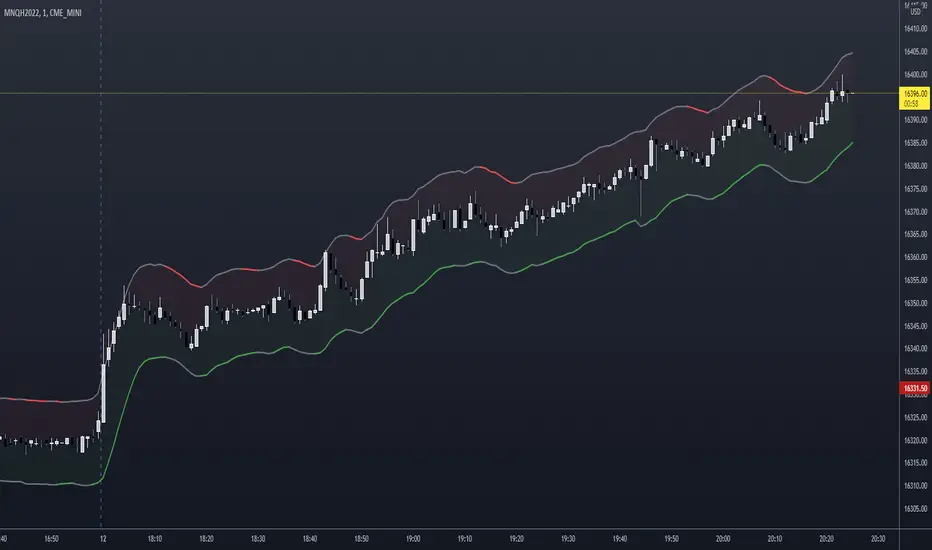
this scripts prints the high and low as well as the moving average of a user-defined session.
How does it work?
Basically, as soon as we are in the session range, the indicator will constantly keep track of the high and the low of this range. It also prints the moving average, which can either be a floating or a static line, that represents the latest MA value.
The indicator comes with multiple options to style the printed lines.
If you find this indicator useful, please leave a "like" and hit that "follow" button :)
Have fun and happy trading :)))
P.S: Check my signature if you want to get in touch with me.
Support

Swing Low Sweet ChariotI've been using this indicator now for the past few months and seen some very large profits as a result of it.
I've been using this successfully on the one hour FX charts, but seems to work equally as well on higher or lower time frames (not less than 30min).
I've added in some support and resistance functionality and plenty of settings to play with to fine tune to your strategy.
One of the main reasons that I've added in some support and resistance is that there are some times when an indicator is triggered very close to a S&R point then I may not take the trade.
Additionally to the indicator, I'll use trend lines, ADX and RSI to confirm the trend.
Alerts are set up for Long Entry, Short Entry, Long Exit and Short Exit.
Not that the exit points are approximate and won't hit the peaks, however they will prevent price retracement.
Offering 5-day free use of the indicator and then after that it will be £100/yr if you like the indicator. This will also cover all future updates.
Happy to answer any questions or send over other screenshots of currency pairs. Also happy to work with any other users if they have any ideas for improving (i.e. automated trend lines).
Cheers
Mike

[HWVZ] Hiubris WeisVolume ZigZagThis script follows the Zig Zag pattern of price movement, based on the Weis Wave Volume indicator.
The Weis Wave Volume shows the cumulative volume from the lowest point of the price swing to the highest point (or vice versa)
The user has the option to change the Trend Detection Length of the indicator to adjust the swings frequency (from say 5 to any value above or below)
The user has the option to display Support & Resistance lines based on those turning points
The user has the option to display Info Labels for each swing
The user has the option to change the Weis Wave Volume Timeframe
*This is a Tradingview interpretation of the Weis Wave Plugin

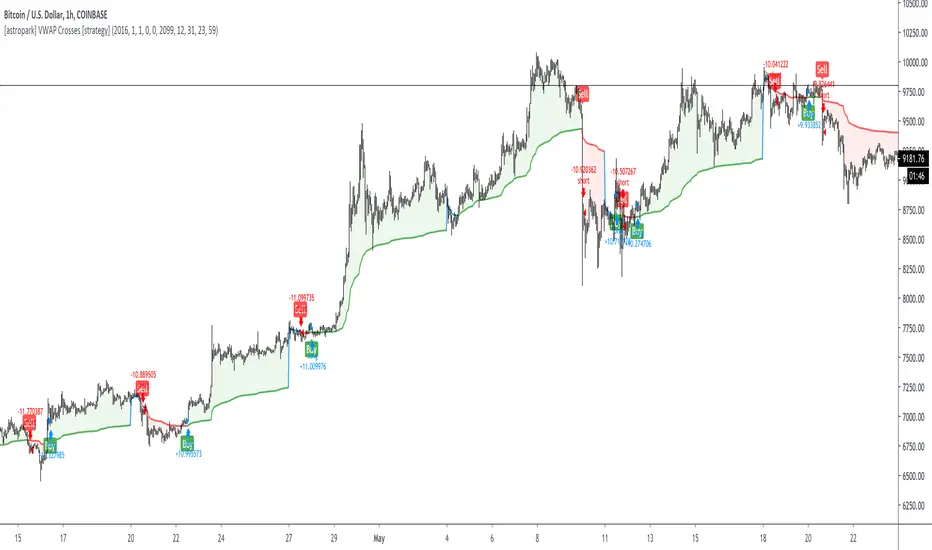
[astropark] VWAP Crosses [strategy]Dear Followers,
today a new Swing and Scalping Strategy based on WVAP , mainly designed for Bitcoin and High-Cap Cryptocurrencies, like Ethereum. It works also on Forex and Stocks.
It works great since 15m and above till 1D. I suggest you to use it on 15m, 30m or 1h timeframes .
VWAP or "Volume Weighted Average Price" is a volume-based indicator similar to a moving average.
This trading indicator is used to identify market resistance and support levels and is represented as a weighted average price for the treaded volumes.
My strategy will help you identify main support-resistance level to be careful of and it will trigger a buy or a sell depending on how price will intereact with vwaps.
green means we are in a bullish trend, in fact it start with a "buy" signal
red means we are in a bearish trend, in fact it start with a "sell" signal
blue means we are in a moment where trend may change, so be careful and always remember that taking profits is awesome and have a stoploss is a must in trading
The user who wants to use this strategy, especially via an automated bot, must always set a stoploss (example 150$ from entry on bitcoin) or use a proper risk management strategy .
This is not the "Holy Grail", so use it with caution. It's highly suggested to use a proper money management .
This script will let you backtest this script and check profitability on your preferred market.
The alarms version of this indicator, which will let you set all notifications you may need in order to be alerted on each triggered signals, can be found by searching for astropark "VWAP Crosses"
This is a premium indicator , so send me a private message in order to get access to this script.
gannoddsquare levels from DAY high lowGann Square of 9
Odd square to odd square
Start is auto chosen based upon :
day_close greater than day_open
then start equals day_low
or
day_close less than day_open
then start equals to day_high
Gap == 4 then distance is odd to odd square, Example = 121 -169 , 169-225,...
If Gap is increased to 8 then distance will be double the odd square, Example = 121 -225, 225-289,...,
- 1 odd square distance has been filled with purple background
- total 16 targets
-Any doubt feel free to ask.

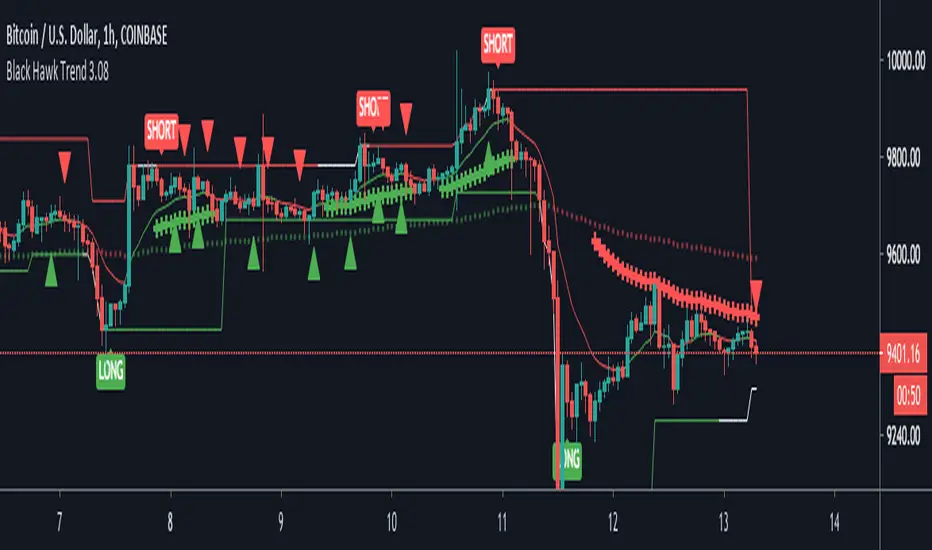
Black Hawk Trend 3The Black Hawk Trend indicator uses data from sources (such as EMAs, RSI, Stochs) to derive a trend direction. This indicator contains a pivot line that turns green when there is a buy position (lower bar) and it turns red when there is an active sell position (upper bar).
When there is a buy/sell signal, this does not mean buy immediately at this point, but rather look for a potential entry.
This indicator has the ability to treat buy and sells separately (Default: 2 account method) or it can use them in tandem (1 account method).
There is a toggle in the settings to modify the code for Bitcoin vs Forex (& Stocks).
When there is a strong trend, a red/green “+” sign shows up; this typically means take caution when trying to take a position countertrend.
There are also red/green triangles that signify a potential area to add to a position.
#Disclaimer:
1. I am not a financial advisor.
2. I do not guarantee this script will provide consistent profits or that anyone can make money with it.
Use the link below to obtain access to this indicator.
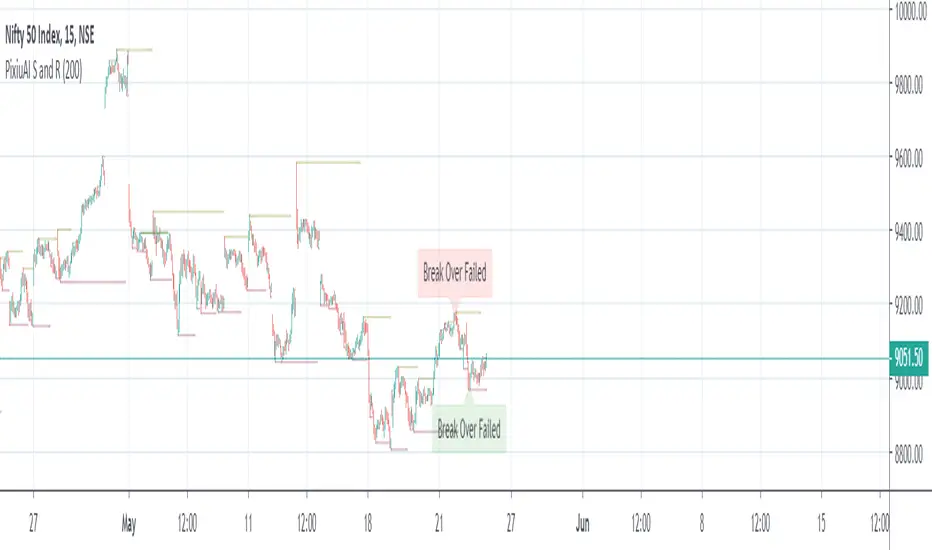
Pixiu AI - Support and ResistanceSupport and Resistance prices are the previous points of highs and lows in the price. The market tends to stick around in price regions and directional trends. Using these price points one can wait and take the following decisions:
- when the price reaches the support point, they can take a long position if they observe the price staying in the price range and make profits from till it gains back up to the resistance point. (and vice-versa)
- when the price breaks the support/resistance (S&R) points and continues in that direction in addition to high volumes supporting it, people can take a bullish trade
- when the price breaks the S&R point, traders can wait for the price to return to the S&R point to make a final decision of whether it wants to go up or not. A price tested strategy is considered stronger than just price breaks
We at The Pixiu want to help you in your daily trade, and therefore we present you an auto Support and Resistance indicator that also highlights the points of crossovers to the users in the live market. Use this for assistance while trading and share your feedback with us.
There are 3 parameters for the indicator:
- Short-range S&R
- Mid-range S&R
- Identify the point of S&R testing (when price crosses over and returns back in the range)
Session S/RThis indicator marks the resistances and supports of the post, pre and market sessions of the previous day projecting up to the market of the day, also it marks the hours of these three markets allowing to identify the beginning and end of the sessions in London, Hong Kong, and America.

Candlestick Reversal SystemHello Traders,
In the book "Secrets of a Pivot Boss: Revealing Proven Methods for Profiting in the Market" by Franklin Ochoa, Four different types of reversal systems were introduced and candlestick patterns are used to find reversals. I will not write a lot about the book, you should get/read it for yourself. There are many great ideas in the book, Candlesetick Reversal System, Following Trend, Time Price Opportunity, Advanced Camarilla Concepts and much more.
Reversal systems mentioned in the book are :
- Wick Reversal System
- Exteme Reversal System
- Outside Reversal System
- Doji Reversal System
I tried to add these four reversal systems to the script. If you need detailed info you better read the book ;)
Enjoy!

K2 SR v2This indicator is used to automatically plot the strongest support and resistance points that are nearest to the current price.
This indicator works on all assets and all time frames so it is applicable to all traders whether you are a scalper, intraday or swing trader.
Additionally, you can adjust the settings to have the indicator scan for closer or farther support and resistance points to tailor specifically to your trading strategy.
This indicator was updated to include previous support and resistance price points with the addition of the option to enable zones including the wicked areas.
Use the link below to obtain access to this indicator.

Close IndicatorThis indicator plots out several horizontal lines, they can be used as both support and resistance. The transparent lines a little above and below the lines are "spread lines" which are intended to be used to place orders such that in case price gets very close but not exactly the same price, the long/short orders still get filled.
The lines themselves are plotted using some candle closes +- some spread (which can be adjusted to fit the asset you are trading)
The longer the line is, the more importance it has, the length of the lines are in this order (by colour)- White > Pink > Peach > Gray > Purple > Orange > Teal > Yellow
Orange, Teal and Yellow lines are only to be used for scalping, all the other lines can be used for everything else (swing trading, scalping, accumulation, long term trading)

Kitsune's Long/Short Support v1.0.0After reviewing all feedback and questions I got from the users of my previously published script (Kitsune Indicator Collection), I decided to publish a new one which is easier to interpret and use. Therefore the script is as clean as possible thereby minimizing visual clutter (or at least I tried ).
This script is an evolution of my precious script and is still a combination of the following items:
- High-Low detector
- Parabolic SAR (Stop and Reversal) setups and triggers
- Ehlers Instantaneous Trendline (EIT) indicator
- Range detector
- Support and Resistance detector
- Daily/Weekly/Monthly open visualization
The script uses the SAR and EIT to detect long/short signals.
-----------------------------------------------------------------------------------------------------------------------------------------------
A signal is decided to be STRONG when SAR trigger coincides with trend reversal of the EIT.
A STRONG long signal is painted (i.e. blue label with L+) when:
- SAR long trigger (blue arrow) coincides with an EIT crossover (blue line crosses over the red line).
A STRONG short signal is painted (i.e. red label with S+) when:
- SAR short trigger (red arrow) coincides with an EIT cross-under (blue line crosses under red line).
A STRONG signal will always result in entering (if not in any position) or flipping a long/short position.
-----------------------------------------------------------------------------------------------------------------------------------------------
A signal is decided to be WEAK when not in a long or short position and a SAR trigger appears.
A WEAK long signal is painted (i.e. blue label with L-) when:
- Not in a position (gray bars) and a SAR long trigger (blue arrow) appears but not coinciding with an EIT crossover.
A WEAK short signal is painted (i.e. red label with S-) when:
- Not in a position (gray bars) and a SAR short trigger (red arrow) appears but not coinciding with an EIT cross-under.
A WEAK signal will only result in a long/short position when not in any position.
-----------------------------------------------------------------------------------------------------------------------------------------------
A long/short position is exited on a trend reversal of the EIT.
A short position is exited (i.e. red x-cross) when:
- A crossover of the EIT happens (blue line crosses over the red line).
A long position is exited (i.e. blue x-cross) when:
- A cross-under of the EIT happens (blue line crosses under the red line).
-----------------------------------------------------------------------------------------------------------------------------------------------
Color of the bars are depend on position type:
- Blue = Long position
- Red = Short position
- Gray = No position
-----------------------------------------------------------------------------------------------------------------------------------------------
Enjoy using the script. I hope it is of value to you!
If you have any questions, don't hesitate to contact me.
With kind regards,
Kitsune (L3F03X)

Support and Resistance Multi Time frameSimple indicator showing the support and resistance on Daily, Weekly and Monthly time frames no matter what time frame you're currently on by highlighting the highest and lowest points on each over the last 34 bars.
Daily support and resistance are coloured green.
support and resistance are coloured yellow.
Monthly support and resistance are coloured red.
For best results check where multiple support and resistance areas line up and combine with another indicator for example oscillators to gauge if the support or resistance will reverse the market.

NSDT Auto Support / Resistance LevelsSimple script that automatically plots support and resistance lines based on the pivot points of the number of candles you choose to look back upon.
All options are editable.


NSDT Daily Gap RangeSimple script that plots the range between the previous day close and the current day open. This makes it easier to reference the gap up or gap down zone throughout the day.

NSDT Scalping ChannelThis script uses the highs and lows of the candles (instead of the close) to make a "channel" to reference while scalping.
Use the green lower line as a guide to go long and the red upper line as a guide to go short. You may use the lines as potential entry points and direction but you may want to consider exiting before the opposite colored line prints, as that may be too late. As always, entries and exits are at the discretion of each trader.
You will need to adjust the "Line Spacing" settings as you change instruments, chart timeframes, and/or volatility increases/decreases.
Auto FibonacciA series of Fibonacci sequences using a variety of triggers to base highs and lows off.
High and low look back length can be altered, fibs and fib extensions can be shown or hidden and the background can be filled or transparent.
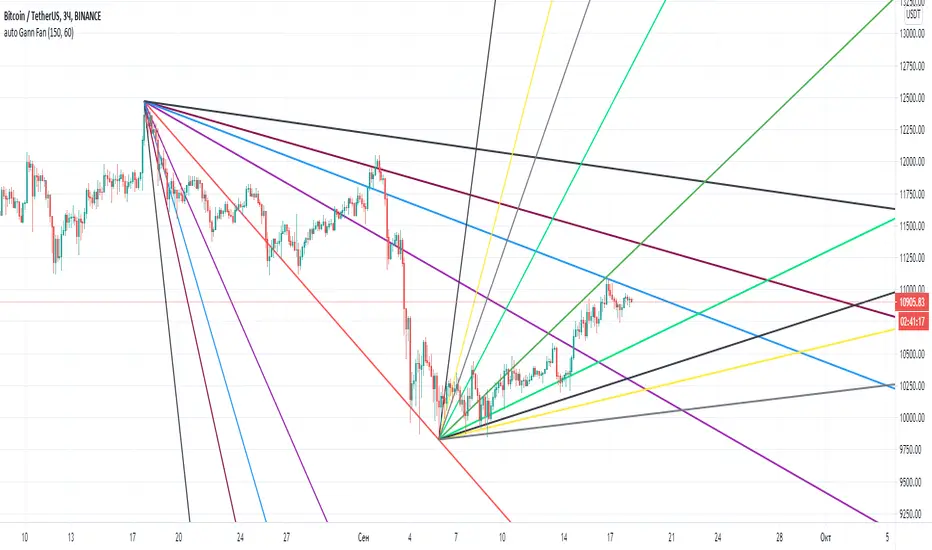
Gann Fan AutomaticAutomatic Gann fan indicator. Works on all charts and time frames.
The idea was to create this indicator so as not to rearrange the Gann fan.
It is good to navigate the lines as resistance and support.
The settings consist of two parameters.
1 this is for the calculation from the local high.
2 for the calculation from the local Low.
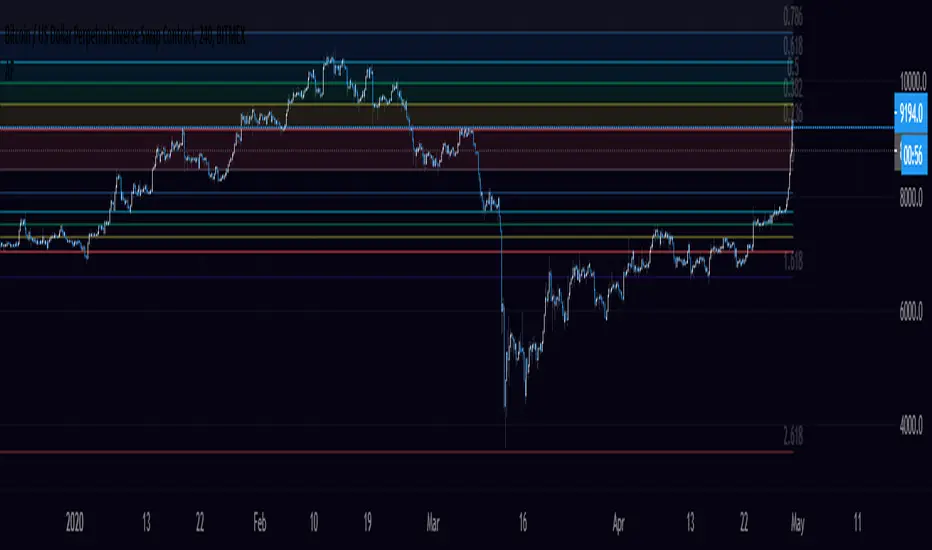
Donchian Channels with Auto Fibonacci RetracementRichard Donchian created Donchian Channels, which is a type of moving average indicator and a look-alike of other support and resistance trading indicators like Bollinger Bands.
Donchian Channels has a simple plotting of highest high and lowest low of the last “n” periods.
The “n” periods is based on the trader’s choice, who can select the period according to their requirements ranging from a day, hour and minutes etc.
Traders use Donchian Channels to understand the support and resistance levels.
Donchian Channels is a popular indicator for determining volatility in market prices.
The channels are wider when there are heavy price fluctuations and narrow when prices are relatively flat.
Generally, investors use 20-periods with the Donchian Channels as the default trading setting, but this value can be tweaked based on your trading style.
Donchian channels are mainly used to identify the breakout of a stock or any traded entity enabling traders to take either long or short positions.
Traders can take a long position, if the stock is trading higher than the Donchian channels “n” period and book their profits/short the stock if it is trading below the DC channels “n” period.
The middle band is the average of the upper and lower bands.
The middle band in Donchian channels could also be used as a breakout indicator.
If the stock rises above the middle band of the Donchian channels, then you can open a long position.
On the contrary, if the stock is trading below the middle band of the Donchian channel, then a trader can open a short position.
Combining Donchian Channel trading strategies with other trading strategies might decrease the false entry/exit signals and give a clearer picture of trading opportunities.
If you start to trade a choppy market on an intraday basis, you will be overloaded with false signals.
So, what I noticed is that in order for things to become clearer, we just need to increase the time frame.
Where Donchian Channels Can Fail You
It’s likely not the indicator but more likely our misinterpretation of the signals.
Few areas where the Donchian channel may be tough to read.
Low float stocks are not bound by any indicator, especially Donchian channels.
The challenge with the Donchian channels is that it does not factor in the most recent market volatility.
The indicators provide an equal weighting to all data points.
Therefore when a low float stock picks up and goes on a run, the lower bounds not capture the price movements quickly enough, thus risking giving back more profits than necessary.

Pivot Point SupertrendHello All,
There are many types of SuperTrend around. Recently I thought about a Supertrend based on Pivot Points then I wrote "Pivot Point SuperTrend" script. It looks it has better performance on keeping you in the trend more.
The idea is behind this script is finding pivot point, calculating average of them and like in supertrend creating higher/lower bands by ATR. As you can see in the algorithm the script gives weigth to past pivot points, this is done for smoothing it a bit.
As I wrote above it may keep you in the trend more, lets see an example:
As an option the script can show main center line and I realized that when you are in a position, this line can be used as early exit points. (maybe half of the position size)
While using Pivot Points, I added support resistance lines by using Pivot Point, as an option the script can show S/R lines:
And also it can show Pivot Points:
When you changed Pivot Point Period you can see its reaction, in following example PP period is 4 (default value is 2). Smaller PP periods more sensitive trendlines.
Alerts added for Buy/Sell entries and Trend Reversals. (when you set alerts use the option " Once Per Bar Close ")
ENJOY!

Phicube EMASAR ( EMA Support and Resistance )Indicator based on the Concept created by Bo Williams. But unlike the original that uses MIMAs, EMAs are used here.
Exponential moving averages will be shown according to fractal alignment, in order to show the important support and resistance levels ( SAR ).
When the fractals are aligned to become support,
we will have the EMA in the graph with a bright color.
When the fractals are aligned to become resistance, we will have EMA in the graph with a matte color.
Available exponential moving averages: 17,34,72,144,305,610,1292 and 2584
____________________________________________________//_____________________________________________________________________
Indicador baseado no Conceito criado pelo Bo Williams. Mas diferente do original que utiliza MIMAs, aqui é utilizado EMAs.
As médias móveis exponenciais serão mostradas de acordo com o alinhamento dos fractais, com objetivo de mostrar os níveis importantes
de suporte e resistência( SAR ).
Quando estiver com os fractais alinhados virando suporte, teremos no gráfico a EMA com uma cor em tom brilhante.
Quando estiver com os fractais alinhados virando resistência, teremos no gráfico a EMA com uma cor em tom fosco.
Médias móveis exponenciais disponíveis: 17,34,72,144,305,610,1292 e 2584

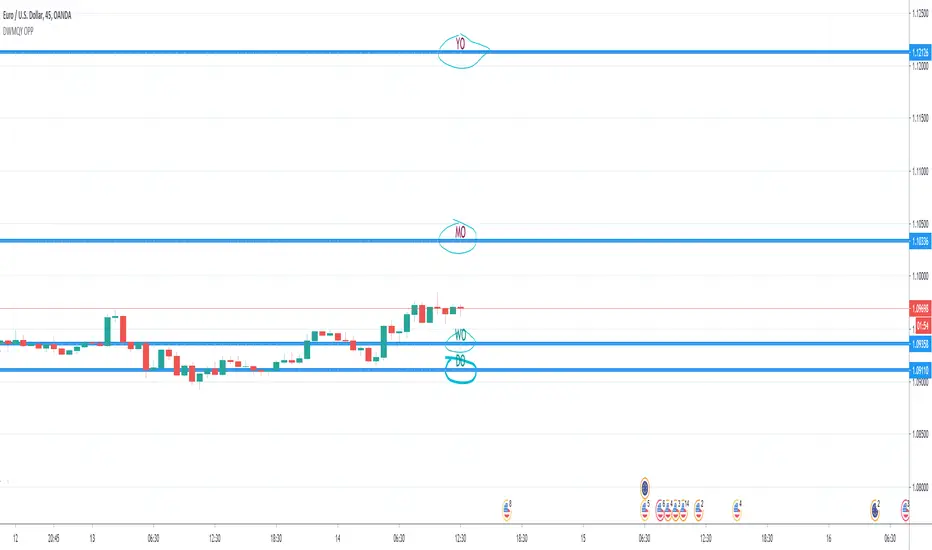
Day & Week & Month & Quarter & Year Open Price PointsPresent to your attention, basic “Day & Week & Month & Quarter & Year Open Price Points Indicator” !
You can determine support & resistance using Yearly, Quarterly, Monthly and Weekly open price points on a chart with any timeframe.
It is not a widely used technique, but according to different academic studies, levels are reliable. Google it! You can enhance your trading by adding that technique in your tool list.
At the current stage, Indicator shows Open Price Points.
Opening price points are extended into the future from the opening candle of each year, quarter, month and week and day.
By nature of that points, every level may be used as a support and as a resistance level at a similar time.
Initial setup:
1) Open the indicator Inputs settings, enable/disable additional Price Points.
2) Open the indicator Style settings, click on a style of each line and click on a “Price Line.”
How to use that?
With a lot of available strategies, there are two leading: Level convergence and Trend line convergence.
1) Level convergence involves locating two or more opening points that merge. This confluence can lead to greater accuracy and profitability.
2) Trend line convergence - The intersection of a trend line at a weekly, monthly, quarterly or even yearly opening level can produce fast and profitable reactions.
Try that!
As a stand-alone strategy, you can utilize that:
Price action under the WO (DO, MO, QO, YO) – Bearish
Price action above the WO (DO, MO, QO, YO) – Bullish
TIP: opening level not always good as a stand-alone tool!
Indicator Settings:
Show Daily Open (disabled by default)
Show Weekly Open (ON by default)
Show Monthly Open (ON by default)
Show Quarter Open (disabled by default)
Show Yearly Open (disabled by default)
Indicator Styling:
By default, each line is shown in the form of circles, line-width 1, silver colour.
Labels can be only in one of two states: Maroon (if open price less than ((open + high + low + close)/4) or Teal (if open price high than ((open + high + low + close)/4).
Alerts:
With the Indicator you can add a few different alerts:
DO Alert
WO Alert
MO Alert
QO Alert
YO Alert
Play with it:
Add a new alert with following condition: your SYMBOL crossing DWMQY OPP Weekly Open.
Options: Once per Bar.
Future of the Indicator:
The Indicator is a necessary part of more prominent Indicator which will include 8 modules in total:
2~ Arabian Wise Tunnels Module
3~ RH Waves Module (something like Vegas Waves)
4~ Trend Channels Module
5~ Opening Range Zoning Module
6~ Breakout Module
7~ BS Hemisphere Module
8~ Price Action Module
DISCLAIMER! RISK WARNING!
PAST PERFORMANCE IS NOT NECESSARILY INDICATIVE OF FUTURE RESULTS. TRADERS SHOULD NOT BASE THEIR DECISION ON INVESTING IN ANY TRADING PROGRAM SOLELY ON THE PAST PERFORMANCE PRESENTED, ADDITIONALLY, IN MAKING AN INVESTMENT DECISION, TRADERS MUST ALSO RELY ON THEIR OWN EXAMINATION OF THE PERSON OR ENTITY MAKING THE TRADING DECISIONS.
//Written by iambitboy request.