Quantum Ribbon Pro - BacktesterQuantum Ribbon Pro - Backtester
Official backtesting tool for the Quantum Ribbon Pro indicator.
Test the indicator's performance with historical data across any market and timeframe.
📋 What Is This?
A backtesting tool designed to validate Quantum Ribbon Pro signals through historical analysis.
Use it to:
Test signals on historical data
Evaluate risk management settings
Assess signal quality across different markets
Test entry/exit strategies before live trading
⚙️ Features
Signal Generation
- Trending signals with EMA + momentum confirmation
- Ribbon Bounce signals for pullback entries
- Signal Sensitivity control (1-10)
- Signal Cooldown system
- Confidence scoring (1-8 scale)
Signal Filters
- TP RSI Confirmation (all 5 ribbon pairs must align)
- Higher Timeframe Filter (15min to Weekly)
- S/R Auto-Detection (only trade at key levels)
- Quantum Range Filter (avoid choppy markets)
- Trading Hours Filter (restrict to specific sessions)
- Weekend alerts toggle
S/R Auto-Detection
- Automatic Support/Resistance detection via pivot points
- Longs only near support, shorts only near resistance
- Adjustable strength: Weak/Normal/Strong
- Customizable touch zone (0.1-5.0%)
- Optional visual zones display
Exit Management
- Ribbon Flip Exit (exits when ribbon flips against position)
- Adjustable flip sensitivity (1-5)
- Automatic position closure on reversal
Stop Loss Methods
- ATR-based (adapts to volatility)
- Fixed percentage (0.5-10%)
- Swing points (recent highs/lows with buffer)
- Adjustable distance: Tight/Normal/Wide
Take Profit System
- Single target: 1.5R / 2R / 3R
- Partial Take-Profits (enabled by default):
- TP1: 50% @ 1.5R
- TP2: 30% @ 2R
- Final: 20% @ 2.5R
- Break-even stop (triggered after TP1, TP2, or custom R:R)
Risk Management
- Position sizing
- Realistic commissions
- Slippage modeling
- Max drawdown tracking
- Win rate & profit factor metrics
Alerts
- Entry alerts (Long/Short)
- Entry @ S/R alerts (when S/R filter active)
- TP1/TP2 hit alerts
- Break-even move alerts
- Message formats: Simple/Detailed/JSON/Custom
- Template system with placeholders ({{ticker}}, {{entry}}, {{stop}}, {{tp}}, {{direction}}, {{confidence}}, {{atr}}, {{rr}})
- Webhook-ready JSON format
Customization
- Ribbon settings (custom EMA ranges and pair widths)
- Alert message templates
- Session-based trading hours
- Weekend trading control
🚀 Quick Start
Add the backtester to your chart with price action
Default Settings
Signal Settings:
- Signal Sensitivity: 5
- S/R Auto-Detection: Optional
- Ribbon Flip Exit: Optional
Risk Management:
- Stop Method: ATR
- Stop Distance: Normal (2.0x ATR)
- Take Profit: 2R
Partial Take-Profits: Enabled
- TP1: 50% @ 1.5R
- TP2: 30% @ 2R
- Final: 20% @ 2.5R
Review Results
Check win rate, profit factor, and max drawdown in the strategy report
💡 Usage Notes
Testing Approach:
Start with default settings
Test on your market/timeframe
Adjust based on results
Validate across multiple time periods
⚠️ Important
Past performance doesn't guarantee future results.
Validate on multiple markets and timeframes.
Use proper position sizing.
Strategytesting

ICT Entry V2 [TS_Indie]📌 Description – ICT Entry V2
The market structure, liquidity, FVG, and iFVG mechanisms remain the same as in Version 1.
However, the price action for order entries is different, with the positions of the FVG and iFVG swapped.
Pending orders and stop loss are placed at the iFVG.
⚙️ Core Logic & Working Mechanism
I won’t explain FVG in detail, as most traders are already familiar with it.
Let’s focus on the mechanism of iFVG instead.
The concept of iFVG is based on a supply-to-demand flip and a demand-to-supply flip within an FVG zone.
For an iFVG to be confirmed, the candle close must break through the FVG.
A wick alone does not count as a valid iFVG confirmation.
The confirmation of market structure swings uses a pivot length mechanism combined with price action.
It validates a swing by detecting a structure break formed by candles making new highs or new lows.
📈 Buy Setup
1.Liquidity sweep on the demand side, with price closing above the liquidity level.
2.A demand zone is formed as iFVG and FVG, where FVG is located above iFVG.
3.The gap between the upper box of iFVG and the lower box of FVG must be within the defined Min and Max range.
4.Market Structure must be in a Bullish trend.
5.Place a Pending Order at the upper box of iFVG and set Stop Loss at the lower box of iFVG (Entry and Stop Loss can be adjusted using Entry Zone and ATR-based Stop Loss).
📉 Sell Setup
1.Liquidity sweep on the supply side, with price closing below the liquidity level.
2.A supply zone is formed as iFVG and FVG, where FVG is located below iFVG.
3.The gap between the lower box of iFVG and the upper box of FVG must be within the defined Min and Max range.
4.Market Structure must be in a Bearish trend.
5.Place a Pending Order at the lower box of iFVG and set Stop Loss at the upper box of iFVG (Entry and Stop Loss can be adjusted using Entry Zone and ATR-based Stop Loss).
⚙️ Liquidity Sweep Conditions
➯ When a liquidity sweep occurs on the demand side, the system will start looking for Buy Setup conditions.
➯ When a liquidity sweep occurs on the supply side, the system will immediately switch to looking for Sell Setup conditions.
➯ The system will always prioritize the most recent liquidity sweep and search for setups based on that direction.
➯ The liquidity sweep condition will be invalidated when price closes back below (for demand sweep) or above (for supply sweep) the most recently swept liquidity level.
⭐ Pending Order Cancellation Conditions
A Pending Order will be canceled under the following conditions:
1.A new Price Action signal appears on either the Buy or Sell side.
2.When Time Session is enabled, the Pending Order is canceled once price exits the selected session.
🕹 Order Management Rule
When there is an active open position, the indicator restricts the creation of new Pending Orders to prevent overlapping positions.
⚠️ Disclaimer
This indicator is designed for educational and research purposes only. It does not guarantee profits and should not be considered financial advice. Trading in financial markets involves significant risk, including the potential loss of capital.
🥂 Community Sharing
If you find parameter settings that work well or produce strong statistical results, feel free to share them with the community so we can improve and develop this indicator together.

Closed Source Strategy TesterAllows you to test an indicator that is closed source (you don't have access to the code). You will need to understand the exposed data elements of the indicator you are testing. This strategy is only looking for a buy, sell, exit long, or exit short to be signals that change from 0 to 1. The stop loss/take profit, if used, are expected to be price values.
I encourage you to copy this code and modify it to your needs for specific indicators.

ICT Entry V1 [TS_Indie]📌 Description – ICT Entry V1
This trading system is based on price action, combined with FVG, iFVG, and liquidity, and it uses the mechanism from the indicator “Smallest Swing ” to validate swings that become liquidity.
⚙️ Core Logic & Working Mechanism
I won’t explain FVG in detail, as most traders are already familiar with it.
Let’s focus on the mechanism of iFVG instead.
The concept of iFVG is based on a supply-to-demand flip and a demand-to-supply flip within an FVG zone.
For an iFVG to be confirmed, the candle close must break through the FVG.
A wick alone does not count as a valid iFVG confirmation.
The confirmation of market structure swings uses a pivot length mechanism combined with price action.
It validates a swing by detecting a structure break formed by candles making new highs or new lows.
📈 Buy Setup
1.Liquidity sweep on the demand side, with price closing above the liquidity level.
2.A demand zone is formed as FVG and iFVG, where iFVG is located above FVG.
3.The gap between the upper box of FVG and the lower box of iFVG must be within the defined Min and Max range.
4.Market Structure must be in a Bullish trend.
5.Place a Pending Order at the upper box of FVG and set Stop Loss at the lower box of FVG (Entry and Stop Loss can be adjusted using Entry Zone and ATR-based Stop Loss).
📉 Sell Setup
1.Liquidity sweep on the supply side, with price closing below the liquidity level.
2.A supply zone is formed as FVG and iFVG, where iFVG is located below FVG.
3.The gap between the lower box of FVG and the upper box of iFVG must be within the defined Min and Max range.
4.Market Structure must be in a Bearish trend.
5.Place a Pending Order at the lower box of FVG and set Stop Loss at the upper box of FVG (Entry and Stop Loss can be adjusted using Entry Zone and ATR-based Stop Loss).
⚙️ Liquidity Sweep Conditions
➯ When a liquidity sweep occurs on the demand side, the system will start looking for Buy Setup conditions.
➯ When a liquidity sweep occurs on the supply side, the system will immediately switch to looking for Sell Setup conditions.
➯ The system will always prioritize the most recent liquidity sweep and search for setups based on that direction.
➯ The liquidity sweep condition will be invalidated when price closes back below (for demand sweep) or above (for supply sweep) the most recently swept liquidity level.
⭐ Pending Order Cancellation Conditions
A Pending Order will be canceled under the following conditions:
1.A new Price Action signal appears on either the Buy or Sell side.
2.When Time Session is enabled, the Pending Order is canceled once price exits the selected session.
🕹 Order Management Rule
When there is an active open position, the indicator restricts the creation of new Pending Orders to prevent overlapping positions.
⚠️ Disclaimer
This indicator is designed for educational and research purposes only. It does not guarantee profits and should not be considered financial advice. Trading in financial markets involves significant risk, including the potential loss of capital.
🥂 Community Sharing
If you find parameter settings that work well or produce strong statistical results, feel free to share them with the community so we can improve and develop this indicator together.

StrategyMatrixLibLibrary "StrategyMatrixLib"
render_matrix(posStr, digits, bgCol, headBg, headTxt, valCol, valTxt)
Renders a strategy performance matrix (table) using strategy.* and strategy.closedtrades.*
Parameters:
posStr (string) : Table anchor position: "Top Left" | "Top Right" | "Bottom Left" | "Bottom Right"
digits (int) : Decimal places for numeric formatting
bgCol (color) : Background color for non-header cells
headBg (color) : Background for header rows
headTxt (color) : Text color for header rows
valCol (color) : Background for value cells
valTxt (color) : Text color for value cells
Returns: table id The created/updated table ID

Backtest Pro - The TradingView Backtesting EngineBacktest your indicators — no strategy code required. Backtest Pro is the next-generation backtesting engine for smarter testing. Simply link your signals, set your stops, and start testing.
With its upgraded UI/UX and fundamentally improved stop system, Backtest Pro replaces the legacy PSE (Practical Strategy Engine) and sets a new standard for TradingView backtesting. It delivers more accurate intrabar trailing stops, flexible stop types (Points, ATR Multiplier, %), and a smoother workflow for greater precision and control.
Once loaded on your chart, Backtest Pro appears as BT Pro as the script title and in the Strategy Tester, alerts, and chart labels.
Beyond the core stop and pyramiding logic, Backtest Pro also introduces:
A clearer Data Window for reviewing trade details.
Improved signal labels in the Strategy Tester’s List of Trades for easier log analysis.
Updated chart labels that align better with TradingView’s native style and make signals easy to interpret. Together, these improvements make Backtest Pro the most practical and user-friendly way to backtest indicator-based trading signals in TradingView.
Copyright © 2025 CoinOperator
________________________________________________________________________________
🚀 Why Traders Choose Backtest Pro
Answer in minutes what used to take days of manual testing.
Backtest Pro is a drop-in, ready-to-use backtesting engine that links to your indicator with just a few simple connection lines. It provides more accurate intrabar trailing stops, multiple stop types (Points, ATR Multiplier, %), and a smoother workflow for greater precision and control.
Whether you’re running a quick test or fine-tuning complex strategies, Backtest Pro helps you reach clearer insights faster.
________________________________________________________________________________
👤 Who Backtest Pro Is For
Backtest Pro is designed for traders who already have a trading methodology or entry/exit logic and want professional-grade validation and risk analysis.
Backtest Pro is not a signal service and does not provide discretionary trade recommendations. All entries and exits — including alerts used for automation — are generated solely from user-defined logic.
You bring the logic — Backtest Pro provides the structure, metrics, and discipline.
Backtest Pro helps swing traders, day traders, and strategy developers streamline the backtesting process without sacrificing depth or accuracy. It offers flexible stop management, enhanced Data Window metrics, refined Strategy Tester labeling, and clean on-chart visuals to support consistent evaluation.
Backtest Pro supports trading and backtesting on futures (continuous contracts), forex, crypto, stocks, ETFs, and commodity/index CFDs (tradable if offered by your broker).
________________________________________________________________________________
⚡ Quick Start
Add Backtest Pro to your chart. It appears as BT Pro as the script title and in the Strategy Tester, alerts, and chart labels.
Add a few connector lines to your indicator, then link your custom entry and exit signals.
Adjust position sizing, stops, and pyramiding.
Run the TradingView Strategy Tester for instant results.
________________________________________________________________________________
🔄 From PSE to Backtest Pro
Backtest Pro builds on the foundation of the PSE (Practical Strategy Engine), evolving it into a more refined tool. While PSE introduced flexible stop handling, Backtest Pro enhances the experience with:
More accurate intrabar trailing stops
Expanded stop type options (Points, ATR Multiplier, %)
Upgraded Data Window for easier review
Clearer trade signals in the Strategy Tester
Cleaner, more consistent chart labels
Wash Sale Prevention is Now Optional. If enabled, it only applies to assets of types stock and fund.
🛠 INPUTS TAB SETTING
📅 Trading Window
Enable Trading Window to define the date/time when trading is allowed. Disable to trade the entire market data.
Partition the time when trading is allowed to see if your indicator settings work well across the different ranges. Your resulting metrics should be acceptable across all four (4) ranges: entire range, 1st half, IQR, and 2nd half.
Show Trading Window Lines – Enable to draw vertical lines at the start and end of the trading window for clear visual definition of when trading is allowed.
💰 Position Sizing (Money Management)
Separating the equity risk into initial position and pyramid position allows for greater ability to maximize profits within your acceptable drawdown.
Note : Position sizing is determined on the anticipated fill price which is affected by the maximum of slippage and selected price gap (discussed in the Execution Rules section). Max Equity per Position (%) : This setting applies to each position within a trade group . Limits the position size and will not exceed this amount. Set as desired. Default is 20% for non-leverage trading. For leveraged trading, adjust accordingly. Example: for 3× leverage, enter 300 (3 × 100 = 300).
Max Equity Drawdown Warning (%) : Triggers an alert if the strategy’s equity drawdown exceeds this threshold. Select the method to use for this warning. If BT Pro, then it is based on peak equity at bar-close. If TradingView, then it is based on the built-in variable strategy.max_drawdown_percent. Helps you manage strategy-level risk tolerance.
Scaled Pyramiding : Adjusts position size incrementally for each pyramid entry—either decreasing or increasing exposure relative to the prior entry.
Start Position: The entry number at which scaling begins. For example, 3 means scaling starts on the 2nd pyramid (the 3rd entry overall).
Chg(%): The percentage change applied to each subsequent pyramid entry.
Max(%): The maximum cumulative reduction allowed when scaling downward. Ignored for upward scaling because increases are already capped by Max Equity per Position (%).
⚖️ Execution Rules
Trade Direction : Select either Both , Long Only, or Short Only.
Alert Failed to Trade – Enable to alert you when a trade did not happen due to low equity or low order size. Applicable only for the first position of a trade group.
Cooldown Period : Controls how long the engine waits after an exit before allowing a new trade group. Backtest Pro also applies a small built-in safeguard to prevent unrealistic same-bar flips: ● 1 bar minimum for same-direction entries
● 2 bars minimum for direction changes
Prevent Wash Sales : Enable if you want the Backtest Pro to enforce a minimum cooldown period of 30 days for trade groups that result in a loss. Only applies to assets of types stock and fund.
Pyramid Conditions with Price Gaps : Dwn Gap and Up Gap refer to price gaps. A price gap is the difference between the closing price of the previous candle and the opening price of the current candle, and their value is shown in the Data Window. Selection options include: disabled (the default), median, avg, p80 (for 80th percentile), and p90 (for 90th percentile). The values reflect ~500 most recent bars from the cursor position. Disabled sets the Dwn Gap and Up Gap to zero in the below logic. Pyramids require a tailing stop loss, TSL. The price gaps are used in conditions for pyramids:
To ensure the previous position is protected when opening a pyramid position. A new pyramid position will not open until its trailing stop loss protects the prior position.
To prevent a pyramid position from becoming a loss when too close to a take profit level, TP (if enabled), due to commission cost.
The logic for #1 and #2 is as follows:
For a Long Pyramid: TSL: Stop Price - max(DwnGap, slippage) > LastEntryPrice
TP (if enabled): Long take profit > close + max(UpGap, slippage) AND gain > commission cost
For a Short Pyramid:
TSL: Stop Price + max(UpGap, slippage) < LastEntryPrice
TP (if enabled): Short take profit < close - max(DwnGap, slippage) AND gain > commission cost
Show All Gap Stats in Data Window
Enable to show all price gap statistics in the Data Window to review market conditions.
Disable for the Backtest Pro to run most efficiently.
Note: Statistics selected in Dwn Gap and Up Gap settings are always shown, regardless of this option.
🛑 Exit Strategy (Risk Management)
Backtest Pro supports multiple stop loss styles, giving traders the tools to backtest strategies in TradingView with precision:
The Exit Strategy applies a common protective stop across the entire trade group.
Pyramids require a trailing stop loss. A new pyramid position will not open until its trailing stop loss protects the prior position.
Plot Stop Level : You can plot the stop level either as of bar close (the default) or as of bar open. This only affects the visual plot. The underlying logic does not change. The trades will be the same regardless of the setting.
ATR Length : The ATR Length is used with the ATR multiplier and is common to stop loss, SL, trailing stop loss, TSL, take profit, TP, and the time-based exit option. It is the number of bars (periods) used in ATR calculation.
Price-Based Exits Stop Loss and Trailing Stop Loss options are Points, ATR Multiplier, and %.
The Trailing Stop Loss is activated from entry of the initial position of a trade group.
Take Profit options are Points, ATR Multiplier, %, and R-Multiple. How Trailing Stops Work in the Backtest Pro All trailing stop inputs (Points, ATR Multiplier, or %) are converted at the first entry into a fixed currency offset.
That offset is reactive intrabar and applied as the trailing distance from the most favorable price (highest for longs, lowest for shorts) since the first entry in the trade group.
Even if “%” is selected as the input method, the engine uses the fixed currency offset.
The trailing stop offset (points) is displayed in the Data Window for reference, allowing you to enter that offset directly at your broker if needed.
⚠️ Caution: Always enter a points-based trailing stop at your broker—never a percentage-based trailing stop. Volatility-Based Exit While in a trade, ATR values are accumulated each bar. The position exits once the total exceeds ATR Multiplier × ATR at entry if the Reward/Risk is below the set threshold.
Dividends are not included in reward (i.e., profit).
👉 These flexible stop types solve one of the biggest limitations of the legacy PSE and make Backtest Pro a true TradingView backtesting engine.
📑 Trade Signal Labels in Strategy Tester
Backtest Pro uses standardized trade labels in the Strategy Tester → List of Trades. These labels make it easy to understand the reason behind each entry or exit at a glance. Entry : Standard entry signal when conditions are met.
Stop : Stop-loss exit triggered at your defined stop level.
Pyr-Entry : Pyramid entry, adds to an existing position.
Trail-Stop : Trailing stop exit based on offset logic. Note : If the stop level has been adjusted to equal the trailing stop level, the Strategy Tester may display Stop instead of Trail-Stop. The exit displayed is the one Pine Script evaluates first, but the actual exit behavior remains correct.
Exit : Standard exit signal.
Delay-Exit : One-bar delayed exit, prevents immediate exit when position entry and exit signal occur on the same bar.
TP : Take Profit exit, closes position at your profit target.
RR-Exit : Reward/Risk exit — position closes when ATR accumulation exceeds the set threshold and R/R is below target.
📊 Performance Metrics & Reporting
Include Dividends in Profit
Adjusts ROI, CAGR, Reward/Risk, Avg Invest/Trade-Grp, and Equity.
Assumes dividends are taken as cash (not reinvested). They are applied to Equity on the ex-date instead of the payment date.
Only applies if the security issues dividends and the chart is 1D or lower timeframe; otherwise ignored.
Include Dividends in Profit Factor
Applies only when Include Dividends in Profit is enabled.
Adds dividend income to both gross profits and gross losses when calculating Profit Factor, so PF reflects total return (trading + dividends).
Affects Avg Trade-Grp Loss, Equity Loss from ECL, and Equity Loss from ECL (%).
Show Dividends
Displays the payout in currency/share, as well as the total amount based on the number of shares of the position(s) currently held by the trade group. For long positions you earned the dividends. For short positions you owe the dividends.
Show Metrics Table
The on-chart Metrics Table displays a compact set of key statistics for quick reference and mobile use. Full and expanded metrics are available in the Data Window on desktop or browser. Section groupings may differ between the table and Data Window to optimize readability and presentation in each context.
📊 Data Window
Note : Accessible via a button on the right-hand toolbar of the chart interface. Unlike the Metrics Table, Data Window values update dynamically as you move your cursor across bars. All metrics are based on trade groups.
Trade Information
Enter Price
Stop Price
Favorable Extreme : only shows if trailing stop loss is enabled on Inputs tab. The most favorable price (highest for longs, lowest for shorts) since the first entry in the trade group.
TSL Offset Points : only shows if trailing stop loss is enabled on Inputs tab.
Take Profit : only shows if take profit is enabled on Inputs tab.
Leverage information applies to trade groups.
Fail Pos / Margin (%) : Shows zero if the failed position size was <1, or the margin % that failed to meet the requirement in the Properties tab. A flag appears above the bar where a failed trade occurred. Only applies to the first position of a trade group. Hover over the flag to view the value in the Data Window.
Notional Value : total trade group position size x latest entry price x point value. The equity must be > notional value x margin requirement for a trade to occur.
Current Margin (%) : must be greater than margin requirement set on the Properties tab in order for a trade to occur.
Margin Call Price : when enabled on the Style tab is displayed on both the chart and the Data Window as shown below.
Performance Net Profit (%) : Will include dividends if 'Include Dividends in Profit' is enabled. Only shows in Data Window if 'Include Dividends in Profit' is enabled.
ROI (%) and CAGR (%) : Based on Avg Invest/Trade-Grp. Adjusted for dividends if enabled.
Reward/Risk (profit/risked, expectancy per amount risked): Adjusted for dividends if enabled. Color is green if above breakeven, red if below, and yellow if within ±0.1 tolerance.
Profit Factor (PF) : By default, dividends are not counted in win/loss classification.
Win % : Uses same coloring scheme as Reward/Risk except uses a ±2% tolerance for yellow. Breakeven point is the balance between Reward/Risk and Win %, showing whether the system can be profitable. For example, for a low Win % a high Reward/Risk is needed for the system to be potentially profitable. Equity & Growth
Equity : Your current equity.
Dividend Sum : The amount of total dividends accumulated since entering the market. Only shows in Data Window if 'Include Dividends in Profit' is enabled. Risk & Drawdown
Maximum Drawdown (MDD)
Measures the largest peak-to-trough decline in account equity over the entire backtest.
A new peak is recorded whenever equity reaches a new high; the system then tracks the lowest equity seen until a new peak forms.
This method uses bar-close equity including both realized and unrealized P&L. Therfore, it may not match TradingView’s displayed drawdown values which use a different method.
Maximum Drawdown %
Expresses MDD as a percentage of the equity peak from which the decline occurred.
This normalizes drawdown across different account sizes and assets, making strategy-to-strategy risk comparisons more meaningful.
Maximum Consecutive Losses applies to trade groups.
Equivalent Consecutive Losses (ECL) : Based on Win % and Nbr of Trade-Grp’s.
Simulates a realistic losing streak with intermittent small wins.
Lowered by increasing Win %.
Equity Loss from ECL : Equity drawdown estimated from ECL.
Equity Loss from ECL (%) : Same, expressed as a percentage.
Avg Trade-Grp Loss Trade Structure
Backtesting Years : The trading window in years.
Nbr of Trade-Grp’s : Count of trade groups.
Nbr of Positions : The count of positions shown on the chart.
The TV list of trades in the Strategy Tester may indicate more than what is actually shown on the chart.
Avg Invest/Trade-Grp : Avg money invested per trade group. Adjusted for dividends if enabled.
Avg Trade-Grp Days : The average number of days for trade groups.
Time in Market (%) : The percentage of time in a trade based on the trading window.
Cnt 1st EE Same-Bar is the count of first positions in a trade group that enter and exit on the same bar. Labels appear above for easy reference. Helps assess optimal stop-loss settings.
Cnt Pyr EE Same-Bar is the count of pyramid positions in a trade group that enter and exit on the same bar. Labels appear above for easy reference. Helps assess optimal stop-loss settings. Up Gaps / Dwn Gap (Ticks) ( Show All Gap Stats in Data Window enabled )
Median gap
Avg gap
80 percentile
90 percentile
Price Gap (Ticks) ( Show All Gap Stats in Data Window disabled )
Dwn Gap : Shows selected option if not disabled.
Up Gap : Shows selected option if not disabled.
Data Quality
Tick Resolution measures how many minimum price increments (ticks) fit into the current asset’s price. It is calculated as: Tick Resolution = Price / Minimum Tick Size. This value indicates the precision available for order placement and stop calculations.
Green – High resolution (>= 1000). The strategy’s stop and profit calculations will operate with normal accuracy.
Yellow – Moderate resolution (100-999). Stop levels are still functional but may exhibit minor rounding effects.
Red – Low resolution (< 100). This can distort trailing stops, stop losses, or take profits due to coarse rounding by TradingView’s broker emulator.
⚠️ Caution : When Tick Resolution is in the red zone, results from backtests may differ significantly from live trading because price precision is too low for reliable simulation.
💡 Tip : If low tick resolution is present at the beginning of the chart’s market data (often with very old price history), use the Trading Window to restrict backtesting to later periods where the asset price has risen and tick resolution is higher.
👁 Visualization
Highlight Traded Background
Trade groups are shown in background color of green for long positions and red for short positions. Set as desired.
Show Losing Trade Groups
Losing trade groups are indicated at the exit with label text in the color blue. Used to easily find consecutive losses affecting your strategy’s performance. The dividend payment, if any, is not considered in the calculation of a win or loss.
Show Position Values
Enable to show the currency value of each position in gold color.
Show Max Drawdown (Peak & Trough) Enable to show the peak and trough labels on the price chart. Based on equity at bar close. Use to easily identify the bar associated with the peak and trough of equity.
Select label size for your preference.
Alert on Expiring GTC Orders
Backtest Pro includes an optional alert that warns you when a Good-Til-Canceled (GTC) order is approaching expiration. This feature is designed as a safety net, helping you avoid unprotected trades caused by broker-imposed GTC expirations. This alert is sent a few days before a 60-day time period you’re if still in an open position.
By default, the alert is enabled, offering protection for traders who may not actively monitor order expiry rules.
Professional users who already track expirations can disable the feature in the settings to streamline alerts.
🔌 Signal Connection
Click the dropdown and select the entry and exit signal to establish a connection to your indicator.
Separate Entry and Exit Signal Connections.
Backtest Pro requires separate entry and exit signals. Indicators that already produce distinct events integrate cleanly and make strategies easier to read, debug, and maintain.
If your indicator currently uses a combined signal (e.g., buy = 1, sell = –1, flat = 0), that structure can create overlap or conflicts during backtesting.
Don’t worry — later in this manual, you’ll learn exactly how to adapt your indicator so it outputs clear entry and exit signals compatible with Backtest Pro.
🔌 Configure Your Indicator for Entry and Exit Signals
This section explains how to structure your indicator’s entry and exit signals so they can connect seamlessly with the Backtest Pro engine.
Define your own conditions for when to enter or exit positions using any technical logic you prefer. You can configure exits independently of entries or make them dependent on them—for example, exiting only when the opposite entry condition occurs.
Below are a few examples of how you might define Long and Short Entry Signals before connecting them to Backtest Pro.
________________________________________________________________________________
Examples of Long Entry Signals
ind_sig_long = oscillator > UpperLimit
ind_sig_long = ta.crossover(ta.sma(close, 14), ta.sma(close, 28))
ind_sig_long = MACD_hist > 0 Examples of Short Entry Signals
ind_sig_short = oscillator < LowerLimit
ind_sig_short = ta.crossunder(ta.sma(close, 14), ta.sma(close, 28))
ind_sig_short = MACD_hist < 0 ________________________________________________________________________________
Combining and Refining Your Signals
If your indicator uses multiple internal conditions, you can combine them using logical operators or threshold rules before connecting to the Backtest Pro engine.
1. Combine multiple conditions
Use logical and / or to merge your conditions into one signal:
Entry_Long = ind_sig_long1 and ind_sig_long2 // both must be true
Entry_Short = ind_sig_short1 or ind_sig_short2 // either may be true ________________________________________________________________________________
2. Require a minimum number of confirming conditions
You can also define a threshold for how many entry conditions must be true before triggering a signal. This can help ensure stronger confirmation.
minNbr_Entries = input.int(defval=1, title='Min Number of Entry Conditions')
// Convert boolean signals to numeric form
longCount = (ind_sig_long1 ? 1 : 0) + (ind_sig_long2 ? 1 : 0)
shortCount = (ind_sig_short1 ? 1 : 0) + (ind_sig_short2 ? 1 : 0)
// Require at least minNbr_Entries to confirm signal
Entry_Long = longCount >= minNbr_Entries
Entry_Short = shortCount >= minNbr_Entries
Do likewise for your Exit conditions to ensure consistency in trade confirmation.
________________________________________________________________________________
Defining Exits
Independent of Entries
Exit_Long = ta.crossunder(ta.rsi(close, 14), 70)
Exit_Short = ta.crossover(ta.rsi(close, 14), 30) Dependent on Entries
Exit_Long = Entry_Short // exit longs when short entry triggers
Exit_Short = Entry_Long // exit shorts when long entry triggers ________________________________________________________________________________
Final Signals to Connect to Backtest Pro
entry_signal = Entry_Long ? 1 : Entry_Short ? -1 : 0
exit_signal = Exit_Long ? 1 : Exit_Short ? -1 : 0
plot(entry_signal, title="entry_signal", color = color.blue, display=display.data_window)
plot(exit_signal, title="exit_signal", color = color.red, display=display.data_window) ________________________________________________________________________________
Notes
You can easily expand this structure to handle three or more conditions by adding them to the count expression.
If your indicator already provides a single entry_signal, you can connect it directly to Backtest Pro without modification.
Always ensure your final Entry_Long, Entry_Short, Exit_Long, and Exit_Short variables are boolean (true / false).
🔒 Connecting Closed-Source Indicators
If your indicator is closed-source (meaning you cannot view or modify its internal code), you’ll need to work with the plotted values it provides.
Create a connection indicator that reads those plotted values and converts them into clear entry and exit signals using the logic described above.
This connection indicator acts as a bridge between the closed-source indicator and Backtest Pro, allowing you to translate its behavior into standardized signal logic that the engine can process.
⚙️ PROPERTIES TAB SETTING
Initial Capital : Set as desired.
Base Currency : Leave as Default. The Backtest Pro is designed to use the instrument’s native currency, so changing this is not necessary.
Order Size : Essentially disabled. Position sizing is handled in the Inputs tab and is based on a percentage of equity.
Pyramiding : Set as desired.
Commission : Enter as a percentage of position value. The Backtest Pro is designed to work only with commission expressed this way.
Verify Price for Limit Orders : Set as desired.
Slippage : Set as desired. See the Dwn/Up Gap values in Data Window to get an idea of possible values to use.
Margin (Leverage Trading):
The Backtest Pro supports both leveraged and non-leveraged trading (default is no leverage).
Note : The following two settings apply at the trade group level . For example, to trade with 5× leverage, enter 20 (1 ÷ 5 × 100 = 20).
Margin for Long Positions : Set as desired. Default is 100%.
Margin for Short Positions : Set as desired. Default is 100%.
Recalculate After Order Is Filled (default is enabled)
Enabling this allows the Backtest Pro to function correctly and to recalculate immediately after an order is filled , which makes it possible to:
Enter and exit on the same bar (because the strategy sees the fill instantly).
Trigger alerts immediately after the fill , instead of waiting for the next bar close.
You may see the following Caution! message in the TradingView Strategy Tester:
This warning occurs because the strategy parameter calc_on_order_fills = true . You can safely close the caution message and know the Backtest Pro will produce realistic backtest results.
Recalculate On every tick : Disable.
Fill Orders
Using Bar Magnifier : Recommended if your TradingView plan supports it. Improves intrabar accuracy, but the strategy can still run without it.
On Bar Close : Must remain disabled. Enabling this prevents the Backtest Pro from working as intended.
⚠️ Caution : Enabling On Bar Close forces all orders to be evaluated only at bar close. This disables intrabar logic, prevents same-bar entries and exits, and breaks trailing stop / pyramid behavior. For the Backtest Pro to work as intended, On Bar Close must remain disabled .
Using Standard OHLC : Recommended if running the strategy on Heikin Ashi charts. Otherwise, set as desired. The default is enabled.
📢 Using The Alert Dialog Box Message Field
When setting alerts, include alert() function calls with order fills to allow notifications for drawdown exceeded, Failed to Trade (if enabled), and to be warned of expiring GTC orders (if enabled).
Example Message for Order Fill Alerts
(This is just an example. Consult TV manual for possible placeholders to use.)
Position: Current = {{strategy.market_position}}, Previous = {{strategy.prev_market_position}}
{{strategy.order.action}} {{strategy.order.contracts}} shares at price = {{strategy.order.price}} on {{exchange}}:{{ticker}} (TF: {{interval}})
Equity_Multiplier = {{strategy.order.contracts}} x {{strategy.order.price}} ÷ {{plot("Equity")}}
{{strategy.order.alert_message}}
Note :
Use a known account equity multiplied by Equity_Multiplier to determine the total currency amount required for position sizing—especially when managing multiple accounts with different equity levels.
What {{strategy.order.alert_message}} Includes
This placeholder automatically inserts the additional information generated for each order fill alert (blank for exits):
Stop Price (on first entries is based on bar close prior to order fill bar)
TSL Offset (Pts) distance from Favorable Extreme (for pyramid entries)
TP (on first entries is based on bar close prior to order fill bar)
Price Gap (Pts) based on your gap selection and slippage entered
Example Message for Bot Trading Alerts
(You must consult your specific bot for configuring the alert message. This is just an example.)
"action": "{{strategy.order.action}}",
“price”: {{strategy.order.price}}
"amount": {{strategy.order.contracts}},
"botId": "1234"

Momentum Quality Index Strategyfiles.fm
Welcome to the Momentum Quality Index Strategy!
This is a fairly conservative strategy with a sharp criteria for entries and taking profits. This strategy has been tested amongst the top 50 stocks with volatility over 2%, and the verdict was that the profitability was often times over 85% profitability, often times reaching over 90% profitability. This strategy thrives in more volatile environments, often times beating the buying and holding strategy YTD performance by large margins.
This strategy is highly optimized for the 30 minute chart, giving insights into shorter term movements. It is based on cash trades of $1,000 per position, with a maximum of 4 trades being placed at once.
This strategy is optimized for common stock trading in more liquid markets, and not yet optimized for options trading (however I plan on developing highly profitable strategies for this purpose soon). The take profit is customizable.
I would refer to the image link I have posted at the top of this article for the strategy's effectiveness. The strategy report on this article isn't accurate, as this strategy is based on trading $1,000 per trade, therefore over longer term periods of time will not be as successful due to the fact that there is no compounding. However, over the course of smaller time frames (such as one year), it beats buying and holding of many assets.
This strategy is meant for day trading and short term swing trading, and is not meant to beat buying and holding of successful assets over the course of long periods of time.

Syntropy - System v4Syntropy System v4 – La Estrategia de Acumulación Profesional que Todos Están UsandoEDICIÓN LIMITADA – SOLO 10 PLAZAS DISPONIBLES EN TODO EL MUNDOPor primera (y única) vez, libero mi estrategia privada más potente:
La misma que uso personalmente y que ha cambiado por completo la forma en que acumulo en Bitcoin, Ethereum y altcoins de alto potencial.¿Qué incluye Syntropy v4?8 motores de entrada independientes (PG Solo, PG+FA, RZ1/RZ2, SFP, Liquidity Sweep, STE Bottom + reentradas inteligentes)
Piramidación hasta 20 niveles con control total de riesgo
Medias móviles dinámicas + proyecciones extendidas
Tabla en tiempo real con P&L total, capital invertido y operaciones abiertas/cerradas
Señales 100% visuales y sin repintado
Optimizada para cripto, pero funciona perfecto en forex y acciones
OFERTA EXCLUSIVA Y POR TIEMPO MUY LIMITADOPrecio normal: 499 USD (pago único de por vida + todas las futuras actualizaciones) PRECIO LANZAMIENTO SOLO PARA LOS PRIMEROS 10 COMPRADORES:
50 USD DE POR VIDA
(Sí, leíste bien: cincuenta dólares una sola vez y el indicador es tuyo para siempre)Una vez que se vendan las 10 primeras licencias, este precio desaparece para siempre y vuelve al valor real de 499 USD.Ya van 7/10 vendidas en las últimas horas…¿Quieres ser uno de los últimos 3 que se lleven Syntropy v4 a precio de lanzamiento?Envíame YA un mensaje privado con la palabra “SYNTROPY 50” y te mando el enlace de pago + acceso inmediato al script protegido.No hay prueba gratis esta vez porque a este precio es literalmente un regalo… pero sí te doy mi palabra: si en 30 días no estás 100% convencido de que es la mejor estrategia que has usado jamás, te devuelvo hasta el último centavo.Quedan muy pocas horas antes de que suba el precio para siempre.Los primeros 10 que escriban ahora se llevan el indicador de por vida por solo 50 USD.
El resto pagará 10 veces más.Tú decides si estás dentro del grupo élite o te quedas mirando desde afuera.Te espero del otro lado.Aviso importante (reglas de TradingView):
Este es un script privado de pago. No constituye asesoramiento financiero. Operar implica riesgo de pérdida de capital. Los resultados pasados no garantizan resultados futuros. Uso bajo tu propia responsabilidad.
Syntropy System v4 – The Most Powerful Accumulation Strategy Ever ReleasedWORLDWIDE LIMITED EDITION – ONLY 10 LIFETIME SEATSFor the first and last time ever, I’m opening my personal, private strategy that I use every single day to stack Bitcoin, Ethereum, Ethereum and high-conviction altcoins.What you get with Syntropy v48 independent & complementary entry engines (PG Solo, PG+FA, RZ1/RZ2, SFP, Liquidity Sweep, STE Bottom + smart reentries)
Up to 20 pyramiding levels with perfect risk scaling
Dynamic moving averages + extended visual projections
Real-time dashboard (total P&L, invested capital, open/closed trades)
100% visual, non-repainting signals
Built for crypto, but works flawlessly on forex and stocks too
INSANE LAUNCH PRICE – ONLY FOR THE FIRST 10 PEOPLENormal lifetime price: $499 (one-time payment + all future updates forever)LAUNCH PRICE – FIRST 10 BUYERS ONLY:
$50 USD LIFETIME
(Yes, you read that right: fifty dollars one time and the indicator is yours forever)Once these 10 licenses are gone, the price jumps permanently to $499 and will never come back down.7 out of 10 already sold in the last few hours…That leaves only 3 seats at this ridiculous price.Want to be one of the last 3 people on Earth to grab Syntropy v4 for $50 lifetime?Send me a private message RIGHT NOW with the words
“SYNTROPY 50”
and I’ll instantly send you the payment link + immediate access to the protected script.There is no free trial at this price (it would be insane), but I give you my personal word:
If within 30 days you’re not 100% blown away and convinced this is the best strategy you’ve ever used, I’ll refund every single penny — no questions asked.The clock is ticking. In a few hours this $50 offer disappears forever.The first 10 who message me now get lifetime access for only $50.
Everyone else will pay 10× more.Your move: be part of the elite 10 or watch from the sidelines.I’ll see you inside.TradingView Required Disclaimer
This is a paid private script. Not financial advice. Trading involves substantial risk of loss. Past performance is no guarantee of future results. Use only capital you can afford to lose. You are solely responsible for your trading decisions.

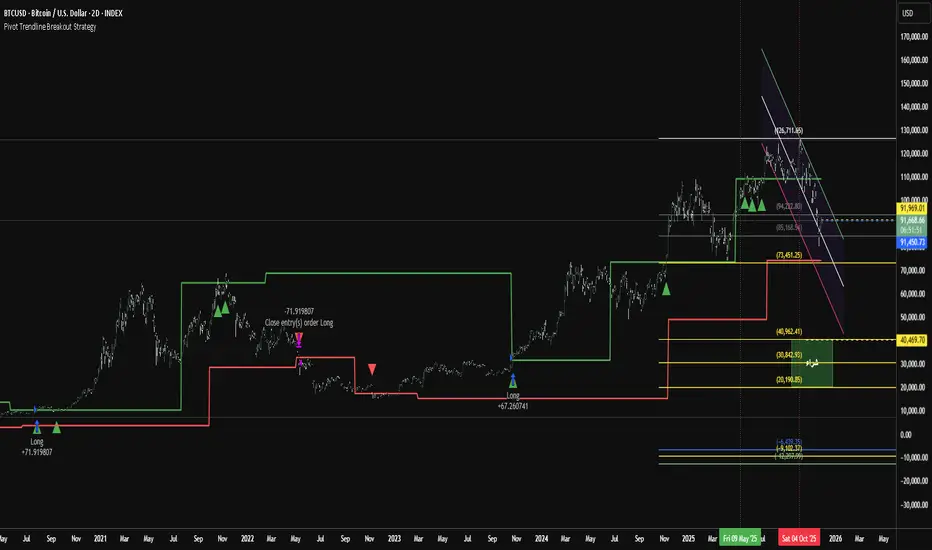
Pivot Trendline Breakout StrategyHow it works:
Long entry: triggered immediately when price closes above the green upper pivot trendline.
Exit (go flat): triggered immediately when price closes below the red lower pivot trendline.
Uses 100% of equity per trade (you can change default_qty_value if you prefer fixed size or risk %).
Works on any timeframe.
ParabolicSAR+EMA[TS_Indie]🚀 EMA + Parabolic SAR Reversal Trading Strategy
This trading system effectively combines the use of Exponential Moving Averages (EMA) with the Parabolic SAR to identify both price trends and key reversal points. The EMA Fast is used to signal the primary short-term trend, while the EMA Slow acts as a filter for the long-term trend direction. The Parabolic SAR then helps to confirm the reversal signals.
🛠️ Tools Used
1. EMA Fast – Primary Short-Term Trend
2. EMA Slow – Long-Term Trend Filter
3. Parabolic SAR – Reversal Confirmation
🎯 Entry Rules
📈 Buy Setup
1. Trend Filter: EMA Fast > EMA Slow → Uptrend
2. Pullback: Price pulls back and closes below the EMA Fast line.
3. Reversal: Price reverses/pulls back up and closes above the EMA Fast line.
4. SAR Confirmation: The previous Parabolic SAR dot is above the high, and the dot in the current candle is below the low → Reversal signal confirmed.
5. Entry: Enter Buy immediately.
📉 Sell Setup
1. Trend Filter: EMA Fast < EMA Slow → Downtrend
2. Pullback: Price pulls back and closes above the EMA Fast line.
3. Reversal: Price reverses/pulls back down and closes below the EMA Fast line.
4. SAR Confirmation: The previous Parabolic SAR dot is below the low, and the dot in the current candle is above the high → Reversal signal confirmed.
5. Entry: Enter Sell immediately.
💰 Exit Management (Entry, Stop Loss, Take Profit)
1. Entry: Enter the order at the closing price of the signal candle.
2. Stop Loss (SL): Set the Stop Loss at the Parabolic SAR dot.
3. Take Profit (TP): Calculated from the Entry and Stop Loss points, multiplied by the Risk Reward Ratio.
⚙️ Optional Parameters
➭ Custom Risk/Reward Ratio for Take Profit.
➭ Option to add an ATR buffer to the Stop Loss.
➭ Adjustable EMA Fast period.
➭ Adjustable EMA Slow period.
➭ Adjustable Parabolic SAR parameters.
➭ Option to enable Long-only / Short-only positions.
➭ Customizable Backtest start and end date.
➭ Customizable trading session time.
🔔 Alert Function
Alerts display:
➭ Entry Price
➭ Stop Loss Price
➭ Take Profit Price
💡 This strategy allows for many parameter adjustments, such as the MA type, adding/subtracting from the Stop Loss using ATR, and selecting specific sessions for backtesting. If you find interesting or profitable results after adjusting the parameters, please share your comments with other traders!
⚠️ Disclaimer
This indicator is designed for educational and research purposes only. It does not guarantee profits and should not be considered financial advice. Trading in financial markets involves significant risk , including the potential loss of capital.

Quasimodo Pattern Strategy Back Test [TradingFinder] QM Trading🔵 Introduction
The QM pattern, also known as the Quasimodo pattern, is one of the popular patterns in price action, and it is often used by technical analysts. The QM pattern is used to identify trend reversals and provides a very good risk-to-reward ratio. One of the advantages of the QM pattern is its high frequency and visibility in charts.
Additionally, due to its strength, it is highly profitable, and as mentioned, its risk-to-reward ratio is very good. The QM pattern is highly popular among traders in supply and demand, and traders also use this pattern.
The Price Action QM pattern, like other Price Action patterns, has two types: Bullish QM and Bearish QM patterns. To identify this pattern, you need to be familiar with its types to recognize it.
🔵 Identifying the QM Pattern
🟣 Bullish QM
In the bullish QM pattern, as you can see in the image below, an LL and HH are formed. As you can see, the neckline is marked as a dashed line. When the price reaches this range, it will start its upward movement.
🟣 Bearish QM
The Price Action QM pattern also has a bearish pattern. As you can see in the image below, initially, an HH and LL are formed. The neckline in this image is the dashed line, and when the LL is formed, the price reaches this neckline. However, it cannot pass it, and the downward trend resumes.
🔵 How to Use
The Quasimodo pattern is one of the clearest structures used to identify market reversals. It is built around the concept of a structural break followed by a pullback into an area of trapped liquidity. Instead of relying on lagging indicators, this pattern focuses purely on price action and how the market reacts after exhausting one side of liquidity. When understood correctly, it provides traders with precise entry points at the transition between trend phases.
🟣 Bullish Quasimodo
A bullish Quasimodo forms after a clear downtrend when sellers start losing control. The market continues to make lower lows until a sudden higher high appears, signaling that buyers are entering with strength. Price then pulls back to retest the previous low, creating what is known as the Quasimodo low.
This area often becomes the final trap for sellers before the market shifts upward. A visible rejection or displacement from this zone confirms bullish momentum. Traders usually place entries near this level, stops below the low, and targets at previous highs or the next resistance zone. Combining the setup with demand zones or Fair Value Gaps increases its accuracy.
🟣 Bearish Quasimodo
A bearish Quasimodo forms near the top of an uptrend when buyers begin to lose strength. The market continues to make higher highs until a sudden lower low breaks the bullish structure, showing that selling pressure is entering the market. Price then retraces upward to retest the previous high, forming the Quasimodo high, where breakout buyers are often trapped.
Once rejection appears at this level, it indicates a likely reversal. Traders can enter short near this area, with stop-losses placed above the high and targets near the next support or previous lows. The setup gains more reliability when aligned with supply zones, SMT divergence, or bearish Fair Value Gaps.
🔵 Setting
Pivot Period : You can use this parameter to use your desired period to identify the QM pattern. By default, this parameter is set to the number 5.
Take Profit Mode : You can choose your desired Take Profit in three ways. Based on the logic of the QM strategy, you can select two Take Profit levels, TP1 and TP2. You can also choose your take profit based on the Reward to Risk ratio. You must enter your desired R/R in the Reward to Risk Ratio parameter.
Stop Loss Refine : The loss limit of the QM strategy is based on its logic on the Head pattern. You can refine it using the ATR Refine option to prevent Stop Hunt. You can enter your desired coefficient in the Stop Loss ATR Adjustment Coefficient parameter.
Reward to Risk Ratio : If you set Take Profit Mode to R/R, you must enter your desired R/R here. For example, if your loss limit is 10 pips and you set R/R to 2, your take profit will be reached when the price is 20 pips away from your entry point.
Stop Loss ATR Adjustment Coefficient : If you set Stop Loss Refine to ATR Refine, you must adjust your loss limit coefficient here. For example, if your buy position's loss limit is at the price of 1000, and your ATR is 10, if you set Stop Loss ATR Adjustment Coefficient to 2, your loss limit will be at the price of 980.
Entry Level Validity : Determines how long the Entry level remains valid. The higher the level, the longer the entry level will remain valid. By default it is 2 and it can be set between 2 and 15.
🔵 Results
The following examples show the backtest results of the Quasimodo (QM) strategy in action. Each image is based on specific settings for the symbol, timeframe, and input parameters, illustrating how the QM logic can generate signals under different market conditions. The detailed configuration for each backtest is also displayed on the image.
⚠ Important Note : Even with identical settings and the same symbol, results may vary slightly across different brokers due to data feed variations and pricing differences.
Default Properties of Backtests :
OANDA:XAUUSD | TimeFrame: 5min | Duration: 1 Year :
BINANCE:BTCUSD | TimeFrame: 5min | Duration: 1 Year :
CAPITALCOM:US30 | TimeFrame: 5min | Duration: 1 Year :
NASDAQ:QQQ | TimeFrame: 5min | Duration: 5 Year :
OANDA:EURUSD | TimeFrame: 5min | Duration: 5 Year :
PEPPERSTONE:US500 | TimeFrame: 5min | Duration: 5 Year :

W%R Pullback+EMA Trend [TS_Indie]🔰 Core Concept of the Strategy
The main idea is “Trend-Following with Momentum Pullback.”
This means trading in the direction of the main trend (defined by EMA) while using Williams %R to identify pullback entries (buying the dip or selling the rally) where momentum returns to the trend direction.
📊 Indicators Used
1. EMA Fast – Defines the short-term trend.
2. EMA Slow – Defines the long-term trend (used as a trend filter).
3. Williams %R
• Overbought zone: above -20
• Oversold zone: below -80
⚙️ Entry Rules
🔹 Buy Setup
1. EMA Fast > EMA Slow → Uptrend condition.
2. Williams %R on the previous candle dropped below -80, and on the current candle, it crosses back above -80 → indicates momentum returning to the upside.
3. Current close is above EMA Fast.
4. Entry Buy at the close of the candle where %R crosses above -80.
🎯 Entry, Stop Loss, and Take Profit
1. Entry : At the candle close where the signal occurs.
2. Stop Loss : At the lowest low between the current and previous candles.
3. Take Profit : Calculated based on entry price and stop loss distance multiplied by the Risk/Reward Ratio.
🔹 Sell Setup
1. EMA Fast < EMA Slow → Downtrend condition.
2. Williams %R on the previous candle went above -20, and on the current candle, it crosses back below -20 → indicates renewed selling momentum.
3. Current price is below EMA Fast.
4. Entry Sell at the close of the candle where %R crosses below -20.
🎯 Entry, Stop Loss, and Take Profit
1. Entry : At the candle close where the signal occurs.
2. Stop Loss : At the highest high between the current and previous candles.
3. Take Profit : Calculated based on entry price and stop loss distance multiplied by the Risk/Reward Ratio.
⚙️ Optional Parameters
• Custom Risk/Reward Ratio for Take Profit.
• Option to add ATR buffer to Stop Loss.
• Adjustable EMA Fast period.
• Adjustable EMA Slow period.
• Adjustable Williams %R period.
• Option to enable Long only / Short only positions.
• Customizable Backtest start and end date.
• Customizable trading session time.
⏰ Alert Function
Alerts display:
• Entry price
• Stop Loss price
• Take Profit price
Guys, try adjusting the parameters yourselves!
I’ve been tweaking the settings for several days and managed to get great results on XAU/USD in the 5-minute timeframe.
I think this strategy is quite interesting and could potentially deliver good results on other instruments as well.
⚠️ Disclaimer
This indicator is designed for educational and research purposes only.
It does not guarantee profits and should not be considered financial advice.
Trading in financial markets involves significant risk, including the potential loss of capital.

Portfolio Strategy TesterThe Portfolio Strategy Tester is an institutional-grade backtesting framework that evaluates the performance of trend-following strategies on multi-asset portfolios. It enables users to construct custom portfolios of up to 30 assets and apply moving average crossover strategies across individual holdings. The model features a clear, color-coded table that provides a side-by-side comparison between the buy-and-hold portfolio and the portfolio using the risk management strategy, offering a comprehensive assessment of both approaches relative to the benchmark.
Portfolios are constructed by entering each ticker symbol in the menu, assigning its respective weight, and reviewing the total sum of individual weights displayed at the top left of the table. For strategy selection, users can choose between Exponential Moving Average (EMA), Simple Moving Average (SMA), Wilder’s Moving Average (RMA), Weighted Moving Average (WMA), Moving Average Convergence Divergence (MACD), and Volume-Weighted Moving Average (VWMA). Moving average lengths are defined in the menu and apply only to strategy-enabled assets.
To accurately replicate real-world portfolio conditions, users can choose between daily, weekly, monthly, or quarterly rebalancing frequencies and decide whether cash is held or redistributed. Daily rebalancing maintains constant portfolio weights, while longer intervals allow natural drift. When cash positions are not allowed, capital from bearish assets is automatically redistributed proportionally among bullish assets, ensuring the portfolio remains fully invested at all times. The table displays a comprehensive set of widely used institutional-grade performance metrics:
CAGR = Compounded annual growth rate of returns.
Volatility = Annualized standard deviation of returns.
Sharpe = CAGR per unit of annualized standard deviation.
Sortino = CAGR per unit of annualized downside deviation.
Calmar = CAGR relative to maximum drawdown.
Max DD = Largest peak-to-trough decline in value.
Beta (β) = Sensitivity of returns relative to benchmark returns.
Alpha (α) = Excess annualized risk-adjusted returns relative to benchmark.
Upside = Ratio of average return to benchmark return on up days.
Downside = Ratio of average return to benchmark return on down days.
Tracking = Annualized standard deviation of returns versus benchmark.
Turnover = Average sum of absolute changes in weights per year.
Cumulative returns are displayed on each label as the total percentage gain from the selected start date, with green indicating positive returns and red indicating negative returns. In the table, baseline metrics serve as the benchmark reference and are always gray. For portfolio metrics, green indicates outperformance relative to the baseline, while red indicates underperformance relative to the baseline. For strategy metrics, green indicates outperformance relative to both the baseline and the portfolio, red indicates underperformance relative to both, and gray indicates underperformance relative to either the baseline or portfolio. Metrics such as Volatility, Tracking Error, and Turnover ratio are always displayed in gray as they serve as descriptive measures.
In summary, the Portfolio Strategy Tester is a comprehensive backtesting tool designed to help investors evaluate different trend-following strategies on custom portfolios. It enables real-world simulation of both active and passive investment approaches and provides a full set of standard institutional-grade performance metrics to support data-driven comparisons. While results are based on historical performance, the model serves as a powerful portfolio management and research framework for developing, validating, and refining systematic investment strategies.

Universal Regime Alpha Thermocline StrategyCurrents settings adapted for BTCUSD Daily timeframe
This description is written to comply with TradingView House Rules and Script Publishing Rules. It is self contained, in English first, free of advertising, and explains originality, method, use, defaults, and limitations. No external links are included. Nothing here is investment advice.
0. Publication mode and rationale
This script is published as Protected . Anyone can add and test it from the Public Library, yet the source code is not visible.
Why Protected
The engine combines three independent lenses into one regime score and then uses an adaptive centering layer and a thermo risk unit that share a common AAR measure. The exact mapping and interactions are the result of original research and extensive validation. Keeping the implementation protected preserves that work and avoids low effort clones that would fragment feedback and confuse users.
Protection supports a single maintained build for users. It reduces accidental misuse of internal functions outside their intended context which might lead to misleading results.
1. What the strategy does in one paragraph
Universal Regime Alpha Thermocline builds a single number between zero and one that answers a practical question for any market and timeframe. How aligned is current price action with a persistent directional regime right now. To answer this the script fuses three views of the tape. Directional entropy of up versus down closes to measure unanimity.
Convexity drift that rewards true geometric compounding and penalizes drag that comes from chop where arithmetic pace is high but growth is poor.
Tail imbalance that counts decisive bursts in one direction relative to typical bar amplitude. The three channels are blended, optionally confirmed by a higher timeframe, and then adaptively centered to remove local bias. Entries fire when the score clears an entry gate. Exits occur when the score mean reverts below an exit gate or when thermo stops remove risk. Position size can scale with the certainty of the signal.
2. Why it is original and useful
It mixes orthogonal evidence instead of leaning on a single family of tools. Many regime filters depend on moving averages or volatility compression. Here we add an information view from entropy, a growth view from geometric drift, and a structural view from tail imbalance.
The drift channel separates growth from speed. Arithmetic pace can look strong in whipsaw, yet geometric growth stays weak. The engine measures both and subtracts drag so that only sequences with compounding quality rise.
Tail counting is anchored to AAR which is the average absolute return of bars in the window. This makes the threshold self scaling and portable across symbols and timeframes without hand tuned constants.
Adaptive centering prevents the score from living above or below neutral for long stretches on assets with strong skew. It recovers neutrality while still allowing persistent regimes to dominate once evidence accumulates.
The same AAR unit used in the signal also sets stop distance and trail distance. Signal and risk speak the same language which makes the method portable and easier to reason about.
3. Plain language overview of the math
Log returns . The base series is r equal to the natural log of close divided by the previous close. Log return allows clean aggregation and makes growth comparisons natural.
Directional entropy . Inside the lookback we compute the proportion p of bars where r is positive. Binary entropy of p is high when the mix of up and down closes is balanced and low when one direction dominates. Intensity is one minus entropy. Directional sign is two times p minus one. The trend channel is zero point five plus one half times sign times intensity. It lives between zero and one and grows stronger as unanimity increases.
Convexity drift with drag . Arithmetic mean of r measures pace. Geometric mean of the price ratio over the window measures compounding. Drag is the positive part of arithmetic minus geometric. Drift raw equals geometric minus drag multiplier times drag. We then map drift through an arctangent normalizer scaled by AAR and a nonlinearity parameter so the result is stable and remains between zero and one.
Tail imbalance . AAR equals the average of the absolute value of r in the window. We count up tails where r is greater than aar_mult times AAR and down tails where r is less than minus aar_mult times AAR. The imbalance is their difference over their total, mapped to zero to one. This detects directional impulse flow.
Fusion and centering . A weighted average of the three channels yields the raw score. If a higher timeframe is requested, the same function is executed on that timeframe with lookahead off and blended with a weight. Finally we subtract a fraction of the rolling mean of the score to recover neutrality. The result is clipped to the zero to one band.
4. Entries, exits, and position sizing
Enter long when score is strictly greater than the entry gate. Enter short when score is strictly less than one minus the entry gate unless direction is restricted in inputs.
Exit a long when score falls below the exit gate. Exit a short when score rises above one minus the exit gate.
Thermo stops are expressed in AAR units. A long uses the maximum of an initial stop sized by the entry price and AAR and a trail stop that references the running high since entry with a separate multiple. Shorts mirror this with the running low. If the trail is disabled the initial stop is active.
Cooldown is a simple bar counter that begins when the position returns to flat. It prevents immediate re entry in churn.
Dynamic position size is optional. When enabled the order percent of equity scales between a floor and a cap as the score rises above the gate for longs or below the symmetric gate for shorts.
5. Inputs quick guide with recommended ranges
Every input has a tooltip in the script. The same guidance appears here for fast reading.
Core window . Shared lookback for entropy, drift, and tails. Start near 80 on daily charts. Try 60 to 120 on intraday and 80 to 200 for swing.
Entry threshold . Typical range 0.55 to 0.65 for trend following. Faster entries 0.50 to 0.55.
Exit threshold . Typical range 0.35 to 0.50. Lower holds longer yet gives back more.
Weight directional entropy . Starting value 0.40. Raise on markets with clean persistence.
Weight convexity drift . Starting value 0.40. Raise when compounding quality is critical.
Weight tail imbalance . Starting value 0.20. Raise on breakout prone markets.
Tail threshold vs AAR . Typical range 1.0 to 1.5 to count decisive bursts.
Drag penalty . Typical range 0.25 to 0.75. Higher punishes chop more.
Nonlinearity scale . Typical range 0.8 to 2.0. Larger compresses extremes.
AAR floor in percent . Typical range 0.0005 to 0.002 for liquid instruments. This stabilizes the math during quiet regimes.
Adaptive centering . Keep on for most symbols. Center strength 0.40 to 0.70.
Confirm timeframe optional . Leave empty to disable. If used, try a multiple between three and five of the chart timeframe with a blend weight near 0.20.
Dynamic position size . Enable if you want size to reflect certainty. Floor and cap define the percent of equity band. A practical band for many accounts is 0.5 to 2.
Cooldown bars after exit . Start at 3 on daily or slightly higher on shorter charts.
Thermo stop multiple . Start between 1.5 and 3.0 on daily. Adjust to your tolerance and symbol behavior.
Thermo trailing stop and Trail multiple . Trail on locks gains earlier. A trail multiple near 1.0 to 2.0 is common. You can keep trail off and let the exit gate handle exits.
Background heat opacity . Cosmetic. Set to taste. Zero disables it.
6. Properties used on the published chart
The example publication uses BTCUSD on the daily timeframe. The following Properties and inputs are used so everyone can reproduce the same results.
Initial capital 100000
Base currency USD
Order size 2 percent of equity coming from our risk management inputs.
Pyramiding 0
Commission 0.05 percent
Slippage 10 ticks in the publication for clarity. Users should introduce slippage in their own research.
Recalculate after order is filled off. On every tick off.
Using bar magnifier on. On bar close on.
Risk inputs on the published chart. Dynamic position size on. Size floor percent 2. Size cap percent 2. Cooldown bars after exit 3. Thermo stop multiple 2.5. Thermo trailing stop off. Trail multiple 1.
7. Visual elements and alerts
The score is painted as a subtle dot rail near the bottom. A background heat map runs from red to green to convey regime strength at a glance. A compact HUD at the top right shows current score, the three component channels, the active AAR, and the remaining cooldown. Four alerts are included. Long Setup and Short Setup on entry gates. Exit Long by Score and Exit Short by Score on exit gates. You can disable trading and use alerts only if you want the score as a risk switch inside a discretionary plan.
8. How to reproduce the example
Open a BTCUSD daily chart with regular candles.
Add the strategy and load the defaults that match the values above.
Set Properties as listed in section 6.(they are set by default) Confirm that bar magnifier is on and process on bar close is on.
Run the Strategy Tester. Confirm that the trade count is reasonable for the sample. If the count is too low, slightly lower the entry threshold or extend history. If the count is excessively high, raise the threshold or add a small cooldown.
9. Practical tuning recipes
Trend following focus . Raise the entry threshold toward 0.60. Raise the trend weight to 0.50 and reduce tail weight to 0.15. Keep drift near 0.35 to retain the growth filter. Consider leaving the trail off and let the exit threshold manage positions.
Breakout focus . Keep entry near 0.55. Raise tail weight to 0.35. Keep aar_mult near 1.3 so only decisive bursts count. A modest cooldown near 5 can reduce immediate false flips after the first burst bar.
Chop defense . Raise drag multiplier to 0.70. Raise exit threshold toward 0.48 to recycle capital earlier. Consider a higher cooldown, for example 8 to 12 on intraday.
Higher timeframe blend . On a daily chart try a weekly confirm with a blend near 0.20. On a five minute chart try a fifteen minute confirm. This moderates transitions.
Sizing discipline . If you want constant position size, set floor equal to cap. If you want certainty scaling, set a band like 0.5 to 2 and monitor drawdown behavior before widening it.
10. Strengths and limitations
Strengths
Self scaling unit through AAR makes the tool portable across markets and timeframes.
Blends evidence that target different failure modes. Unanimity, growth quality, and impulse flow rarely agree by chance which raises confidence when they align.
Adaptive centering reduces structural bias at the score level which helps during regime flips.
Limitations
In very quiet regimes AAR becomes small even with a floor. If your symbol is thin or gap prone, raise the floor a little to keep stops and drift mapping stable.
Adaptive centering can delay early breakout acceptance. If you miss starts, lower center strength or temporarily disable centering while you evaluate.
Tail counting uses a fixed multiple of AAR. If a market alternates between very calm and very violent weeks, a single aar_mult may not capture both extremes. Sweep this parameter in research.
The engine reacts to realized structure. It does not anticipate scheduled news or liquidity shocks. Use event awareness if you trade around releases.
11. Realism and responsible publication
No promises or projections of performance are made. Past results never guarantee future outcomes.
Commission is set to 0.05 percent per round which is realistic for many crypto venues. Adjust to your own broker or exchange.
Slippage is set at 10 in the publication . Introduce slippage in your own tests or use a percent model.
Position size should respect sustainable risk envelopes. Risking more than five to ten percent per trade is rarely viable. The example uses a fixed two percent position size.
Security calls use lookahead off. Standard candles only. Non standard chart types like Heikin Ashi or Renko are not supported for strategies that submit orders.
12. Suggested research workflow
Begin with the balanced defaults. Confirm that the trade count is sensible for your timeframe and symbol. As a rough guide, aim for at least one hundred trades across a wide sample for statistical comfort. If your timeframe cannot produce that count, complement with multiple symbols or run longer history.
Sweep entry and exit thresholds on a small grid and observe stability. Stability across windows matters more than the single best value.
Try one higher timeframe blend with a modest weight. Large weights can drown the signal.
Vary aar_mult and drag_mult together. This tunes the aggression of breakouts versus defense in chop.
Evaluate whether dynamic size improves risk adjusted results for your style. If not, set floor equal to cap for constancy.
Walk forward through disjoint segments and inspect results by regime. Bootstrapping or segmented evaluation can reveal sensitivity to specific periods.
13. How to read the HUD and heat map
The HUD presents a compact view. Score is the current fused value. Trend is the directional entropy channel. Drift is the compounding quality channel. Tail is the burst flow channel. AAR is the current unit that scales stops and the drift map. CD is the cooldown counter. The background heat is a visual aid only. It can be disabled in inputs. Green zones near the upper band show alignment among the channels. Muted colors near the mid band show uncertainty.
14. Frequently asked questions
Can I use this as a pure indicator . Yes. Disable entries by restricting direction to one side you will not trade and use the alerts as a regime switch.
Will it work on intraday charts . Yes. The AAR unit scales with bar size. You will likely reduce the core window and increase cooldown slightly.
Should I enable the adaptive trail . If you wish to lock gains sooner and accept more exits, enable it. If you prefer to let the exit gate do the heavy lifting, keep it off.
Why do I sometimes see a green background without a position . Heat expresses the score. A position also depends on threshold comparisons, direction mode, and cooldown.
Why is Order size set to one hundred percent if dynamic size is on . The script passes an explicit quantity percent on each entry. That explicit quantity overrides the property. The property is kept at one hundred percent to avoid confusion when users later disable dynamic sizing.
Can I combine this with other tools on my chart . You can, yet for publication the chart is kept clean so users and moderators can see the output clearly. In your private workspace feel free to add other context.
15. Concepts glossary
AAR . Average absolute return across the lookback. Serves as a unit for tails, drift scaling, and stops.
Directional entropy . A measure of uncertainty of up versus down closes. Low entropy paired with a directional sign signals unanimity.
Geometric mean growth . Rate that preserves the effect of compounding over many bars.
Drag . The positive difference between arithmetic pace and geometric growth. Larger drag often signals churn that looks active but fails to compound.
Thermo stops . Stops expressed in the same AAR unit as the signal. They adapt with volatility and keep risk and signal on a common scale.
Adaptive centering . A bias correction that recenters the fused score around neutral so the meter does not drift due to persistent skew.
16. Educational notice and risk statement
Markets involve risk. This publication is for education and research. It does not provide financial advice and it is not a recommendation to buy or sell any instrument. Use realistic costs. Validate ideas with out of sample testing and with conservative position sizing. Past performance never guarantees future results.
17. Final notes for readers and moderators
The goal of this strategy is clarity and portability. Clarity comes from a single score that reflects three independent features of the tape. Portability comes from self scaling units that respect structure across assets and timeframes. The publication keeps the chart clean, explains the math plainly, lists defaults and Properties used, and includes warnings where care is required. The code is protected so the implementation remains consistent for the community while the description remains complete enough for users to understand its purpose and for moderators to evaluate originality and usefulness. If you explore variants, keep them self contained, explain exactly what they contribute, publish in English first, and treat others with respect in the comments.
Load the strategy on BTCUSD daily with the defaults listed above and study how the score transitions across regimes. Then adjust one lever at a time. Observe how the trend channel, the drift channel, and the tail channel interact during starts, pauses, and reversals. Use the alerts as a risk switch inside your own process or let the built in entries and exits run if you prefer an automated study. The intent is not to promise outcomes. The intent is to give you a robust meter for regime strength that travels well across markets and helps you structure decisions with more confidence.
Thank you for your time to read all of this

The Best Strategy Template[LuciTech]Hello Traders,
This is a powerful and flexible strategy template designed to help you create, backtest, and deploy your own custom trading strategies. This template is not a ready-to-use strategy but a framework that simplifies the development process by providing a wide range of pre-built features and functionalities.
What It Does
The LuciTech Strategy Template provides a robust foundation for building your own automated trading strategies. It includes a comprehensive set of features that are essential for any serious trading strategy, allowing you to focus on your unique trading logic without having to code everything from scratch.
Key Features
The LuciTech Strategy Template integrates several powerful features to enhance your strategy development:
•
Advanced Risk Management: This includes robust controls for defining your Risk Percentage per Trade, setting a precise Risk-to-Reward Ratio, and implementing an intelligent Breakeven Stop-Loss mechanism that automatically adjusts your stop to the entry price once a specified profit threshold is reached. These elements are crucial for capital preservation and consistent profitability.
•
Flexible Stop-Loss Options: The template offers adaptable stop-loss calculation methods, allowing you to choose between ATR-Based Stop-Loss, which dynamically adjusts to market volatility, and Candle-Based Stop-Loss, which uses structural price points from previous candles. This flexibility ensures the stop-loss strategy aligns with diverse trading styles.
•
Time-Based Filtering: Optimize your strategy's performance by restricting trading activity to specific hours of the day. This feature allows you to avoid unfavorable market conditions or focus on periods of higher liquidity and volatility relevant to your strategy.
•
Customizable Webhook Alerts: Stay informed with advanced notification capabilities. The template supports sending detailed webhook alerts in various JSON formats (Standard, Telegram, Concise Telegram) to external platforms, facilitating real-time monitoring and potential integration with automated trading systems.
•
Comprehensive Visual Customization: Enhance your analytical clarity with extensive visual options. You can customize the colors of entry, stop-loss, and take-profit lines, and effectively visualize market inefficiencies by displaying and customizing Fair Value Gap (FVG) boxes directly on your chart.
How It Does It
The LuciTech Strategy Template is meticulously crafted using Pine Script, TradingView's powerful and expressive programming language. The underlying architecture is designed for clarity and modularity, allowing for straightforward integration of your unique trading signals. At its core, the template operates by taking user-defined entry and exit conditions and then applying a sophisticated layer of risk management, position sizing, and trade execution logic.
For instance, when a longCondition or shortCondition is met, the template dynamically calculates the appropriate position size. This calculation is based on your specified risk_percent of equity and the stop_distance (the distance between your entry price and the calculated stop-loss level). This ensures that each trade adheres to your predefined risk parameters, a critical component of disciplined trading.
The flexibility in stop-loss calculation is achieved through a switch statement that evaluates the sl_type input. Whether you choose an ATR-based stop, which adapts to market volatility, or a candle-based stop, which uses structural price points, the template seamlessly integrates these methods. The ATR calculation itself is further refined by allowing various smoothing methods (RMA, SMA, EMA, WMA), providing granular control over how volatility is measured.
Time-based filtering is implemented by comparing the current bar's time with user-defined start_hour, start_minute, end_hour, and end_minute inputs. This allows the strategy to activate or deactivate trading during specific market sessions or periods of the day, a valuable tool for optimizing performance and avoiding unfavorable conditions.
Furthermore, the template incorporates advanced webhook alert functionality. When a trade is executed, a customizable JSON message is formatted based on your webhook_format selection (Standard, Telegram, or Concise Telegram) and sent via alert function. This enables seamless integration with external services for real-time notifications or even automated trade execution through third-party platforms.
Visual feedback is paramount for understanding strategy behavior. The template utilizes plot and fill functions to clearly display entry prices, stop-loss levels, and take-profit targets directly on the chart. Customizable colors for these elements, along with dedicated options for Fair Value Gap (FVG) boxes, enhance the visual analysis during backtesting and live trading, making it easier to interpret the strategy's actions.
How It's Original
The LuciTech Strategy Template distinguishes itself in the crowded landscape of TradingView scripts through its unique combination of integrated, advanced risk management features, highly flexible stop-loss methodologies, and sophisticated alerting capabilities, all within a user-friendly and modular framework. While many templates offer basic entry/exit signal integration, LuciTech goes several steps further by providing a robust, ready-to-use infrastructure for managing the entire trade lifecycle once a signal is generated.
Unlike templates that might require users to piece together various risk management components or code complex stop-loss logic from scratch, LuciTech offers these critical functionalities out-of-the-box. The inclusion of dynamic position sizing based on a user-defined risk percentage, a configurable risk-to-reward ratio, and an intelligent breakeven mechanism significantly elevates its utility. This comprehensive approach to capital preservation and profit targeting is a cornerstone of professional trading and is often overlooked or simplified in generic templates.
Furthermore, the template's provision for multiple stop-loss calculation types—ATR-based for volatility adaptation, and candle-based for structural support/resistance—demonstrates a deep understanding of diverse trading strategies. The underlying code for these calculations is already implemented, saving developers considerable time and effort. The subtle yet powerful inclusion of FVG (Fair Value Gap) related inputs also hints at advanced price action concepts, offering a sophisticated layer of analysis and execution that is not commonly found in general-purpose templates.
The advanced webhook alerting system, with its support for various JSON formats tailored for platforms like Telegram, showcases an originality in catering to the needs of modern, automated trading setups. This moves beyond simple TradingView pop-up alerts, enabling seamless integration with external systems for real-time trade monitoring and execution. This level of external connectivity and customizable data output is a significant differentiator.
In essence, the LuciTech Strategy Template is original not just in its individual features, but in how these features are cohesively integrated to form a powerful, opinionated, yet highly adaptable system. It empowers traders to focus their creative energy on developing their core entry/exit signals, confident that the underlying framework will handle the complexities of risk management, trade execution, and external communication with precision and flexibility. It's a comprehensive solution designed to accelerate the development of robust and professional trading strategies.
How to Modify the Logic to Apply Your Strategy
The LuciTech Strategy Template is designed with modularity in mind, making it exceptionally straightforward to integrate your unique trading strategy logic. The template provides a clear separation between the core strategy management (risk, position sizing, exits) and the entry signal generation. This allows you to easily plug in your own buy and sell conditions without altering the robust underlying framework.
Here’s a step-by-step guide on how to adapt the template to your specific trading strategy:
1.
Locate the Strategy Logic Section:
Open the Pine Script editor in TradingView and navigate to the section clearly marked with the comment //Strategy Logic Example:. This is where the template’s placeholder entry conditions (a simple moving average crossover) are defined.
2.
Define Your Custom Entry Conditions:
Within this section, you will find variables such as longCondition and shortCondition. These are boolean variables that determine when a long or short trade should be initiated. Replace the existing example logic with your own custom buy and sell conditions. Your conditions can be based on any combination of indicators, price action patterns, candlestick formations, or other market analysis techniques. For example, if your strategy involves a combination of RSI and MACD, you would define longCondition as (rsi > 50 and macd_line > signal_line) and shortCondition as (rsi < 50 and macd_line < signal_line).
3.
Leverage the Template’s Built-in Features:
Once your longCondition and shortCondition are defined, the rest of the template automatically takes over. The integrated risk management module will calculate the appropriate position size based on your Risk % input and the chosen Stop Loss Type. The Risk:Reward ratio will determine your take-profit levels, and the Breakeven at R feature will manage your stop-loss dynamically. The time filter (Use Time Filter) will ensure your trades only occur within your specified hours, and the webhook alerts will notify you of trade executions.

Advanced Supertrend ADX Strategy with Highest ReturnOverview
This sophisticated trading strategy combines the proven Supertrend indicator with advanced momentum filters and trend strength analysis to identify high-probability long entries in trending markets.
Key Features
✅ Supertrend-Based Signals: Uses optimized ATR calculations for reliable trend detection
✅ Advanced Momentum Filtering: Multiple proprietary momentum filters ensure entry quality
✅ Trend Strength Validation: ADX-based confirmation prevents false signals in weak trends
✅ Intelligent Risk Management: Dynamic stop-loss system based on price action
✅ Visual Stop Loss Indicators: Clear visual representation of risk levels
How It Works
The strategy enters long positions when:
Supertrend indicator confirms bullish trend reversal
Proprietary momentum conditions align for optimal entry timing
Trend strength exceeds minimum threshold (ADX > 20)
Multiple timeframe momentum filters confirm signal quality
Ideal For
Trending markets (stocks, forex, crypto, indices)
Swing trading timeframes (15m to 4H work best)
Traders seeking systematic, rule-based entries
Risk-conscious traders wanting clear stop levels
Settings
ATR Period: Adjustable for different volatility environments (default: 10)
Supertrend Factor: Fine-tune sensitivity (default: 3.0)
ADX Parameters: Customize trend strength requirements
Performance Notes
Long-only strategy optimized for uptrending markets
Works best in trending conditions, may underperform in choppy markets
Designed for systematic execution with clear entry/exit rules
Disclaimer
Past performance does not guarantee future results. Always use proper risk management and position sizing appropriate for your account size. This is just for education purpose only and not recomanded for trading in s

is_strategyCorrection-Adaptive Trend Strategy (Open-Source)
Core Advantage: Designed specifically for the is_correction indicator, with full transparency and customization options.
Key Features:
Open-Source Code:
✅ Full access to the strategy logic – study how every trade signal is generated.
✅ Freedom to customize – modify entry/exit rules, risk parameters, or add new indicators.
✅ No black boxes – understand and trust every decision the strategy makes.
Built for is_correction:
Filters out false signals during market noise.
Works only in confirmed trends (is_correction = false).
Adaptable for Your Needs:
Change Take Profit/Stop Loss ratios directly in the code.
Add alerts, notifications, or integrate with other tools (e.g., Volume Profile).
For Developers/Traders:
Use the code as a template for your own strategies.
Test modifications risk-free on historical data.
How the Strategy Works:
Main Goal:
Automatically buys when the price starts rising and sells when it starts falling, but only during confirmed trends (ignoring temporary pullbacks).
What You See on the Chart:
📈 Up arrows ▼ (below the candle) = Buy signal.
📉 Down arrows ▲ (above the candle) = Sell signal.
Gray background = Market is in a correction (no trades).
Key Mechanics:
Buy Condition:
Price closes higher than the previous candle + is_correction confirms the main trend (not a pullback).
Example: Red candle → green candle → ▼ arrow → buy.
Sell Condition:
Price closes lower than the previous candle + is_correction confirms the trend (optional: turn off short-selling in settings).
Exit Rules:
Closes trades automatically at:
+0.5% profit (adjustable in settings).
-0.5% loss (adjustable).
Or if a reverse signal appears (e.g., sell signal after a buy).
User-Friendly Settings:
Sell – On (default: ON):
ON → Allows short-selling (selling when price falls).
OFF → Strategy only buys and closes positions.
Revers (default: OFF):
ON → Inverts signals (▼ = sell, ▲ = buy).
%Profit & %Loss:
Adjust these values (0-30%) to increase/decrease profit targets and risk.
Example Scenario:
Buy Signal:
Price rises for 3 days → green ▼ arrow → strategy buys.
Stop loss set 0.5% below entry price.
If price keeps rising → trade closes at +0.5% profit.
Correction Phase:
After a rally, price drops for 1 day → gray background → strategy ignores the drop (no action).
Stop Loss Trigger:
If price drops 0.5% from entry → trade closes automatically.
Key Features:
Correction Filter (is_correction):
Acts as a “noise filter” → avoids trades during temporary pullbacks.
Flexibility:
Disable short-selling, flip signals, or tweak profit/loss levels in seconds.
Transparency:
Open-source code → see exactly how every signal is generated (click “Source” in TradingView).
Tips for Beginners:
Test First:
Run the strategy on historical data (click the “Chart” icon in TradingView).
See how it performed in the past.
Customize It:
Increase %Profit to 2-3% for volatile assets like crypto.
Turn off Sell – On if short-selling confuses you.
Trust the Stop Loss:
Even if you think the price will rebound, the strategy will close at -0.5% to protect your capital.
Where to Find Settings:
Click the strategy name on the top-left of your chart → adjust sliders/toggles in the menu.
Русская Версия
Трендовая стратегия с открытым кодом
Главное преимущество: Полная прозрачность логики и адаптация под ваши нужды.
Особенности:
Открытый исходный код:
✅ Видите всю «кухню» стратегии – как формируются сигналы, когда открываются сделки.
✅ Меняйте правила – корректируйте тейк-профит, стоп-лосс или добавляйте новые условия.
✅ Никаких секретов – вы контролируете каждое правило.
Заточка под is_correction:
Игнорирует ложные сигналы в коррекциях.
Работает только в сильных трендах (is_correction = false).
Гибкая настройка:
Подстройте параметры под свой риск-менеджмент.
Добавьте свои индикаторы или условия для входа.
Для трейдеров и разработчиков:
Используйте код как основу для своих стратегий.
Тестируйте изменения на истории перед реальной торговлей.
Простыми словами:
Почему это удобно:
Открытый код = полный контроль. Вы можете:
Увидеть, как именно стратегия решает купить или продать.
Изменить правила закрытия сделок (например, поставить TP=2% вместо 1.5%).
Добавить новые условия (например, торговать только при высоком объёме).
Примеры кастомизации:
Новички: Меняйте только TP/SL в настройках (без кодинга).
Продвинутые: Добавьте RSI-фильтр, чтобы избегать перекупленности.
Разработчики: Встройте стратегию в свою торговую систему.
Как начать:
Скачайте код из TradingView.
Изучите логику в разделе strategy.entry/exit.
Меняйте параметры в блоке input.* (безопасно!).
Тестируйте изменения и оптимизируйте под свои цели.
Как работает стратегия:
Главная задача:
Автоматически покупает, когда цена начинает расти, и продаёт, когда падает. Но делает это «умно» — только когда рынок в основном тренде, а не во временном откате (коррекции).
Что видно на графике:
📈 Стрелки вверх ▼ (под свечой) — сигнал на покупку.
📉 Стрелки вниз ▲ (над свечой) — сигнал на продажу.
Серый фон — рынок в коррекции (не торгуем).
Как это работает:
Когда покупаем:
Если цена закрылась выше предыдущей и индикатор is_correction показывает «основной тренд» (не коррекция).
Пример: Была красная свеча → стала зелёная → появилась стрелка ▼ → покупаем.
Когда продаём:
Если цена закрылась ниже предыдущей и is_correction подтверждает тренд (опционально, можно отключить в настройках).
Когда закрываем сделку:
Автоматически при достижении:
+0.5% прибыли (можно изменить в настройках).
-0.5% убытка (можно изменить).
Или если появился противоположный сигнал (например, после покупки пришла стрелка продажи).
Настройки для чайников:
«Sell – On» (включено по умолчанию):
Если включено → стратегия будет продавать в шорт.
Если выключено → только покупки и закрытие позиций.
«Revers» (выключено по умолчанию):
Если включить → стратегия будет работать наоборот (стрелки ▼ = продажа, ▲ = покупка).
«%Profit» и «%Loss»:
Меняйте эти цифры (от 0 до 30), чтобы увеличить/уменьшить прибыль и риски.
Пример работы:
Сигнал на покупку:
Цена 3 дня растет → появляется зелёная стрелка ▼ → стратегия покупает.
Стоп-лосс ставится на 0.5% ниже цены входа.
Если цена продолжает расти → сделка закрывается при +0.5% прибыли.
Коррекция:
После роста цена падает на 1 день → фон становится серым → стратегия игнорирует это падение (не закрывает сделку).
Стоп-лосс:
Если цена упала на 0.5% от точки входа → сделка закрывается автоматически.
Важные особенности:
Фильтр коррекций (is_correction):
Это «защита от шума» — стратегия не реагирует на мелкие откаты, работая только в сильных трендах.
Гибкие настройки:
Можно запретить шорты, перевернуть сигналы или изменить уровни прибыли/убытка за 2 клика.
Прозрачность:
Весь код открыт → вы можете увидеть, как формируется каждый сигнал (меню «Исходник» в TradingView).
Советы для новичков:
Начните с теста:
Запустите стратегию на исторических данных (кнопка «Свеча» в окне TradingView).
Посмотрите, как она работала в прошлом.
Настройте под себя:
Увеличьте %Profit до 2-3%, если торгуете валюты.
Отключите «Sell – On», если не понимаете шорты.
Доверяйте стоп-лоссу:
Даже если кажется, что цена развернётся — стратегия закроет сделку при -0.5%, защитив ваш депозит.
Где найти настройки:
Кликните на название стратегии в верхнем левом углу графика → откроется меню с ползунками и переключателями.
Важно: Стратегия предоставляет «рыбу» – чтобы она стала «уловистой», адаптируйте её под свой стиль торговли!

Ensemble Alerts█ OVERVIEW
This indicator creates highly customizable alert conditions and messages by combining several technical conditions into groups , which users can specify directly from the "Settings/Inputs" tab. It offers a flexible framework for building and testing complex alert conditions without requiring code modifications for each adjustment.
█ CONCEPTS
Ensemble analysis
Ensemble analysis is a form of data analysis that combines several "weaker" models to produce a potentially more robust model. In a trading context, one of the most prevalent forms of ensemble analysis is the aggregation (grouping) of several indicators to derive market insights and reinforce trading decisions. With this analysis, traders typically inspect multiple indicators, signaling trade actions when specific conditions or groups of conditions align.
Simplifying ensemble creation
Combining indicators into one or more ensembles can be challenging, especially for users without programming knowledge. It usually involves writing custom scripts to aggregate the indicators and trigger trading alerts based on the confluence of specific conditions. Making such scripts customizable via inputs poses an additional challenge, as it often involves complicated input menus and conditional logic.
This indicator addresses these challenges by providing a simple, flexible input menu where users can easily define alert criteria by listing groups of conditions from various technical indicators in simple text boxes . With this script, you can create complex alert conditions intuitively from the "Settings/Inputs" tab without ever writing or modifying a single line of code. This framework makes advanced alert setups more accessible to non-coders. Additionally, it can help Pine programmers save time and effort when testing various condition combinations.
█ FEATURES
Configurable alert direction
The "Direction" dropdown at the top of the "Settings/Inputs" tab specifies the allowed direction for the alert conditions. There are four possible options:
• Up only : The indicator only evaluates upward conditions.
• Down only : The indicator only evaluates downward conditions.
• Up and down (default): The indicator evaluates upward and downward conditions, creating alert triggers for both.
• Alternating : The indicator prevents alert triggers for consecutive conditions in the same direction. An upward condition must be the first occurrence after a downward condition to trigger an alert, and vice versa for downward conditions.
Flexible condition groups
This script features six text inputs where users can define distinct condition groups (ensembles) for their alerts. An alert trigger occurs if all the conditions in at least one group occur.
Each input accepts a comma-separated list of numbers with optional spaces (e.g., "1, 4, 8"). Each listed number, from 1 to 35, corresponds to a specific individual condition. Below are the conditions that the numbers represent:
1 — RSI above/below threshold
2 — RSI below/above threshold
3 — Stoch above/below threshold
4 — Stoch below/above threshold
5 — Stoch K over/under D
6 — Stoch K under/over D
7 — AO above/below threshold
8 — AO below/above threshold
9 — AO rising/falling
10 — AO falling/rising
11 — Supertrend up/down
12 — Supertrend down/up
13 — Close above/below MA
14 — Close below/above MA
15 — Close above/below open
16 — Close below/above open
17 — Close increase/decrease
18 — Close decrease/increase
19 — Close near Donchian top/bottom (Close > (Mid + HH) / 2)
20 — Close near Donchian bottom/top (Close < (Mid + LL) / 2)
21 — New Donchian high/low
22 — New Donchian low/high
23 — Rising volume
24 — Falling volume
25 — Volume above average (Volume > SMA(Volume, 20))
26 — Volume below average (Volume < SMA(Volume, 20))
27 — High body to range ratio (Abs(Close - Open) / (High - Low) > 0.5)
28 — Low body to range ratio (Abs(Close - Open) / (High - Low) < 0.5)
29 — High relative volatility (ATR(7) > ATR(40))
30 — Low relative volatility (ATR(7) < ATR(40))
31 — External condition 1
32 — External condition 2
33 — External condition 3
34 — External condition 4
35 — External condition 5
These constituent conditions fall into three distinct categories:
• Directional pairs : The numbers 1-22 correspond to pairs of opposing upward and downward conditions. For example, if one of the inputs includes "1" in the comma-separated list, that group uses the "RSI above/below threshold" condition pair. In this case, the RSI must be above a high threshold for the group to trigger an upward alert, and the RSI must be below a defined low threshold to trigger a downward alert.
• Non-directional filters : The numbers 23-30 correspond to conditions that do not represent directional information. These conditions act as filters for both upward and downward alerts. Traders often use non-directional conditions to refine trending or mean reversion signals. For instance, if one of the input lists includes "30", that group uses the "Low relative volatility" condition. The group can trigger an upward or downward alert only if the 7-period Average True Range (ATR) is below the 40-period ATR.
• External conditions : The numbers 31-35 correspond to external conditions based on the plots from other indicators on the chart. To set these conditions, use the source inputs in the "External conditions" section near the bottom of the "Settings/Inputs" tab. The external value can represent an upward, downward, or non-directional condition based on the following logic:
▫ Any value above 0 represents an upward condition.
▫ Any value below 0 represents a downward condition.
▫ If the checkbox next to the source input is selected, the condition becomes non-directional . Any group that uses the condition can trigger upward or downward alerts only if the source value is not 0.
To learn more about using plotted values from other indicators, see this article in our Help Center and the Source input section of our Pine Script™ User Manual.
Group markers
Each comma-separated list represents a distinct group , where all the listed conditions must occur to trigger an alert. This script assigns preset markers (names) to each condition group to make the active ensembles easily identifiable in the generated alert messages and labels. The markers assigned to each group use the format "M", where "M" is short for "Marker" and "x" is the group number. The titles of the inputs at the top of the "Settings/Inputs" tab show these markers for convenience.
For upward conditions, the labels and alert messages show group markers with upward triangles (e.g., "M1▲"). For downward conditions, they show markers with downward triangles (e.g., "M1▼").
NOTE: By default, this script populates the "M1" field with a pre-configured list for a mean reversion group ("2,18,24,28"). The other fields are empty. If any "M*" input does not contain a value, the indicator ignores it in the alert calculations.
Custom alert messages
By default, the indicator's alert message text contains the activated markers and their direction as a comma-separated list. Users can override this message for upward or downward alerts with the two text fields at the bottom of the "Settings/Inputs" tab. When the fields are not empty , the alerts use that text instead of the default marker list.
NOTE: This script generates alert triggers, not the alerts themselves. To set up an alert based on this script's conditions, open the "Create Alert" dialog box, then select the "Ensemble Alerts" and "Any alert() function call" options in the "Condition" tabs. See the Alerts FAQ in our Pine Script™ User Manual for more information.
Condition visualization
This script offers organized visualizations of its conditions, allowing users to inspect the behaviors of each condition alongside the specified groups. The key visual features include:
1) Conditional plots
• The indicator plots the history of each individual condition, excluding the external conditions, as circles at different levels. Opposite conditions appear at positive and negative levels with the same absolute value. The plots for each condition show values only on the bars where they occur.
• Each condition's plot is color-coded based on its type. Aqua and orange plots represent opposing directional conditions, and purple plots represent non-directional conditions. The titles of the plots also contain the condition numbers to which they apply.
• The plots in the separate pane can be turned on or off with the "Show plots in pane" checkbox near the top of the "Settings/Inputs" tab. This input only toggles the color-coded circles, which reduces the graphical load. If you deactivate these visuals, you can still inspect each condition from the script's status line and the Data Window.
• As a bonus, the indicator includes "Up alert" and "Down alert" plots in the Data Window, representing the combined upward and downward ensemble alert conditions. These plots are also usable in additional indicator-on-indicator calculations.
2) Dynamic labels
• The indicator draws a label on the main chart pane displaying the activated group markers (e.g., "M1▲") each time an alert condition occurs.
• The labels for upward alerts appear below chart bars. The labels for downward alerts appear above the bars.
NOTE: This indicator can display up to 500 labels because that is the maximum allowed for a single Pine script.
3) Background highlighting
• The indicator can highlight the main chart's background on bars where upward or downward condition groups activate. Use the "Highlight background" inputs in the "Settings/Inputs" tab to enable these highlights and customize their colors.
• Unlike the dynamic labels, these background highlights are available for all chart bars, irrespective of the number of condition occurrences.
█ NOTES
• This script uses Pine Script™ v6, the latest version of TradingView's programming language. See the Release notes and Migration guide to learn what's new in v6 and how to convert your scripts to this version.
• This script imports our new Alerts library, which features functions that provide high-level simplicity for working with complex compound conditions and alerts. We used the library's `compoundAlertMessage()` function in this indicator. It evaluates items from "bool" arrays in groups specified by an array of strings containing comma-separated index lists , returning a tuple of "string" values containing the marker of each activated group.
• The script imports the latest version of the ta library to calculate several technical indicators not included in the built-in `ta.*` namespace, including Double Exponential Moving Average (DEMA), Triple Exponential Moving Average (TEMA), Fractal Adaptive Moving Average (FRAMA), Tilson T3, Awesome Oscillator (AO), Full Stochastic (%K and %D), SuperTrend, and Donchian Channels.
• The script uses the `force_overlay` parameter in the label.new() and bgcolor() calls to display the drawings and background colors in the main chart pane.
• The plots and hlines use the available `display.*` constants to determine whether the visuals appear in the separate pane.
Look first. Then leap.

Gold Friday Anomaly StrategyThis script implements the " Gold Friday Anomaly Strategy ," a well-known historical trading strategy that leverages the gold market's behavior from Thursday evening to Friday close. It is a backtesting-focused strategy designed to assess the historical performance of this pattern. Traders use this anomaly as it captures a recurring market tendency observed over the years.
What It Does:
Entry Condition: The strategy enters a long position at the beginning of the Friday trading session (Thursday evening close) within the defined backtesting period.
Exit Condition: Friday evening close.
Backtesting Controls: Allows users to set custom backtesting periods to evaluate strategy performance over specific date ranges.
Key Features:
Custom Backtest Periods: Easily configurable inputs to set the start and end date of the backtesting range.
Fixed Slippage and Commission Settings: Ensures realistic simulation of trading conditions.
Process Orders on Close: Backtesting is optimized by processing orders at the bar's close.
Important Notes:
Backtesting Only: This script is intended purely for backtesting purposes. Past performance is not indicative of future results.
Live Trading Recommendations: For live trading, it is highly recommended to use limit orders instead of market orders, especially during evening sessions, as market order slippage can be significant.
Default Settings:
Entry size: 10% of equity per trade.
Slippage: 1 tick.
Commission: 0.05% per trade.

Multi conditions matricesLibrary "multi_conditions_matrices"
: facilitate including multiple AND / OR conditions to a script such as two entry / exit inputs groups.
method addConditions(conditions, conditionPair)
Helper to append conditions to a matrix condition array
Namespace types: matrix
Parameters:
conditions (matrix)
conditionPair (array) : array A condition pair , an input can be passed directly to enable
method check(conditions, operatorAnd)
check several condition within given operator
Namespace types: matrix
Parameters:
conditions (matrix)
operatorAnd (bool) : bool true if the operator between condition is AND (default OR)
Returns: bool Evaluates conditions
isWeekend()
isNightSignal(nightHour, morningHour, timezone)
Parameters:
nightHour (int)
morningHour (int)
timezone (string)
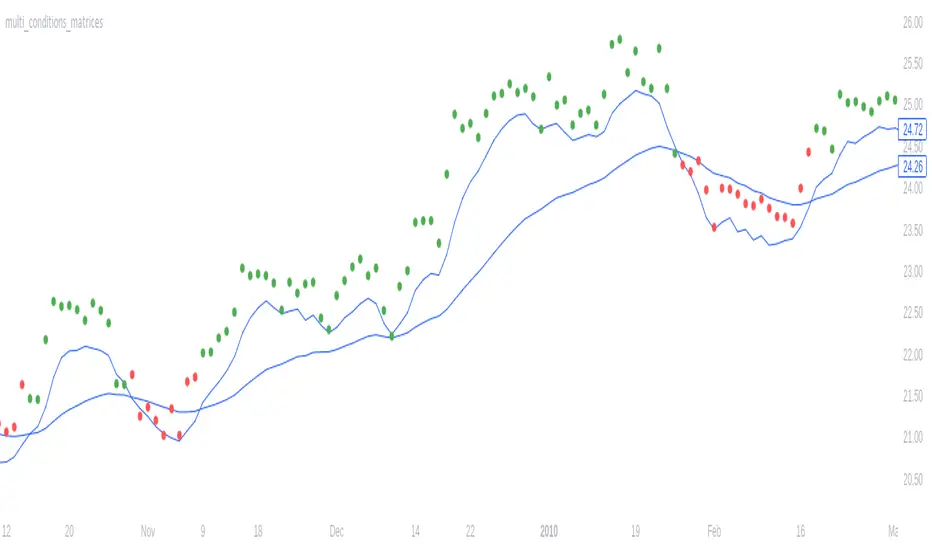
StrategyDashboardLibrary ”StrategyDashboard”
Hey, everybody!
I haven’t done anything here for a long time, I need to get better ^^.
In my strategies, so far private, but not about that, I constantly use dashboards, which clearly show how my strategy is working out.
Of course, you can also find a number of these parameters in the standard strategy window, but I prefer to display everything on the screen, rather than digging through a bunch of boxes and dropdowns.
At the moment I am using 2 dashboards, which I would like to share with you.
1. monthly(isShow)
this is a dashboard with the breakdown of profit by month in per cent. That is, it displays how much percentage you made or lost in a particular month, as well as for the year as a whole.
Parameters:
isShow (bool) - determine allowance to display or not.
2. total(isShow)
The second dashboard displays more of the standard strategy information, but in a table format. Information from the series “number of consecutive losers, number of consecutive wins, amount of earnings per day, etc.”.
Parameters:
isShow (bool) - determine allowance to display or not.
Since I prefer the dark theme of the interface, now they are adapted to it, but in the near future for general convenience I will add the ability to adapt to light.
The same goes for the colour scheme, now it is adapted to the one I use in my strategies (because the library with more is made by cutting these dashboards from my strategies), but will also make customisable part.
If you have any wishes, feel free to write in the comments, maybe I can implement and add them in the next versions.
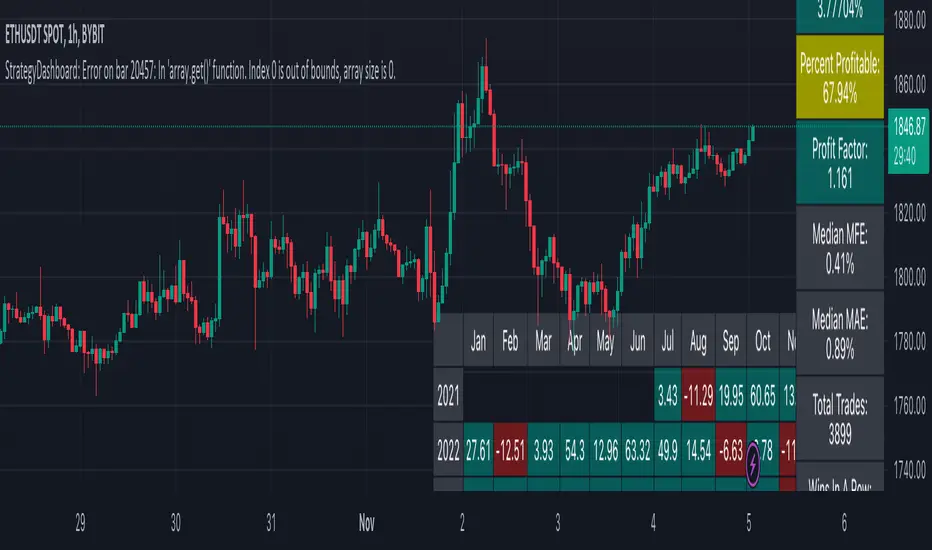
Bonsai BX (Backtester)In today's trading landscape, traders need precision and deep analytical tools to navigate the sea of strategies. The Bonsai Backtester is one such tool, meticulously designed to evaluate multiple trading strategies in an integrated manner.
═════════════════════════════════════════════════════════════════════════
🌳 Bonsai BX 🌳 Universal Strategy Testing
📘 Overview
A product of collaboration with the Bonsai community, this backtester is both a reflection of collective insights and a means to provide traders with data-driven insights on TradingView.
📌 Current Backtest
• Dataset: BTCUSD daily candles from Coinbase, starting from March 2015.
• Source Signals: The Bonsai indicator signals are employed for both long and short entries. These are directly visible on the publication chart.
• Trading Assumptions:
• Initial Capital: $1,000
• Maximum Position Size: 10% of equity per trade
• Stop Loss: 10% per position
• Commission: 0.1%
• Slippage: 100 ticks (1.00)
🛠 Key Features
The Bonsai BX is equipped with a range of features aimed at providing traders with a more comprehensive analysis environment:
Features on Chart
• External Indicator Adaptability: Easily incorporate signals from both built-in and custom TradingView indicators.
• Snapshot Table: Delivers on-the-spot insights into crucial strategy performance metrics, including equity, open profit, position size, and entry price. While these details are available in TradingView's 'Performance Summary' panel, we've integrated them directly onto the chart for a more streamlined and accessible viewing experience.
• Trade Labels: Visualize profit metrics for individual trades directly on the chart, allowing for a more immediate grasp of trade outcomes.
• Long & Short Behaviors: Modify long behaviors to either open new long positions while closing short ones, or simply to close short positions. Conversely, for short behaviors, opt to either initiate new short positions while closing any active long ones or simply close long positions.
• Multiple Signals Integration: The tool can currently handle up to three different external signals for long and short trades.
• Condition-based Initiation: Define whether longs and shorts are triggered when 'All Conditions Met' or just 'Any Single Condition Met'. This flexibility allows for a more nuanced trading approach. For example, if you're using a trade signal alongside the RSI, you can specify that a long position should only open when the trade signal is active and the RSI is below 30 at the same time. This lets you combine multiple signals or conditions for more precise trade initiation.
• TP & SL Customization:
• Single TP: Set a specific Take Profit percentage.
• SL: Define a Stop Loss percentage and choose between a standard or trailing stop.
• Trail From: Specify the starting point of the trailing stop, be it the breakeven point or a certain percentage.
• Interface Theme: Users can select between light and dark themes for their interface.
Performance and Trailing
🎛 Using Bonsai BX
1. Add it to your TradingView chart.
2. Adjust script parameters and settings. Integrate external indicator signals as needed.
3. Activate the backtester to refine trading strategies.
Backtester Settings Menu
🪝 Webhook (Beta)
The Webhook functionality, now in beta, augments the Bonsai BX utility. This feature offers a more intuitive method for users to direct webhooks to trading bots, exchanges, and brokers. It simplifies the process by eliminating the need to adjust JSON structures or other payload formats, making alert automation more accessible.
📜 Feedback & Community
The feedback from the Bonsai community has been instrumental in the tool's development and will continue to shape its evolution. As part of our commitment to adaptive, smart trading, this script will continually be updated to meet the ever-changing requirements of traders.
❗️ Disclaimer
Backtesting tools, including the Bonsai BX , simulate trading strategies based on historical data. The following key points should be kept in mind:
1. Past Performance is Not Predictive: While backtesting can offer insights, it's essential to understand that past performance does not guarantee or predict future results. Historical data might not account for future market changes or unforeseen events.
2. External Influences: Market outcomes can be significantly influenced by various external factors like geopolitical events, economic announcements, and sudden shifts in market sentiment. Such factors are often not considered in backtesting simulations.
3. Market Dynamics: Elements like market volatility, liquidity constraints, and slippage can drastically alter expected outcomes. These dynamics might not always be accurately represented in backtest simulations.
4. Limitations of Simulated Trades: Backtesting operates under the assumption that historical trends and patterns will replicate. However, market conditions evolve, and what worked in the past might not necessarily be viable in the future.
5. Informed Decisions: Always base your trading decisions on a mix of comprehensive research, current market analysis, and risk assessment. Relying solely on backtested results can lead to misconstrued perceptions and potential pitfalls.
Trading involves risks, and it's crucial to be fully informed and cautious before making any investment decisions. Always consider seeking advice from financial experts or professionals when in doubt.
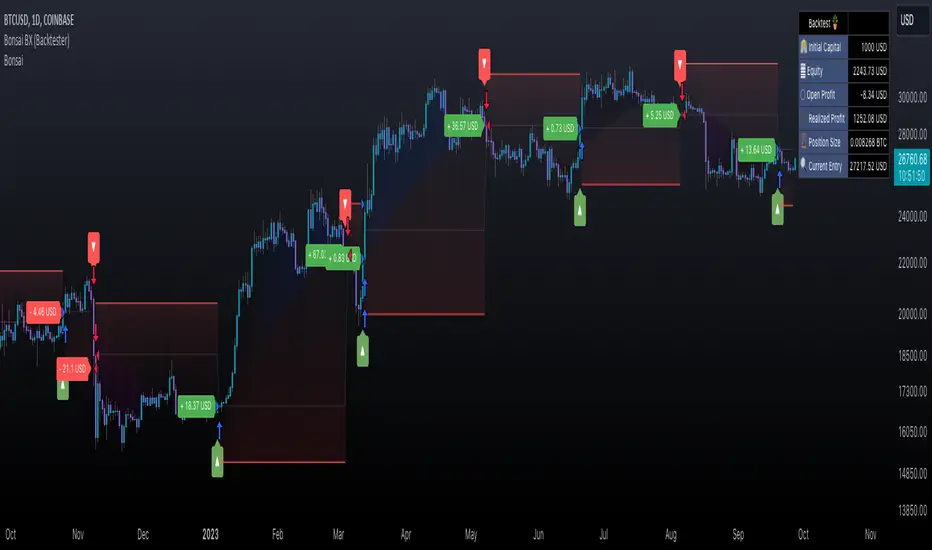
Monte Carlo Simulation - Your Strategy [Kioseff Trading]Hello!
This script “Monte Carlo Simulation - Your Strategy” uses Monte Carlo simulations for your inputted strategy returns or the asset on your chart!
Features
Monte Carlo Simulation: Performs Monte Carlo simulation to generate multiple future paths.
Asset Price or Strategy: Can simulate either future asset prices based on historical log returns or a specific trading strategy's future performance.
User-Defined Input: Allows you to input your own historical returns for simulation.
Statistical Methods: Offers two simulation methods—Gaussian (Normal) distribution and Bootstrapping.
Graphical Display: Provides options for graphical representation, including line plots and histograms.
Cumulative Probability Target: Enables setting a user-defined cumulative probability target to quantify simulation results.
Adjustable Parameters: Offers numerous user-adjustable settings like number of simulations, forecast length, and more.
Historical Data Points: Option to specify the amount of historical data to be used in the simulation (price).
Custom Binning: Allows you to select the binning method for histograms, with options like Sturges, Rice, and Square Root.
Best/Worst Case: Allows you to show only the best case / worst case outcome (range) for all simulations!
Scatterplot: allows you to show up to 1000 potential outcomes for a specified trade number (or bars forward price endpoint) using a scatter plot.
The image above shows the primary components of the indicator!
The image above shows the best/worst case outcome feature in action!
The image above shows a "fun feature" where 1000 simulated end points for a 15-bar price trajectory are shown as a scatter plot!
How To Perform a Monte Carlo Simulation On Your Strategy
Really, you can input any data into the indicator it will perform a Monte Carlo Simulation on it :D
The following instructions show how to export your strategy results from TradingView to an Excel File, copy the data, and input it into the indicator.
However , you are not limited to following this method!
Wherever your strategy results are stored, simply copy and paste them into the indicator text area in the settings and simulations will begin.
Returns Should Follow This Format
1
3
-3
2
-5
The numbers are presented as a single column. No commas or separators used.
The numbers above are in sequential order. A return of "1" for the first trade and a return of "-5" for the last trade. Your strategy returns will likely be in sequential order already so don't worry too much about this (:
How To Perform a Monte Carlo Simulation On Your TradingView Strategy With Excel Data
Export your strategy returns to an excel file using TradingView
Navigate to your downloads folder to column G "Profit"
Click the column and press CTRL + SPACE to highlight the entire column
Press CTRL + C to copy the entire column
Open this indicator's settings and paste the returns into the text area
The image above illustrates the process!
Notes on Inputting Returns
*Must input your returns without a separate as a vertical list
*The initial text area can only hold so many return values. If your list of trades is large you can input additional returns into two additional text areas at the bottom of the indicator settings.
That should be it; thank you for checking this out!
