Adaptive Risk Management [sgbpulse]1. Introduction:
Adaptive Risk Management is an advanced indicator designed to provide traders with a comprehensive risk management tool directly on the chart. Instead of relying on complex manual calculations, the indicator automates all critical steps of trade planning. It dynamically calculates the estimated Entry Price , the Stop Loss location, the required Position Size (Quantity) based on your capital and risk limits, and the three Take Profit targets based on your defined Reward/Risk ratios. The indicator displays all these essential data points clearly and visually on the chart, ensuring you always know the potential risk-reward profile of every trade.
ARM : The A daptive R isk M anagement every trader needs to ARM themselves with.
2. The Critical Importance of Risk Management
Proper risk management is the cornerstone of successful trading. Consistent profitability in the market is impossible without rigorously defining risk limits.
Risk Control: This starts by setting the maximum risk amount you are willing to lose in a single trade (Risk per Trade), and limiting the total capital allocated to the position (Max Capital per Trade).
Defining Boundaries (Stop Loss & Take Profit): It is mandatory to define a technical Stop Loss and a Take Profit target. A fundamental rule of risk management is that the Reward/Risk Ratio (R/R) must be a minimum of 1:1.
3. Core Features, Adaptivity, and Customization
The Adaptive Risk Management indicator is engineered for use across all major trading styles, including Swing Trading, Intraday Trading, and Scalping, providing consistent risk control regardless of the chosen timeframe.
Real-Time Dynamic Adaptivity: The indicator calculates all risk management parameters (Entry, Stop Loss, Quantity) dynamically with every new bar, thus adapting instantly to changing market conditions.
Trend Direction Adjustment: Define the analysis direction (Long/Uptrend or Short/Downtrend).
Intraday Session Data Control: Full control over whether lookback calculations will include data from Extended Trading Hours (ETH), or if the daily calculations will start actively only from the first bar of Regular Trading Hours (RTH).
Status Validation: The indicator performs critical status checks and displays clear Warning Messages if risk conditions are not met.
4. Intuitive Visualization and Real-Time Data
Dynamic Tracking Lines: The Entry Price and Stop Loss lines are updated with every new bar. Crucially, the length of these lines dynamically reflects the calculation's lookback range (e.g., the extent of Lookback Bars or the location of the confirmed Pivot Point), providing a visual anchor for the calculated price.
Risk and Reward Zones: The indicator creates a graphical background fill between Entry and Stop Loss (marked with the risk color) and between Entry and the Reward Targets (marked with the reward color).
Essential Information Labels: Labels are placed at the end of each line, providing critical data: Estimated Entry Price, Stock/Contract Quantity (Quantity), Total Entry Amount, Estimated Stop Loss, Risk per Share, Total Financial Risk (Risk Amount), Exit Amount, Estimated Take Profit 1/2/3, Reward/Risk Ratio 1/2/3, Total Reward 1/2/3, TP Exit Amount 1/2/3.
4.1. Data Window Metrics (16 Full Series)
The indicator displays 16 full data series in the TradingView Data Window, allowing precise tracking of every calculation parameter:
Entry Data: Estimated Entry, Quantity, Entry Amount.
Risk Data (Stop Loss): Estimated Stop Loss, Risk per Share, Risk Amount, Exit Amount.
Reward Data (Take Profit): Estimated Take Profit 1/2/3, Reward/Risk Ratio 1/2/3, Total Reward 1/2/3, TP Exit Amount 1/2/3.
4.2. Instant Tracking in the Status Line
The indicator displays 6 critical parameters continuously in the indicator's Status Line: Estimated Entry, Quantity, Estimated Stop Loss, Estimated Take Profit 1/2/3.
5. Detailed Indicator Inputs
5.1 General
Focused Trend: Defines the analysis direction (Uptrend / Downtrend).
Max Capital per Trade: The maximum amount allocated to purchasing stocks/contracts (in account currency).
Risk per Trade: The maximum amount the user is willing to risk in this single trade (in account currency).
ATR Length: The lookback period for the Average True Range (ATR) calculation.
5.2 Intraday Session Data Control
Regular Hours Limitation : If enabled, all daily lookback calculations (for Entry/Stop Loss anchor points) will begin strictly from the first Regular Trading Hours (RTH) bar. This limits the lookback range to the current RTH session, excluding preceding Extended Trading Hours (ETH) data. Only relevant for Intraday charts. Default: False (Off)
5.3 Entry Inputs
Entry Method: Selects the entry price calculation method:
Current Price: Uses the closing price of the current bar as the estimated entry point (Market Entry).
ATR Real Bodies Margin :
- Uptrend: Calculates the Maximum Real Body over the lookback period + the calculated safety margin.
- Downtrend: Calculates the Minimum Real Body over the lookback period - the calculated safety margin.
ATR Bars Margin :
- Uptrend: Calculates the Maximum High price over the lookback period + the calculated safety margin.
- Downtrend: Calculates the Minimum Low price over the lookback period - the calculated safety margin.
Lookback Bars: The number of bars used to calculate the extremes in the ATR-based entry methods (Relevant only for ATR Real Bodies Margin and ATR Bars Margin methods).
ATR Multiplier (Entry): The multiplier applied to the ATR value. The result of the multiplication is the calculated safety margin used to determine the estimated Entry Price.
5.4 Risk Inputs (Stop Loss)
Risk Method: Selects the Stop Loss price calculation method.
ATR Current Price Margin :
- Uptrend: Entry Price - the calculated safety margin.
- Downtrend: Entry Price + the calculated safety margin.
ATR Current Bar Margin :
- Uptrend: Current Bar's Low price - the calculated safety margin.
- Downtrend: Current Bar's High price + the calculated safety margin.
ATR Bars Margin :
- Uptrend: Lowest Low over lookback period - the calculated safety margin.
- Downtrend: Highest High over lookback period + the calculated safety margin.
ATR Pivot Margin :
- Uptrend: The first confirmed Pivot Low point - the calculated safety margin.
- Downtrend: The first confirmed Pivot High point + the calculated safety margin.
Lookback Bars: The lookback period for finding the extreme price used in the 'ATR Bars Margin' calculation.
ATR Multiplier (Risk): The multiplier applied to the ATR value. The result of the multiplication is the calculated safety margin used to place the estimated Stop Loss. Note: If set to 0, the Stop Loss will be placed exactly at the technical anchor point, provided the Minimum Margin Value is also 0.
Minimum Margin Value: The minimum price value (e.g., $0.01) the Stop Loss margin buffer must be.
Pivot (Left / Right): The number of bars required on either side of the pivot bar for confirmation (relevant only for the ATR Pivot Margin method).
5.5 Reward Inputs (Take Profit)
Show Take Profit 1/2/3: ON/OFF switch to control the visibility of each Take Profit target.
Reward/Risk Ratio 1/ 2/ 3: Defines the R/R ratio for the profit target. Must be ≥1.0.
6. Indicator Status/Warning Messages
In situations where the Stop Loss location cannot be calculated logically and validly, often caused by a mismatch between the configured Focused Trend (Uptrend/Downtrend) and the actual price action, the indicator will display a warning message, explaining the reason and suggesting corrective action.
Status Message 1: Pivot reference unavailable
Condition: The Stop Loss is set to the "ATR Pivot Margin" method, but the anchor point (Pivot) is missing or inaccessible.
Message Displayed: "Pivot reference unavailable. Wait for valid price action, or adjust the Regular Hours Limitation setting or Pivot Left/Right inputs."
Status Message 2: Calculated Stop Loss is unsafe
Condition: The calculated Stop Loss is placed illogically or unsafely relative to the trend direction and the Entry price.
Message Displayed: "Calculated Stop Loss is unsafe for current trend. Wait for valid price action or adjust SL Lookback/Multiplier."
7. Summary
The Adaptive Risk Management (ARM) indicator provides a seamless and systematic approach to trade execution and risk control. By dynamically automating all critical trade parameters—from Entry Price and Stop Loss placement to Position Sizing and Take Profit targets—ARM removes emotional bias and ensures every trade adheres strictly to your predefined risk profile.
Key Benefits:
Systematic Risk Control: Strict enforcement of maximum capital allocation and risk per trade limits.
Adaptivity: Dynamic calculation of prices and quantities based on real-time market data (ATR and Lookback).
Clarity and Trust: Clear on-chart visualization, precise data metrics (16 series), and unambiguous Status/Warning Messages ensure transparency and reliability.
ARM allows traders to focus on strategy and analysis, confident that their execution complies with the core principles of professional risk management.
Important Note: Trading Risk
This indicator is intended for educational and informational purposes only and does not constitute investment advice or a recommendation for trading in any form whatsoever.
Trading in financial markets involves significant risk of capital loss. It is important to remember that past performance is not indicative of future results. All trading decisions are your sole responsibility. Never trade with money you cannot afford to lose.
Stoploss

VYW Stop Loss LinesA simple utility designed to visually display Stop Loss lines on the chart based on an offset from the current price (the orange dashed lines in the screenshot above).
This indicator can also draw a line from the current bar's close price to the Price axis (the dashed gray line in the screenshot above).

CK Auto Adaptive StoplossThis tool automatically finds the best stop-loss for every trade by analyzing candle structure, ATR volatility, volume spikes, and market momentum. It tightens or widens the stop dynamically and shows you exactly how many contracts you can use based on your risk per trade.
It also plots bold stop-loss lines on your chart and includes a live position-sizing table so you always stay consistent.
Multi-Entry Fibonacci CalculatorMulti-Entry Fibonacci Calculator
This tool is a comprehensive trade calculator designed for discretionary traders who plan to scale into positions. It automates the complex task of position sizing across up to three separate entries while ensuring your total risk exposure remains fixed. By inputting your desired entry, stop loss, and initial profit target levels, the script calculates the precise quantity for each entry and provides a dynamic, real-time view of your trade's vitals.
The primary goal of this script is to allow for disciplined risk management in multi-entry trade plans. Whether you are averaging into a position or adding on pullbacks, this tool ensures your total predefined risk is never exceeded, even if all entries are filled.
Key Features
Multi-Entry Position Sizing: Automatically calculates the share/contract size for up to three entries based on their distance from the stop loss and user-defined weights.
Fixed Risk Management: Define your total risk as a percentage of your account. The script ensures that a full stop-out across all filled entries will result in a loss equal to this predefined amount.
Dynamic Take Profit: The take-profit level automatically adjusts based on your current average entry price to preserve the original target profit amount in dollars.
Real-Time Info Panel: A customizable on-chart panel displays all critical trade data, including current quantity, average price, projected P&L, and trade status.
Visual Trade Plan: Plots all your defined price levels (entries, stop loss, take profit) directly on the chart with informative labels.
Trade State Tracking & Alerts: The script monitors the price and will trigger alerts when entries are hit, or when the stop loss or take profit levels are reached.
How to Use
Configure Account & Risk: In the settings, enter your "Account Size" and the "Risk per Trade (%)" you are willing to take on the entire position.
Set Trade Direction: Choose either "LONG" or "SHORT".
Input Price Levels: Manually enter the prices for your entries (Entry 1, 2, 3), your "Stop Loss Price," and an "Initial TP Reference." The initial TP is used to calculate the target profit in dollars.
Distribute Position Weight: Assign weights to each entry (e.g., 50% for Entry 1, 30% for Entry 2, 20% for Entry 3). The total should sum to 100.
Monitor the Trade: Use the info panel and on-chart visuals to track the trade's progress. The script will show your average price as entries are filled and update the dynamic take-profit level accordingly.
Understanding the Calculations
Weighted Position Sizing: The script calculates sizes for each entry so that if all entries are filled and the stop loss is hit, your total loss will equal your predefined risk amount. It intelligently allocates size based on the distance of each entry from the stop loss and the weight you assign to it.
Dynamic Take Profit: The "Initial TP Reference" is used only to calculate a target profit in dollars based on your first entry's size. The script then calculates a dynamic TP line on your chart. This line adjusts based on your average entry price as positions are filled, ensuring that if price reaches this level, you will realize your original target dollar profit, regardless of how many entries were filled.
On-Chart Elements
Price Lines: Blue lines for entries, a red line for the stop loss, and a green line for the dynamic take profit.
Labels: Display the calculated quantity for each entry, the total risk amount at the stop loss, and the target profit amount at the take profit.
Average Price: Yellow circles plot your live average entry price as the position is built.
Info Panel: A comprehensive table showing live trade status, current quantity, average price, and projected profit/loss. The panel changes color to green on a TP hit and red on an SL hit.

Position Size Calculator + Live R/R Panel — SMC/ICT (@PueblaATH)Position Size + Live R/R Panel — SMC/ICT (@PueblaATH)
Position Size + Live R/R Panel — SMC/ICT (@PueblaATH) is a professional-grade risk management and execution module built for Smart Money Concepts (SMC) and ICT Traders who require accurate, repeatable, institution-style trade planning.
This tool delivers precise position sizing, R:R modeling, leverage and margin projections, fee-adjusted PnL outcomes, and real-time execution metrics—all directly on the chart. Optimized for crypto, forex, and futures, it provides scalpers, day traders, and swing traders with the clarity needed to execute high-quality trades with confidence and consistency.
What the Indicator Does
Institutional Position Sizing Engine
Calculates position size based on account balance, % risk, and SL distance.
Supports custom minimum lot size rounding across crypto, FX, indices, and derivatives.
Intelligent direction logic (Auto / Long / Short) based on SMC/ICT structure.
Advanced Risk/Reward & Profit Modeling
Real-time R:R ratio using actual rounded position size.
Live PnL readout that updates with price movements.
Gross & net profit projections with full fee deduction.
Execution Planning with Draggable Levels
Entry, SL, and TP levels fully draggable for fast scenario modeling.
Automatic projected lines backward/forward with clean label alignment.
TP and SL tags include % movement from Entry, ideal for SMC/ICT journaling.
Precise modeling of real exchange fee structures
Maker fee per side
Taker fee per side
Mixed fee modes (Maker entry, Taker exit, Average, etc.)
Leverage & Margin Forecasting
Margin requirements displayed for 3 customizable leverage settings.
Helps traders understand capital commitment before executing the trade.
Useful for futures, crypto perps, and CFD setups.
Clean HUD Panel for Rapid Decision-Making
A full professional trading panel displays:
Target & actual risk
Position size
Entry / SL / TP
TP/SL percentage distance
Gross profit
Net profit (after fees)
Fees @ TP and @ SL
Live PnL
Margin requirements
Optimized for SMC & ICT Workflows
Perfect for traders using:
Breakers, FVGs, OBs
Liquidity sweeps
Session models
Precision entries (OTE, Displacement, Rebalancing)
Leverage-based execution (crypto perps, futures)
How to Use It
Attach the indicator to your chart.
Set account balance, risk %, fee model, and leverage presets.
Drag Entry, SL, and TP to shape the setup.
View instant calculations of: Position size; R:R; Net PnL after fees; Margin required
Use it as your pre-trade checklist & execution model.
Originality & Credits
This script is an original creation by @PueblaATH, released under the MPL 2.0 license.
It does not copy, modify, or repackage any existing TradingView code.
All logic—including the fee engine, margin calculator, responsive HUD, dynamic risk model, and visual execution system—is authored specifically for this indicator.

Position Sizing Calculator (Real-Time) - Futures Edition█ SUMMARY
The following indicator is a Position Sizing Calculator based on Average True Range (ATR), originally developed by market technician J. Welles Wilder Jr., intended for real-time trading.
This script utilizes the user's account size, acceptable risk percentage, and a stop-loss distance based on ATR to dynamically calculate the appropriate position size for each trade in real time.
█ BACKGROUND
Developed for use on the Micro E-mini Nasdaq-100 futures (MNQ), this script provides traders with continuously updated dynamic position sizes. It enables traders to instantly determine the exact number of contracts to use when entering a trade while staying within their acceptable risk tolerance.
This real-time position sizing tool helps traders make well-informed decisions when planning trade entries and calculating maximum stop-loss levels, ultimately enhancing risk management.
█ USER INPUTS
Trading Account Size: Total dollar value of the user's trading account.
Acceptable Risk (%): Maximum percentage of the trading account that the user is willing to risk per trade.
ATR Multiplier for Stop-Loss: Multiplier used to determine the distance of the stop-loss from the current price, based on the ATR value.
ATR Length: The length of the lookback period used to calculate the ATR value.
Show Target Risk Row: Toggle to hide/show the Target Risk Row
SL Levels Display: Option to see Both, Long Only, Short Only, or None of the Stop Loss Level Values.
Contract Point Value ($): Point value per contract. Tooltip highlights common values.
Tick Size: Minimum Price Movement (Default set to 0.25)
Minimum Contracts: Override the Minimum Contracts per trade to a user selected value.
(May Exceed User's Target Risk)

XRP CrossChain Momentum EngineThis is a strategy with stop loss 3% , leverage 4 and no pyramiding. It works great with XRP and other coins with similar price, but i suggest XRP. Profit in 1 year around 900% and profit in 2 years around 2000% as you can see in the pictures. I have initial capital 1000 but it can change.

ATR Risk Display - Multi FuturesWhat This Does
I got tired of manually calculating my ATR stops and risk for different futures contracts, especially when switching between ES, NQ, and their micro versions. This indicator automatically detects what futures symbol you're trading and shows you the exact tick count and dollar risk for your stop loss.
The Problem It Solves
If you trade futures with ATR-based stops, you know the hassle:
Different contracts have different tick values
You need to calculate position risk in dollars
Switching between symbols means redoing all the math
Renko charts make it even more confusing since ATR needs to come from regular candles
This handles all of that automatically.
Key Features
Auto-detects futures symbols - ES, NQ, YM, RTY, GC, CL, and all the micros (MES, MNQ, etc.)
Shows everything you need in one line: ATR(timeframe) × multiplier = X ticks ($XXX)
Works on Renko charts - pulls ATR from regular timeframe charts (super important if you use Renko)
Adjustable position sizing - set your contract count and see total risk instantly
Clean, minimal display - just the info you need, no clutter
How to Use
Add it to any futures chart
Set your preferred ATR timeframe (I use 5-minute)
Set your ATR multiplier (I use 1.5x for my stops)
Set your contract size
That's it - the indicator handles the rest
The display will show something like: "ES ATR(5) × 1.5 = 12 ticks ($150)"
Settings Explained
ATR Timeframe: What timeframe to calculate ATR from (always uses regular candles, even on Renko)
ATR Multiplier: How many ATRs for your stop (1.5 is common, 2.0 for wider stops)
Number of Contracts: Your position size for risk calculation
Auto-Detect Symbol: Leave on unless you want to manually override
Supported Futures
Full size: ES, NQ, YM, RTY, GC, CL, ZB, ZN, 6E, 6J
Micros: MES, MNQ, MYM, M2K, MGC, MCL
Notes
Made this primarily for my own ES trading but figured others might find it useful
The tick values are based on standard CME specs
If you trade other futures, you can modify the code to add them
Works great alongside level indicators for risk management
Why This Exists
I use ATR trailing stops on all my trades and got tired of doing mental math every time I switched between charts or contracts. Especially useful if you trade both full-size and micro contracts - the risk difference is huge and easy to mess up.
Hope this helps your trading! Feel free to suggest improvements.

Key Zones & Levels - IntradayThis indicator provides key zones and levels for the day.
The levels are constant for the day and no re-painting.
The levels are plotted at 9:15pm IST for Indian stock market trading.
Use these levels with RSI for a perfect reversal setup with small stop loss.
Work perfectly for all types of market - Indices, stocks, commodity, futures.
Join my channel to support me - whatsapp.com
Exponential Moving Average + ATR MTF [YSFX]Description:
This indicator is a reupload of a previously published EMA + ATR tool, updated and enhanced after a house rule violation to provide additional features and a cleaner, more versatile experience for traders.
It combines trend analysis and volatility measurement into one intuitive tool, allowing traders to visualize market direction, dynamic support and resistance, and adaptive risk levels—all in a clean, minimal interface.
The indicator calculates a customizable moving average (MA) type—EMA, SMA, WMA, HMA, RMA, DEMA, TEMA, VWMA, LSMA, or KAMA—and surrounds it with ATR-based bands that expand and contract with market volatility. This creates a dynamic envelope around price, helping traders identify potential breakouts, pullbacks, or high-probability entry/exit zones.
Advanced Features:
Multiple MA types: Supports all major moving averages, including advanced options like KAMA, DEMA, and TEMA.
KAMA customization: Adjustable fast and slow lengths for precise tuning.
Dual timeframe support: Optionally use separate timeframes for the MA and ATR, or a global timeframe for both.
Dynamic ATR bands: Automatically adjust to market volatility, useful for setting adaptive stop-loss levels.
Optional fill: Shade the area between upper and lower ATR bands for a clear visual representation of volatility.
Flexible for all markets: Works across any timeframe or asset class.
Who It’s For:
This indicator is ideal for trend-following traders, swing traders, and volatility-focused analysts who want to:
Confirm trend direction while accounting for volatility
Identify high-probability trade entries and exits
Implement dynamic, ATR-based stop-loss strategies
Keep charts clean and uncluttered while still capturing key market information
This reuploaded version ensures compliance with platform rules while offering enhanced flexibility and clarity for modern trading workflows.

RSI EMA Crossover with Price ActionThe RSI and RSI's EMA Crossover with Price Action (1:2 Risk-Reward) strategy combines Momentum, Trend confirmation, and Basic price-action logic to generate high-probability trade setups with Proper Risk Management.
This script identifies entries when the RSI crosses a key threshold and aligns with an RSI - EMA crossover, confirming Exhaustion of a current trend and Price action confirms the Change in Trend direction. It integrates price action filters to avoid false signals during low-volatility or choppy conditions.
The strategy also includes a risk-management module, setting a fixed 1:2 risk-to-reward ratio — automatically placing a take-profit target twice the size of the stop loss. Also the Stop loss can be adjusted to nearest swing low or last 3 candles Low. to avoid Stoploss hunt.
Features
✅ RSI and EMA crossover confirmation for directional bias
✅ Basic price-action validation (optional filters)
✅ Configurable stop-loss and take-profit levels (default 1:2)
✅ Visual trade markers for entries and exits
Disclaimer: This script is intended for educational and research purposes only. It should not be considered financial advice or a guaranteed trading system. Users are encouraged to test and optimize parameters before using in live markets.
ATR SL/TP Precision Zones (Dots)ATR SL/TP Precision Zones (Dots) is a volatility-based tool designed to help traders set accurate Stop Loss and Take Profit levels based on real market volatility — not fixed pips or emotion.
This indicator uses ATR (Average True Range) multiplied by 1.2 to calculate dynamic distance bands.
Instead of drawing a ribbon or channel, it places simple dots above and below each candle:
Upper Dot (Green) → Suggested Take Profit / Price Stretch Zone
Lower Dot (Red) → Suggested Stop Loss Cushion / Support Expansion Zone
Because ATR measures market volatility, these dots expand during high volatility and tighten during slow markets, helping traders avoid stop-loss hunts and premature exits.
Why This Works
Most traders lose because:
They set SL too close → stopped out by noise
They set TP too far → price never reaches it
This tool calibrates those distances automatically based on real price movement behavior.
ATR = volatility
Volatility = market breathing room
This indicator ensures your trade has room to breathe, increasing win consistency.
Best Use Cases
Scalping
Swing trading
Trend continuation entries
Reversal confirmations with support/resistance
Works on Crypto / Forex / Stocks / Futures

ATR Trailing Stop with Entry Date & First-Day MultiplierATR based trailing stop based on a X post of Aksel Kibar.

[Kpt-Ahab] Assistant: Risk & DCA PlannerScript Description – Assistant: Risk & DCA Planner
The Risk & DCA Planner is a technical assistant for position and risk management.
It automatically calculates, based on volatility (ATR%), swing structure, and your settings:
Stop-Loss (SL) and corresponding Take-Profit targets (TPs) in R-multiples
DCA (Dollar-Cost-Averaging) levels — both price and amount
A market suitability check (based on volatility & volume)
Plus a clear table and summary label displayed on the chart
The script helps you plan risk, scaling, and profit targets consistently and quantitatively.
Core Logic
Risk Profile
Three modes: Low, Normal, High.
These define how reactive the script behaves internally:
Low → conservative, longer lookbacks, tighter analysis
Normal → balanced
High → aggressive, faster reaction, wider stops
Stop-Loss (SL)
Automatically calculated from ATR% and recent swing structure, limited by minimum and maximum thresholds.
The SL percentage defines the R-unit, which all TPs and DCA levels are based on.
Take-Profits (TPs)
Up to six targets, each a multiple of the defined risk (e.g., 1R, 2R, 3R).
Prices are automatically adjusted depending on long or short direction.
DCA Strategy
Optional. Adds scaling levels evenly between Entry and SL or in multiples of the ATR.
Each DCA allocation grows geometrically until the maximum position size is reached.
Suitability Check
Evaluates whether the market is within an appropriate ATR% range and has sufficient volume.
The table displays “OK” or “Caution” depending on volatility and historical consistency.
Visualization
Lines for SL, TPs, and DCA levels
A table with all parameters, prices, and risk data
A chart label summarizing key info (profile, direction, SL%, TPs, DCA, etc.)

Risk ModuleThis indicator provides a visual reference for position sizing and approximate stop and target placement. It supports trade planning by calculating equalized risk per trade and maintaining consistent exposure across different markets.
For more information about the concept, see the post Position Sizing and Risk Management .
Fixed Fractional Risk
The indicator calculates the number of shares that can be traded to maintain consistent monetary risk. The formula is based on the distance between the current price and stop reference, adjusting position size proportionally. A closer stop results in a larger position size, while a wider stop results in a smaller one.
Position Size = (Account Size × Risk %) ÷ (Entry Price – Stop Price)
Stop and Target
Stop placement is derived from volatility using the Average True Range (ATR). The target is plotted as a multiple of the stop distance, defining the risk-to-reward relationship in R units.
Stop = Price ± ATR × Multiplier
Target = Price ± (R × Risk Distance)
Chart Elements
The stop and target levels are plotted above and below the current price, with the stop marked by a red dot and the target by a green dot. The information table displayed on the chart shows the number of shares to trade, stop level, and target level.
Setup and Configuration
This configuration only needs to be set once, but can be adjusted later if preferred.
1. Start by setting the account size and risk percentage per trade to define the monetary amount risked on each trade. These values form the basis for position size calculation.
2. Set the ATR multiplier to determine stop distance, common values range between 1 and 3 ATR. Lower values place stops closer to price, increasing sensitivity but risking short-term noise. Higher values widen the stop, which reduces noise impact but extends time in risk.
3. Set the R-multiple to determine target distance relative to the stop. A value of 1 represents a 1:1 risk-to-reward relationship. Lower values reduce potential reward but tend to increase win rate, whereas higher values increase potential reward but tend to reduce win rate. The selection depends on system characteristics and trade expectancy.
When the parameters are defined, the indicator displays the stop, target, and calculated position size on the chart. All that remains is to enter the trade with the number of shares shown in the table and place bracket orders at the plotted stop and target levels.
Settings Overview
Account Size / Risk %: Defines account capital and per-trade exposure.
ATR Multiplier: Adjusts stop distance relative to volatility.
R Multiple: Sets target distance relative to stop (risk-reward ratio).
Position: Choose Long or Short direction.
Table Position: Controls information table placement and scale.

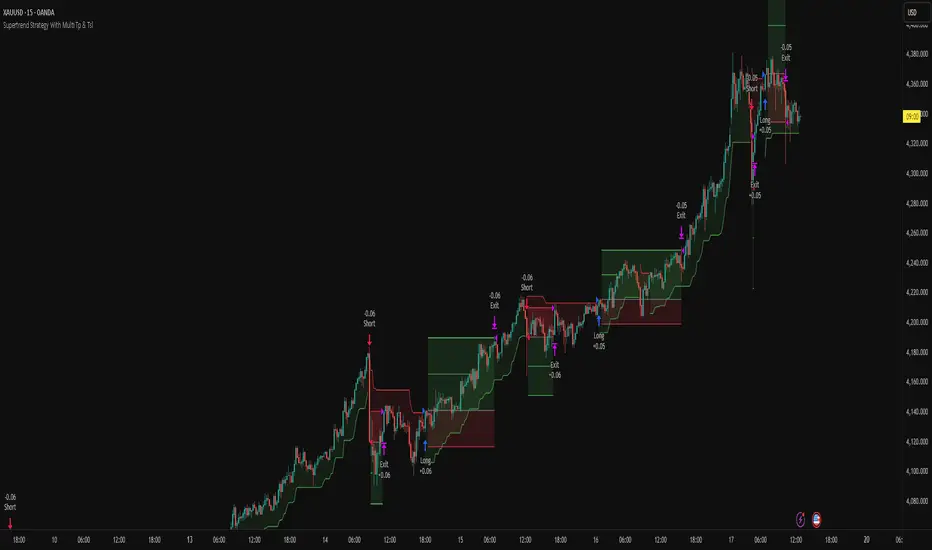
Supertrend Strategy With Multi Tp & TslHello Traders,
This strategy is based on the popular Supertrend indicator, which many traders use as a simple trend-following tool. The core entry logic is straightforward:
Buy (Long) when the price closes above the Supertrend line.
Sell (Short) when the price closes below the Supertrend line.
However, trading success isn’t only about entries — proper risk management makes all the difference. That’s why this strategy includes four stop-loss methods, two take-profit types, and a trailing stop-loss system. You can customize all of these settings to create your own personalized version.
🛑 Stop-Loss Methods
Tick – Uses the instrument’s smallest price increment. Ideal for tick-based markets such as Futures or Forex.
Percent – Defines the stop-loss as a percentage of entry price. Commonly used in Crypto trading.
ATR – Uses the Average True Range value to determine stop-loss distance. Perfect for adapting to changing market volatility.
Supertrend – The stop-loss level is set at the Supertrend line value at the time of entry.
🔁 Trailing Stop-Loss & Reverse Signals
Trailing SL: If enabled, the chosen stop-loss method will trail the price dynamically from the moment the position opens.
Close with Reverse Signals: When activated, the current position closes and reverses on an opposite signal. If disabled, the strategy waits until the current position is closed before opening a new one.
🎯 Take-Profit Options
Tick – Set a fixed take-profit level based on tick distance.
Percent – Set take-profit based on a percentage change from entry.
Ratio – Sets take-profit based on the entry-to-stop-loss distance × ratio value.
Each take-profit method allows you to define the percentage of position to close at that level.
⚖️ Breakeven Option
When Breakeven is enabled, after the first take-profit is triggered, the stop-loss automatically moves to the entry level, protecting your capital.
⚙️ Additional Settings
Position Type: Choose between Long only, Short only, or Both directions.
Session Filter: Trade only during specific time ranges. Activate this option and set your desired session hours (make sure to select your correct timezone).
📈 Visuals
The strategy plots entry, stop-loss, and take-profit levels directly on the chart, allowing you to clearly visualize your trades and manage them effectively.
Feel free to ask any questions or suggest improvements — this strategy is built for flexibility and experimentation!
RPT Position Sizer🎯 Purpose
This indicator is a position sizing and stop-loss calculator designed to help traders instantly determine:
How many shares/contracts to buy,
How much risk (₹) they are taking per trade,
How much capital will be deployed, and
The precise stop-loss price level based on user-defined parameters.
It displays all key values in a compact on-chart table (bottom-left corner) for quick trade planning.
💡 Use Case
Perfect for discretionary swing traders, systematic position traders, and risk managers who want instant visual feedback of trade sizing metrics directly on the chart — eliminating manual calculations and improving discipline.
⚙️ Key Features
Dynamic Inputs
Trading Capital (₹) — total available capital for trading.
RPT % — risk-per-trade as a percentage of total capital.
SL % — stop-loss distance in percent below CMP (Current Market Price).
CMP Source — can be linked to close, hl2, etc.
Rounding Style — round position size to Nearest, Floor, or Ceil.
Decimals Show — control number formatting precision in the table.
Core Calculations
SL Points: CMP × SL%
SL Price: CMP − SL Points
Risk Amount (₹): Capital × RPT%
Position Size: Risk ÷ SL Points
Capital Used: Position Size × CMP
Clean On-Chart Table Display
Displays:
Trading Capital
RPT %
Risk Amount (₹)
Position Size (shares/contracts)
Capital Required (₹)
Stop-Loss % & SL Price
The table uses a minimalistic white-on-black design with clear labeling and rupee formatting for quick reference.
Data Window Integration
Plots hidden values (Position Size, Risk Amount, SL Points, Capital Used) for use in TradingView’s Data Window—ideal for strategy testing and exporting values.

Luxy Momentum, Trend, Bias and Breakout Indicators V7
TABLE OF CONTENTS
This is Version 7 (V7) - the latest and most optimized release. If you are using any older versions (V6, V5, V4, V3, etc.), it is highly recommended to replace them with V7.
Why This Indicator is Different
Who Should Use This
Core Components Overview
The UT Bot Trading System
Understanding the Market Bias Table
Candlestick Pattern Recognition
Visual Tools and Features
How to Use the Indicator
Performance and Optimization
FAQ
---
### CREDITS & ATTRIBUTION
This indicator implements proven trading concepts using entirely original code developed specifically for this project.
### CONCEPTUAL FOUNDATIONS
• UT Bot ATR Trailing System
- Original concept by @QuantNomad: (search "UT-Bot-Strategy"
- Our version is a complete reimplementation with significant enhancements:
- Volume-weighted momentum adjustment
- Composite stop loss from multiple S/R layers
- Multi-filter confirmation system (swing, %, 2-bar, ZLSMA)
- Full integration with multi-timeframe bias table
- Visual audit trail with freeze-on-touch
- NOTE: No code was copied - this is a complete reimplementation with enhancements.
• Standard Technical Indicators (Public Domain Formulas):
- Supertrend: ATR-based trend calculation with custom gradient fills
- MACD: Gerald Appel's formula with separation filters
- RSI: J. Welles Wilder's formula with pullback zone logic
- ADX/DMI: Custom trend strength formula inspired by Wilder's directional movement concept, reimplemented with volume weighting and efficiency metrics
- ZLSMA: Zero-lag formula enhanced with Hull MA and momentum prediction
### Custom Implementations
- Trend Strength: Inspired by Wilder's ADX concept but using volume-weighted pressure calculation and efficiency metrics (not traditional +DI/-DI smoothing)
- All code implementations are original
### ORIGINAL FEATURES (70%+ of codebase)
- Multi-Timeframe Bias Table with live updates
- Risk Management System (R-multiple TPs, freeze-on-touch)
- Opening Range Breakout tracker with session management
- Composite Stop Loss calculator using 6+ S/R layers
- Performance optimization system (caching, conditional calcs)
- VIX Fear Index integration
- Previous Day High/Low auto-detection
- Candlestick pattern recognition with interactive tooltips
- Smart label and visual management
- All UI/UX design and table architecture
### DEVELOPMENT PROCESS
**AI Assistance:** This indicator was developed over 2+ months with AI assistance (ChatGPT/Claude) used for:
- Writing Pine Script code based on design specifications
- Optimizing performance and fixing bugs
- Ensuring Pine Script v6 compliance
- Generating documentation
**Author's Role:** All trading concepts, system design, feature selection, integration logic, and strategic decisions are original work by the author. The AI was a coding tool, not the system designer.
**Transparency:** We believe in full disclosure - this project demonstrates how AI can be used as a powerful development tool while maintaining creative and strategic ownership.
---
1. WHY THIS INDICATOR IS DIFFERENT
Most traders use multiple separate indicators on their charts, leading to cluttered screens, conflicting signals, and analysis paralysis. The Suite solves this by integrating proven technical tools into a single, cohesive system.
Key Advantages:
All-in-One Design: Instead of loading 5-10 separate indicators, you get everything in one optimized script. This reduces chart clutter and improves TradingView performance.
Multi-Timeframe Bias Table: Unlike standard indicators that only show the current timeframe, the Bias Table aggregates trend signals across multiple timeframes simultaneously. See at a glance whether 1m, 5m, 15m, 1h are aligned bullish or bearish - no more switching between charts.
Smart Confirmations: The indicator doesn't just give signals - it shows you WHY. Every entry has multiple layers of confirmation (MA cross, MACD momentum, ADX strength, RSI pullback, volume, etc.) that you can toggle on/off.
Dynamic Stop Loss System: Instead of static ATR stops, the SL is calculated from multiple support/resistance layers: UT trailing line, Supertrend, VWAP, swing structure, and MA levels. This creates more intelligent, price-action-aware stops.
R-Multiple Take Profits: Built-in TP system calculates targets based on your initial risk (1R, 1.5R, 2R, 3R). Lines freeze when touched with visual checkmarks, giving you a clean audit trail of partial exits.
Educational Tooltips Everywhere: Every single input has detailed tooltips explaining what it does, typical values, and how it impacts trading. You're not guessing - you're learning as you configure.
Performance Optimized: Smart caching, conditional calculations, and modular design mean the indicator runs fast despite having 15+ features. Turn off what you don't use for even better performance.
No Repainting: All signals respect bar close. Alerts fire correctly. What you see in history is what you would have gotten in real-time.
What Makes It Unique:
Integrated UT Bot + Bias Table: No other indicator combines UT Bot's ATR trailing system with a live multi-timeframe dashboard. You get precision entries with macro trend context.
Candlestick Pattern Recognition with Interactive Tooltips: Patterns aren't just marked - hover over any emoji for a full explanation of what the pattern means and how to trade it.
Opening Range Breakout Tracker: Built-in ORB system for intraday traders with customizable session times and real-time status updates in the Bias Table.
Previous Day High/Low Auto-Detection: Automatically plots PDH/PDL on intraday charts with theme-aware colors. Updates daily without manual input.
Dynamic Row Labels in Bias Table: The table shows your actual settings (e.g., "EMA 10 > SMA 20") not generic labels. You know exactly what's being evaluated.
Modular Filter System: Instead of forcing a fixed methodology, the indicator lets you build your own strategy. Start with just UT Bot, add filters one at a time, test what works for your style.
---
2. WHO WHOULD USE THIS
Designed For:
Intermediate to Advanced Traders: You understand basic technical analysis (MAs, RSI, MACD) and want to combine multiple confirmations efficiently. This isn't a "one-click profit" system - it's a professional toolkit.
Multi-Timeframe Traders: If you trade one asset but check multiple timeframes for confirmation (e.g., enter on 5m after checking 15m and 1h alignment), the Bias Table will save you hours every week.
Trend Followers: The indicator excels at identifying and following trends using UT Bot, Supertrend, and MA systems. If you trade breakouts and pullbacks in trending markets, this is built for you.
Intraday and Swing Traders: Works equally well on 5m-1h charts (day trading) and 4h-D charts (swing trading). Scalpers can use it too with appropriate settings adjustments.
Discretionary Traders: This isn't a black-box system. You see all the components, understand the logic, and make final decisions. Perfect for traders who want tools, not automation.
Works Across All Markets:
Stocks (US, international)
Cryptocurrency (24/7 markets supported)
Forex pairs
Indices (SPY, QQQ, etc.)
Commodities
NOT Ideal For :
Complete Beginners: If you don't know what a moving average or RSI is, start with basics first. This indicator assumes foundational knowledge.
Algo Traders Seeking Black Box: This is discretionary. Signals require context and confirmation. Not suitable for blind automated execution.
Mean-Reversion Only Traders: The indicator is trend-following at its core. While VWAP bands support mean-reversion, the primary methodology is trend continuation.
---
3. CORE COMPONENTS OVERVIEW
The indicator combines these proven systems:
Trend Analysis:
Moving Averages: Four customizable MAs (Fast, Medium, Medium-Long, Long) with six types to choose from (EMA, SMA, WMA, VWMA, RMA, HMA). Mix and match for your style.
Supertrend: ATR-based trend indicator with unique gradient fill showing trend strength. One-sided ribbon visualization makes it easier to see momentum building or fading.
ZLSMA : Zero-lag linear-regression smoothed moving average. Reduces lag compared to traditional MAs while maintaining smooth curves.
Momentum & Filters:
MACD: Standard MACD with separation filter to avoid weak crossovers.
RSI: Pullback zone detection - only enter longs when RSI is in your defined "buy zone" and shorts in "sell zone".
ADX/DMI: Trend strength measurement with directional filter. Ensures you only trade when there's actual momentum.
Volume Filter: Relative volume confirmation - require above-average volume for entries.
Donchian Breakout: Optional channel breakout requirement.
Signal Systems:
UT Bot: The primary signal generator. ATR trailing stop that adapts to volatility and gives clear entry/exit points.
Base Signals: MA cross system with all the above filters applied. More conservative than UT Bot alone.
Market Bias Table: Multi-timeframe dashboard showing trend alignment across 7 timeframes plus macro bias (3-day, weekly, monthly, quarterly, VIX).
Candlestick Patterns: Six major reversal patterns auto-detected with interactive tooltips.
ORB Tracker: Opening range high/low with breakout status (intraday only).
PDH/PDL: Previous day levels plotted automatically on intraday charts.
VWAP + Bands : Session-anchored VWAP with up to three standard deviation band pairs.
---
4. THE UT BOT TRADING SYSTEM
The UT Bot is the heart of the indicator's signal generation. It's an advanced ATR trailing stop that adapts to market volatility.
Why UT Bot is Superior to Fixed Stops:
Traditional ATR stops use a fixed multiplier (e.g., "stop = entry - 2×ATR"). UT Bot is smarter:
It TRAILS the stop as price moves in your favor
It WIDENS during high volatility to avoid premature stops
It TIGHTENS during consolidation to lock in profits
It FLIPS when price breaks the trailing line, signaling reversals
Visual Elements You'll See:
Orange Trailing Line: The actual UT stop level that adapts bar-by-bar
Buy/Sell Labels: Aqua triangle (long) or orange triangle (short) when the line flips
ENTRY Line: Horizontal line at your entry price (optional, can be turned off)
Suggested Stop Loss: A composite SL calculated from multiple support/resistance layers:
- UT trailing line
- Supertrend level
- VWAP
- Swing structure (recent lows/highs)
- Long-term MA (200)
- ATR-based floor
Take Profit Lines: TP1, TP1.5, TP2, TP3 based on R-multiples. When price touches a TP, it's marked with a checkmark and the line freezes for audit trail purposes.
Status Messages: "SL Touched ❌" or "SL Frozen" when the trade leg completes.
How UT Bot Differs from Other ATR Systems:
Multiple Filters Available: You can require 2-bar confirmation, minimum % price change, swing structure alignment, or ZLSMA directional filter. Most UT implementations have none of these.
Smart SL Calculation: Instead of just using the UT line as your stop, the indicator suggests a better SL based on actual support/resistance. This prevents getting stopped out by wicks while keeping risk controlled.
Visual Audit Trail: All SL/TP lines freeze when touched with clear markers. You can review your trades weeks later and see exactly where entries, stops, and targets were.
Performance Options: "Draw UT visuals only on bar close" lets you reduce rendering load without affecting logic or alerts - critical for slower machines or 1m charts.
Trading Logic:
UT Bot flips direction (Buy or Sell signal appears)
Check Bias Table for multi-timeframe confirmation
Optional: Wait for Base signal or candlestick pattern
Enter at signal bar close or next bar open
Place stop at "Suggested Stop Loss" line
Scale out at TP levels (TP1, TP2, TP3)
Exit remaining position on opposite UT signal or stop hit
---
5. UNDERSTANDING THE MARKET BIAS TABLE
This is the indicator's unique multi-timeframe intelligence layer. Instead of looking at one chart at a time, the table aggregates signals across seven timeframes plus macro trend bias.
Why Multi-Timeframe Analysis Matters:
Professional traders check higher and lower timeframes for context:
Is the 1h uptrend aligning with my 5m entry?
Are all short-term timeframes bullish or just one?
Is the daily trend supportive or fighting me?
Doing this manually means opening multiple charts, checking each indicator, and making mental notes. The Bias Table does it automatically in one glance.
Table Structure:
Header Row:
On intraday charts: 1m, 5m, 15m, 30m, 1h, 2h, 4h (toggle which ones you want)
On daily+ charts: D, W, M (automatic)
Green dot next to title = live updating
Headline Rows - Macro Bias:
These show broad market direction over longer periods:
3 Day Bias: Trend over last 3 trading sessions (uses 1h data)
Weekly Bias: Trend over last 5 trading sessions (uses 4h data)
Monthly Bias: Trend over last 30 daily bars
Quarterly Bias: Trend over last 13 weekly bars
VIX Fear Index: Market regime based on VIX level - bullish when low, bearish when high
Opening Range Breakout: Status of price vs. session open range (intraday only)
These rows show text: "BULLISH", "BEARISH", or "NEUTRAL"
Indicator Rows - Technical Signals:
These evaluate your configured indicators across all active timeframes:
Fast MA > Medium MA (shows your actual MA settings, e.g., "EMA 10 > SMA 20")
Price > Long MA (e.g., "Price > SMA 200")
Price > VWAP
MACD > Signal
Supertrend (up/down/neutral)
ZLSMA Rising
RSI In Zone
ADX ≥ Minimum
These rows show emojis: GREEB (bullish), RED (bearish), GRAY/YELLOW (neutral/NA)
AVG Column:
Shows percentage of active timeframes that are bullish for that row. This is the KEY metric:
AVG > 70% = strong multi-timeframe bullish alignment
AVG 40-60% = mixed/choppy, no clear trend
AVG < 30% = strong multi-timeframe bearish alignment
How to Use the Table:
For a long trade:
Check AVG column - want to see > 60% ideally
Check headline bias rows - want to see BULLISH, not BEARISH
Check VIX row - bullish market regime preferred
Check ORB row (intraday) - want ABOVE for longs
Scan indicator rows - more green = better confirmation
For a short trade:
Check AVG column - want to see < 40% ideally
Check headline bias rows - want to see BEARISH, not BULLISH
Check VIX row - bearish market regime preferred
Check ORB row (intraday) - want BELOW for shorts
Scan indicator rows - more red = better confirmation
When AVG is 40-60%:
Market is choppy, mixed signals. Either stay out or reduce position size significantly. These are low-probability environments.
Unique Features:
Dynamic Labels: Row names show your actual settings (e.g., "EMA 10 > SMA 20" not generic "Fast > Slow"). You know exactly what's being evaluated.
Customizable Rows: Turn off rows you don't care about. Only show what matters to your strategy.
Customizable Timeframes: On intraday charts, disable 1m or 4h if you don't trade them. Reduces calculation load by 20-40%.
Automatic HTF Handling: On Daily/Weekly/Monthly charts, the table automatically switches to D/W/M columns. No configuration needed.
Performance Smart: "Hide BIAS table on 1D or above" option completely skips all table calculations on higher timeframes if you only trade intraday.
---
6. CANDLESTICK PATTERN RECOGNITION
The indicator automatically detects six major reversal patterns and marks them with emojis at the relevant bars.
Why These Six Patterns:
These are the most statistically significant reversal patterns according to trading literature:
High win rate when appearing at support/resistance
Clear visual structure (not subjective)
Work across all timeframes and assets
Studied extensively by institutions
The Patterns:
Bullish Patterns (appear at bottoms):
Bullish Engulfing: Green candle completely engulfs prior red candle's body. Strong reversal signal.
Hammer: Small body with long lower wick (at least 2× body size). Shows rejection of lower prices by buyers.
Morning Star: Three-candle pattern (large red → small indecision → large green). Very strong bottom reversal.
Bearish Patterns (appear at tops):
Bearish Engulfing: Red candle completely engulfs prior green candle's body. Strong reversal signal.
Shooting Star: Small body with long upper wick (at least 2× body size). Shows rejection of higher prices by sellers.
Evening Star: Three-candle pattern (large green → small indecision → large red). Very strong top reversal.
Interactive Tooltips:
Unlike most pattern indicators that just draw shapes, this one is educational:
Hover your mouse over any pattern emoji
A tooltip appears explaining: what the pattern is, what it means, when it's most reliable, and how to trade it
No need to memorize - learn as you trade
Noise Filter:
"Min candle body % to filter noise" setting prevents false signals:
Patterns require minimum body size relative to price
Filters out tiny candles that don't represent real buying/selling pressure
Adjust based on asset volatility (higher % for crypto, lower for low-volatility stocks)
How to Trade Patterns:
Patterns are NOT standalone entry signals. Use them as:
Confirmation: UT Bot gives signal + pattern appears = stronger entry
Reversal Warning: In a trade, opposite pattern appears = consider tightening stop or taking profit
Support/Resistance Validation: Pattern at key level (PDH, VWAP, MA 200) = level is being respected
Best combined with:
UT Bot or Base signal in same direction
Bias Table alignment (AVG > 60% or < 40%)
Appearance at obvious support/resistance
---
7. VISUAL TOOLS AND FEATURES
VWAP (Volume Weighted Average Price):
Session-anchored VWAP with standard deviation bands. Shows institutional "fair value" for the trading session.
Anchor Options: Session, Day, Week, Month, Quarter, Year. Choose based on your trading timeframe.
Bands: Up to three pairs (X1, X2, X3) showing statistical deviation. Price at outer bands often reverses.
Auto-Hide on HTF: VWAP hides on Daily/Weekly/Monthly charts automatically unless you enable anchored mode.
Use VWAP as:
Directional bias (above = bullish, below = bearish)
Mean reversion levels (outer bands)
Support/resistance (the VWAP line itself)
Previous Day High/Low:
Automatically plots yesterday's high and low on intraday charts:
Updates at start of each new trading day
Theme-aware colors (dark text for light charts, light text for dark charts)
Hidden automatically on Daily/Weekly/Monthly charts
These levels are critical for intraday traders - institutions watch them closely as support/resistance.
Opening Range Breakout (ORB):
Tracks the high/low of the first 5, 15, 30, or 60 minutes of the trading session:
Customizable session times (preset for NYSE, LSE, TSE, or custom)
Shows current breakout status in Bias Table row (ABOVE, BELOW, INSIDE, BUILDING)
Intraday only - auto-disabled on Daily+ charts
ORB is a classic day trading strategy - breakout above opening range often leads to continuation.
Extra Labels:
Change from Open %: Shows how far price has moved from session open (intraday) or daily open (HTF). Green if positive, red if negative.
ADX Badge: Small label at bottom of last bar showing current ADX value. Green when above your minimum threshold, red when below.
RSI Badge: Small label at top of last bar showing current RSI value with zone status (buy zone, sell zone, or neutral).
These labels provide quick at-a-glance confirmation without needing separate indicator windows.
---
8. HOW TO USE THE INDICATOR
Step 1: Add to Chart
Load the indicator on your chosen asset and timeframe
First time: Everything is enabled by default - the chart will look busy
Don't panic - you'll turn off what you don't need
Step 2: Start Simple
Turn OFF everything except:
UT Bot labels (keep these ON)
Bias Table (keep this ON)
Moving Averages (Fast and Medium only)
Suggested Stop Loss and Take Profits
Hide everything else initially. Get comfortable with the basic UT Bot + Bias Table workflow first.
Step 3: Learn the Core Workflow
UT Bot gives a Buy or Sell signal
Check Bias Table AVG column - do you have multi-timeframe alignment?
If yes, enter the trade
Place stop at Suggested Stop Loss line
Scale out at TP levels
Exit on opposite UT signal
Trade this simple system for a week. Get a feel for signal frequency and win rate with your settings.
Step 4: Add Filters Gradually
If you're getting too many losing signals (whipsaws in choppy markets), add filters one at a time:
Try: "Require 2-Bar Trend Confirmation" - wait for 2 bars to confirm direction
Try: ADX filter with minimum threshold - only trade when trend strength is sufficient
Try: RSI pullback filter - only enter on pullbacks, not chasing
Try: Volume filter - require above-average volume
Add one filter, test for a week, evaluate. Repeat.
Step 5: Enable Advanced Features (Optional)
Once you're profitable with the core system, add:
Supertrend for additional trend confirmation
Candlestick patterns for reversal warnings
VWAP for institutional anchor reference
ORB for intraday breakout context
ZLSMA for low-lag trend following
Step 6: Optimize Settings
Every setting has a detailed tooltip explaining what it does and typical values. Hover over any input to read:
What the parameter controls
How it impacts trading
Suggested ranges for scalping, day trading, and swing trading
Start with defaults, then adjust based on your results and style.
Step 7: Set Up Alerts
Right-click chart → Add Alert → Condition: "Luxy Momentum v6" → Choose:
"UT Bot — Buy" for long entries
"UT Bot — Sell" for short entries
"Base Long/Short" for filtered MA cross signals
Optionally enable "Send real-time alert() on UT flip" in settings for immediate notifications.
Common Workflow Variations:
Conservative Trader:
UT signal + Base signal + Candlestick pattern + Bias AVG > 70%
Enter only at major support/resistance
Wider UT sensitivity, multiple filters
Aggressive Trader:
UT signal + Bias AVG > 60%
Enter immediately, no waiting
Tighter UT sensitivity, minimal filters
Swing Trader:
Focus on Daily/Weekly Bias alignment
Ignore intraday noise
Use ORB and PDH/PDL less (or not at all)
Wider stops, patient approach
---
9. PERFORMANCE AND OPTIMIZATION
The indicator is optimized for speed, but with 15+ features running simultaneously, chart load time can add up. Here's how to keep it fast:
Biggest Performance Gains:
Disable Unused Timeframes: In "Time Frames" settings, turn OFF any timeframe you don't actively trade. Each disabled TF saves 10-15% calculation time. If you only day trade 5m, 15m, 1h, disable 1m, 2h, 4h.
Hide Bias Table on Daily+: If you only trade intraday, enable "Hide BIAS table on 1D or above". This skips ALL table calculations on higher timeframes.
Draw UT Visuals Only on Bar Close: Reduces intrabar rendering of SL/TP/Entry lines. Has ZERO impact on logic or alerts - purely visual optimization.
Additional Optimizations:
Turn off VWAP bands if you don't use them
Disable candlestick patterns if you don't trade them
Turn off Supertrend fill if you find it distracting (keep the line)
Reduce "Limit to 10 bars" for SL/TP lines to minimize line objects
Performance Features Built-In:
Smart Caching: Higher timeframe data (3-day bias, weekly bias, etc.) updates once per day, not every bar
Conditional Calculations: Volume filter only calculates when enabled. Swing filter only runs when enabled. Nothing computes if turned off.
Modular Design: Every component is independent. Turn off what you don't need without breaking other features.
Typical Load Times:
5m chart, all features ON, 7 timeframes: ~2-3 seconds
5m chart, core features only, 3 timeframes: ~1 second
1m chart, all features: ~4-5 seconds (many bars to calculate)
If loading takes longer, you likely have too many indicators on the chart total (not just this one).
---
10. FAQ
Q: How is this different from standard UT Bot indicators?
A: Standard UT Bot (originally by @QuantNomad) is just the ATR trailing line and flip signals. This implementation adds:
- Volume weighting and momentum adjustment to the trailing calculation
- Multiple confirmation filters (swing, %, 2-bar, ZLSMA)
- Smart composite stop loss system from multiple S/R layers
- R-multiple take profit system with freeze-on-touch
- Integration with multi-timeframe Bias Table
- Visual audit trail with checkmarks
Q: Can I use this for automated trading?
A: The indicator is designed for discretionary trading. While it has clear signals and alerts, it's not a mechanical system. Context and judgment are required.
Q: Does it repaint?
A: No. All signals respect bar close. UT Bot logic runs intrabar but signals only trigger on confirmed bars. Alerts fire correctly with no lookahead.
Q: Do I need to use all the features?
A: Absolutely not. The indicator is modular. Many profitable traders use just UT Bot + Bias Table + Moving Averages. Start simple, add complexity only if needed.
Q: How do I know which settings to use?
A: Every single input has a detailed tooltip. Hover over any setting to see:
What it does
How it affects trading
Typical values for scalping, day trading, swing trading
Start with defaults, adjust gradually based on results.
Q: Can I use this on crypto 24/7 markets?
A: Yes. ORB will not work (no defined session), but everything else functions normally. Use "Day" anchor for VWAP instead of "Session".
Q: The Bias Table is blank or not showing.
A: Check:
"Show Table" is ON
Table position isn't overlapping another indicator's table (change position)
At least one row is enabled
"Hide BIAS table on 1D or above" is OFF (if on Daily+ chart)
Q: Why are candlestick patterns not appearing?
A: Patterns are relatively rare by design - they only appear at genuine reversal points. Check:
Pattern toggles are ON
"Min candle body %" isn't too high (try 0.05-0.10)
You're looking at a chart with actual reversals (not strong trending market)
Q: UT Bot is too sensitive/not sensitive enough.
A: Adjust "Sensitivity (Key×ATR)". Lower number = tighter stop, more signals. Higher number = wider stop, fewer signals. Read the tooltip for guidance.
Q: Can I get alerts for the Bias Table?
A: The Bias Table is a dashboard for visual analysis, not a signal generator. Set alerts on UT Bot or Base signals, then manually check Bias Table for confirmation.
Q: Does this work on stocks with low volume?
A: Yes, but turn OFF the volume filter. Low volume stocks will never meet relative volume requirements.
Q: How often should I check the Bias Table?
A: Before every entry. It takes 2 seconds to glance at the AVG column and headline rows. This one check can save you from fighting the trend.
Q: What if UT signal and Base signal disagree?
A: UT Bot is more aggressive (ATR trailing). Base signals are more conservative (MA cross + filters). If they disagree, either:
Wait for both to align (safest)
Take the UT signal but with smaller size (aggressive)
Skip the trade (conservative)
There's no "right" answer - depends on your risk tolerance.
---
FINAL NOTES
The indicator gives you an edge. How you use that edge determines results.
For questions, feedback, or support, comment on the indicator page or message the author.
Happy Trading!

Advanced Chandelier Exit with S/R [Alpha Extract]Advanced Chandelier Exit with S/R is a precision-crafted trailing stop and market structure detection system that fuses advanced Chandelier Exit logic with intelligent, multi-timeframe support and resistance tracking. This indicator delivers adaptive trend detection, volatility-aware exit positioning, and real-time structural mapping in a clean, responsive format. By combining directional filtering, pivot zone detection, and customizable styling, Advanced Chandelier Exit with S/R is designed to give traders reliable context, strong risk management, and visually intuitive confirmation signals across all timeframes and asset classes.
🔶 Adaptive Trailing Stop Architecture
At the core of Advanced Chandelier Exit with S/R is a refined Chandelier Exit mechanism that dynamically calculates trailing stops based on recent highs and lows, ATR volatility, and trend sensitivity. The system features directional memory, anchoring the stop to maintain position until a confirmed trend break occurs. This method prevents premature flips and keeps the trade aligned with sustained momentum.
longStop := close > longStop ? math.max(longStop, longStop ) : longStop
shortStop := close < shortStop ? math.min(shortStop, shortStop ) : shortStop
🔶 Volatility-Weighted Filtering
To reduce noise and improve reaction quality, Advanced Chandelier Exit with S/R includes an optional volatility normalization filter. This system adjusts ATR output based on how elevated it is relative to its own average, effectively down-weighting erratic price moves while maintaining responsiveness in directional phases.
volatilityFilter = enableVolatilityFilter ? ta.sma(baseATR, length) / baseATR : 1.0
atr = mult * baseATR * sensitivity * volatilityFilter
🔶 Trend Strength-Aware State Transitions
Trend flips in Advanced Chandelier Exit with S/R are not based solely on price crossing the stop level. Instead, the system includes a momentum-derived trend strength filter that validates the legitimacy of directional shifts. This guards against weak reversals and gives stronger confidence in breakout moves.
priceChange = math.abs(close - close )
avgPriceChange = ta.sma(priceChange, length)
trendStrength = math.min(priceChange / avgPriceChange * 100, 200)
🔶 Multi-Timeframe Support & Resistance Zones
Advanced Chandelier Exit with S/R embeds a sophisticated pivot-based structure mapping engine that automatically identifies significant price reaction levels and tracks their validity over time. It filters redundant zones, removes invalidated levels, and renders real-time support and resistance overlays based on market structure.
if isUniqueLevel(ph, resistanceLevels)
array.unshift(resistanceLevels, ph)
if isUniqueLevel(pl, supportLevels)
array.unshift(supportLevels, pl)
🔶 Dynamic Visual Encoding
The indicator uses strength-scaled fills, customizable colors, and line styling to convey directional bias with clarity. Color opacity intensifies as trend strength increases, offering intuitive context at a glance. Dynamic background fills mark trend states, while S/R zones are rendered with user-defined transparency for clean integration.
🔶 Signal Detection and Alerts
Directional signals are generated upon confirmed flips between long and short regimes, validated by stop crosses and strength filters. Additionally, the indicator provides S/R breakout alerts, identifying when price breaks through a key structural level.
🔶 Performance and Customization Optimizations
Advanced Chandelier Exit with S/R is built with modularity and efficiency in mind. It supports full customization of stop logic, volatility sensitivity, structural lookback, S/R zone filtering, and visual display. The use of array-based data structures for S/R levels ensures consistent performance even across high-activity assets and longer lookback periods.
Advanced Chandelier Exit with S/R represents the next evolution in trailing stop and structure-aware trading tools. By blending the proven logic of the Chandelier Exit system with intelligent trend strength filters and robust S/R detection, it becomes more than just a stop indicator—it becomes a complete trade management companion. Traders benefit from fewer false flips, clearer directional bias, and precise structural overlays that reinforce both breakout and reversal strategies. Whether used for swing entries, intraday positioning, or zone-based re-entries, Advanced Chandelier Exit with S/R empowers traders with responsive, intelligent logic that adapts to market conditions without compromise.

EMA Dual with SL/TP ATR basedDouble EMA with cross and direction display.
Calculate stop loss / take profit based on ATR
If entering is not in the recognize direction also SL/TP is display (inversed values)
SL is 2xATR and TP is 4xAT by default - can be change
Also, SL/TP can be calculated at cross or at actual - see the table.

Apex Edge Sentinel - Stop Loss HUDApex Edge – ATR Sentinel Stop Loss HUD
The Apex Edge – ATR Sentinel is a complete stop-loss intelligence system built as a clean, always-on HUD.
It delivers institutional-level risk guidance by calculating and displaying live ATR-based stop levels for both long and short trades at multiple risk tolerances.
Forget cluttered charts and repainting lines — Sentinel gives you a clear stop-loss reference panel that updates dynamically with every bar.
✅ Features
• Triple ATR Multipliers
User-defined (e.g. x1.5 / x2.0 / x2.5). Compare tight, medium, and wide stops instantly.
• Dual-Side SL Levels
Both Long and Short safe stop prices displayed side by side. No more guessing trend
bias.
• ATR Transparency
HUD shows ATR(length) so you always know the calculation basis. Default = 14, adjustable
to your style.
• ATR Regime Meter
Detects volatility conditions (LOW / NORMAL / HIGH) by comparing ATR to its SMA. Helps
you avoid over-tight stops in high-volatility markets.
• Tick-Aware Rounding
Stop levels auto-rounded to the instrument’s tick size (Gold = 0.10, FX = 0.0001, indices =
whole points).
Custom HUD Design
• Location: Top/Bottom, Left/Right
• Sizes: Compact / Medium / Large (desktop or mobile)
• Opacity control (25% default Apex styling)
How to Use
1. Load Sentinel on your chart.
2. Check the HUD:
• ATR(14): 2.6 → base volatility measure.
• x1.5 / x2.0 / x2.5 → instant SL levels for both long & short trades.
3. Before entering a trade → decide which multiplier matches your style (tight scalper vs wider swing).
4. Manually place your SL at the level displayed in the HUD.
Sentinel works as both:
• A pre-trade check (is ATR stop too wide for my RR?).
• A live risk compass (updated stop levels every bar).
Why Apex Sentinel?
Most ATR stop indicators clutter charts with lagging lines or repainting trails. Sentinel strips it back to what matters:
• The numbers.
• The risk levels.
• The context.
It’s a pure stop-loss HUD, designed for serious traders who want clarity, discipline, and instant reference points across any market or timeframe.
Notes
• This is a HUD-only system (no automatic SL line). Traders manually apply the SL level
shown in the panel.
• Defaults: ATR(14), multipliers 1.5 / 2.0 / 2.5. Adjust to your trading style.
• Best used on intraday pairs like XAUUSD, EURUSD, indices, but works universally.
Apex Edge Philosophy: Clean. Smart. Institutional.
No clutter. No gimmicks. Just precision tools for modern markets.

Dynamic Stop Loss Optimizer [BackQuant]Dynamic Stop Loss Optimizer
Overview
Stop placement decides expectancy. This tool gives you three professional-grade, adaptive stop engines, ATR, Volatility, and Hybrid. So your exits scale with current conditions instead of guessing fixed ticks. It trails intelligently, redraws as the market evolves, and annotates the chart with clean labels/lines and a compact stats table. Pick the engine that fits the trade, or switch on the fly.
What it does
Calculates three adaptive stops in real time (ATR-based, Volatility-based, and Hybrid) and keeps them trailed as price makes progress.
Shows exactly where your risk lives with on-chart levels, color-coded markers (long/short), and precise “Risk %” labels at the current bar.
Surfaces context you actually use - current ATR, daily volatility, selected method, and the live stop level—in a tidy, movable table.
Fires alerts on stop hits so you can automate exits or journal outcomes without staring at the screen.
Why it matters
Adaptive risk control: Stops expand in fast tape and tighten in quiet tape. You’re not punished for volatility; you’re aligned with it.
Consistency across assets: The same playbook works whether you’re trading indexes, FX, crypto, or equities, because the engine normalizes to each symbol’s behavior.
Cleaner decision-making: One chart shows your entry idea and its invalidation in the same breath. If price trespasses, you know it instantly.
The three methods (choose your engine)
1) ATR Based “Structure-aware” distance
This classic approach keys off Average True Range to set a stop just beyond typical bar-to-bar excursion. It adapts smoothly to changing ranges and respects swing structure.
Use when: you want a steady, intuitive buffer that tracks trend legs without hugging price.
See it in action:
2) Volatility Based “Behavior-aware” distance
This engine derives stop distance from current return volatility (annualized, then scaled back down to the session). It reacts to regime shifts quickly and normalizes risk across symbols with very different prices.
Use when: you want the stop to breathe with realized volatility and respond faster to heat-ups/cool-downs.
See it in action:
3) Hybrid “Best of both worlds”
The Hybrid blends the ATR and Volatility distances into one consensus level, then trails it intelligently. You get the structural common sense of ATR and the regime sensitivity of Vol.
Use when: you want robust, all-weather behavior without micromanaging inputs.
See it in action:
How it trails
Longs: The stop ratchets up with favorable movement and holds its ground on shallow pullbacks. If price closes back into the risk zone, the level refreshes to the newest valid distance.
Shorts: Mirror logic ratchets down with trend, resists noise, and refreshes if price reclaims the zone.
Hybrid trailing: Uses the blended distance and the same “no give-backs” principle to keep gains protected as structure builds.
Reading the chart
Markers: Circles = ATR stops, Crosses = Vol stops, Diamonds = Hybrid. Colors indicate long (red level under price) vs short (green level above price).
Lines: The latest active stop is extended with a dashed line so you can see it at a glance.
Labels: “Long SL / Short SL” shows the exact price and current risk % from the last close no math required.
Table: ATR value, Daily Vol %, your chosen Method, the Current SL, and Risk %—all in one compact block that you can pin top-left/right/center.
Quick workflow
Define the idea: Long or Short, and which engine fits the tape (ATR, Vol, or Hybrid).
Place and trail: Let the optimizer print the level; trail automatically as the move develops.
Manage outcomes: If the line is tagged, you’re out clean. If it holds, you’ve contained heat while giving the trade room to work.
Inputs you’ll actually touch
Calculation Settings
ATR Length / Multiplier: Controls the “structural” cushion.
Volatility Length / Multiplier: Controls the “behavioral” cushion.
Trading Days: 252 or 365 to keep the volatility math aligned with the asset’s trading calendar.
Stop Loss Method
ATR Based | Volatility Based | Hybrid : Switch engines instantly to fit the trade.
Position Type
Long | Short | Both : Show only what you need for the current strategy.
Visual Settings
Show ATR / Vol / Hybrid Stops: Toggle families on/off.
Show Labels: Print price + Risk % at the live stop.
Table Position: Park the metrics where you like.
Coloring
Long/Short/Hybrid colors: Set a palette that matches your theme and stands out on your background.
Practical patterns to watch
Trend-pullback continuation: The stop ratchets behind higher lows (long) or lower highs (short). If price tests the level and rejects, that’s your risk-defined continuation cue.
Break-and-run: After a clean break, the Hybrid will usually sit slightly wider than pure Vol, use it to avoid getting shaken on the first retest.
Range compression: When the ATR and Vol distances converge, the table will show small Risk %. That’s your green light to size up with the same dollar risk, or keep it conservative if you expect expansion.
Alerts
Long Stop Loss Hit : Notifies when price crosses below the live long stop.
Short Stop Loss Hit : Notifies when price crosses above the live short stop.
Why this feels “set-and-serious”
You get a single look that answers three questions in real time: “Where’s my line in the sand?”, “How much heat am I taking right now?”, and “Is this distance appropriate for current conditions?” With ATR, Vol, and Hybrid in one tool, you can run the exact same playbook across symbols and regimes while keeping your chart clean and your risk explicit.

Uptrick: Majors Directional BiasOverview
Uptrick: Majors Directional Bias is a trend-following indicator designed for higher timeframe markets, with a particular focus on the daily chart. It keeps a persistent bullish or bearish stance, highlights confirmed trend flips with one-time markers, and plots a slim, adaptive flow trail that often acts as dynamic support in bullish conditions and resistance in bearish conditions. It is purpose-built for BTC, ETH, and SOL, with safeguards to warn users if applied elsewhere.
Introduction
This indicator was created to simplify trend tracking on higher timeframes. Rather than layering multiple moving averages, oscillators, or external signals, it keeps everything on the price chart itself. Candles are colored by the active stance, a single marker shows the bar where a trend flip is confirmed, and the flow trail follows price closely while adjusting to volatility. For traders working with the daily chart, the trail becomes a practical tool: in an uptrend, it often serves as a natural stop placement zone or structural support, while in a downtrend it behaves like dynamic resistance. The combination of persistence, confirmation, and structure gives traders a clean map of market direction without noise or clutter.
Purpose
The tool is designed to help traders follow medium to long-term market trends rather than react to short intraday moves. Its focus is clarity and continuity — it latches onto a stance and only changes when a new confirmed flip occurs. This makes it suitable for swing traders and position traders who want to stay aligned with the prevailing trend on the daily chart.
Practical uses include identifying trend shifts, entering trades in the direction of the new stance, managing positions by trailing stops along the flow trail, and monitoring pullbacks for whether they respect or break the trail. In this way, the indicator supports both entry timing and ongoing trade management on higher timeframe markets.
Originality and uniqueness
The originality of this script lies in its blend of complexity and simplicity. Internally, it uses multiple filters and layered components to reduce market noise, smooth out erratic fluctuations, and avoid false flips that are common on higher timeframes. Externally, the presentation is deliberately simple: candles are colored by trend, a single marker identifies each confirmed flip, and a slim trail with soft fills shows where the trend structure sits. Many tools either overload traders with information or flicker constantly in uncertain conditions. This script strikes a balance — complex logic works in the background, but what the trader sees is minimal and actionable. Its ability to filter out noise, persist with confidence, and present direction in the simplest terms makes it unique among trend-following overlays.
Why these components were merged
Each component has a clear role in supporting higher timeframe trading. Persistent bias coloring ensures the dominant trend is always visible, making it easy to stay aligned with the market. Flip markers give clarity by identifying the exact bar where the stance shifts, allowing traders to backtest or audit trends quickly. The flow trail provides a structural guide that adapts to volatility: in bull phases it runs under price, often acting as support, while in bear phases it runs above price, often behaving as resistance. Together, these features provide three layers of information in one view — direction, confirmation, and structure — giving traders a reliable framework for swing and position trading on the daily chart.
Step-by-Step
The script determines the dominant trend and locks that stance until an opposite confirmation occurs.
On confirmation of a new trend, a single marker prints on the bar of the flip.
A slim, adaptive trail plots under price in bull phases and above price in bear phases, with a soft fill to reinforce the state.
Price candles are colored by the active stance so the overall direction is always clear.
If the indicator is loaded on assets outside BTC, ETH, or SOL, a warning panel appears to set expectations.
Features
Persistent trend stance
Candles are always bull or bear, with no neutral state. This reduces ambiguity and keeps the trend visible at all times.
One-time flip markers
Markers plot once at the confirmed flip bar, preventing repetitive clutter and making historical review straightforward.
Adaptive flow trail with soft fill
The trail tracks price while adjusting to volatility. In bull trends it acts like dynamic support, in bear trends like dynamic resistance. Traders can use it as a practical stop-loss reference, trailing their risk along the line as the trend progresses.
Noise filtering logic
Internally, the indicator applies multiple filters and components to dampen false signals and avoid unnecessary flips. This is particularly important on higher timeframes, where swings are larger and stability is critical.
Asset-aware design
The indicator is tuned for BTC, ETH, and SOL, with an internal mode that adapts its responsiveness to each. A warning panel appears when used outside these majors.
Overlay-only clarity
Everything is drawn directly on the main chart. The trail gaps at regime changes, fills are soft and non-obstructive, and the overall design emphasizes readability on higher timeframe candles.
Conclusion
The MDB is a higher timeframe trend-following overlay built for BTC, ETH, and SOL, with daily charts as its ideal setting. It combines persistent bias coloring, one-time flip markers, and an adaptive flow trail to give traders direction, confirmation, and structure in the simplest possible form. Internally, it uses complex filtering to reduce noise and maintain reliable signals, but externally it stays minimal and clean. For swing and position traders who want to follow the daily trend with clarity and discipline, this indicator provides a focused solution.
Disclaimer
This indicator is provided for educational and informational purposes only and does not constitute financial advice. Trading involves risk, including the risk of loss. Past performance does not guarantee future results. Always conduct your own analysis and use appropriate risk management.