Stop


ATR based Pivots mcbwHey everyone this is an exciting new script I have prepared for you.
I was reading an old forex bulletin article some time ago when I came across this: solar.murty.net (or you can download the full bulletin with lots of other good articles here: www.forexfactory.com).
You can already buy this for metatrader (www.mql5.com) so I figured to make it for free for tradingview.
This bulletin suggested that you can reasonably predict daily volatility by adding or subtracting multiples of the daily ATR to the daily opening. Using this you can choose multiples to use as price targets and alternatively as stop losses. For example, if you already have a sense of market direction you can buy at market open place a stop loss at - 1 daily ATR and a profit target at + 3 ATRs for a risk to reward ratio of 3. If you are looking for smaller/quicker moves with a ratio of 3 you can have a stop loss at -0.25 ATR and a take profit at +0.75 ATR.
Alternatively this article also suggests to use this method to catch volatility breakouts. If price is higher than the + 1 ATR area then you can safely assume it will be going to the +2 ATR area so you can put a buy stop at + 1 ATR with a profit target at + 2 ATR with a stop loss at +0.5 ATR to catch a volatility breakout with a risk to reward ratio of 2!
Even further there are methods that you can use with ATRs of multiple window sizes, for example by opening two copies of this indicator and measuring recent volatility with a 1 week window and long term volatility within a 1 month window. If the short term volatility is crossing the long term volatility then there is a high probability chance that even more price movement will occur.
However I have found that this method is good for more than daily volatility , it can also be used to measure weekly volatility , and monthly volatility and use these multiples as good long term price targets.
To select if you want daily, weekly, or monthly values of the ATR of volatility you're using go to the settings and click on the options in the "Opening period". The default window of the ATR here is 14 periods, but you can change this if you want to in "ATR period". Most importantly you are able to select which multiples of the ATR you would like to use in the settings in "ATR multiple 1" which is the green line, "ATR multiple 2" which is the blue line, and "ATR multiple 3" which is the purple line. You can select any values you want to put in these, the choice of 0.25, 0.5, and 1 is not special, some people use fibonacci numbers here or simply 0.33, 0.66, and 0.99.
Repainting issue: This script uses the daily value of the Average True Range (ATR), which measures the volatility that is happening today. If price becomes more volatile then the value of the ATR can increase throughout the day, but it can never decrease. What this means is that the ATR based pivots are able to expand away from the opening price, which should not affect the trades that you take based on these areas. If you base your take profit on one of these ATR multiples and the daily volatility increase this means that your take profit area will be closer to your entry than the ATR multiple. Meaning that your trades will be more conservative.
While this all may sound very technical it is super intuitive, throw this on your chart and play around with it :)
Happy trading!

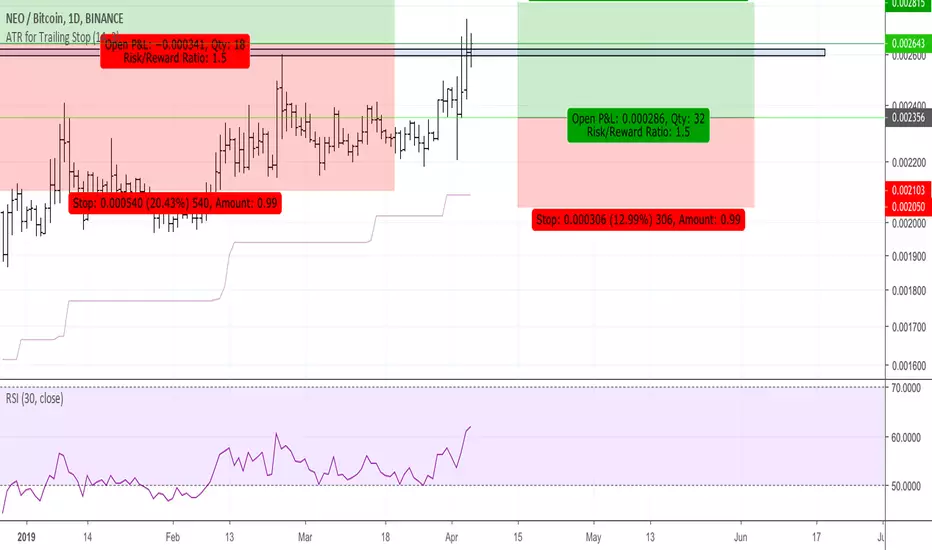
ATR for Trailing StopAn ATR (Average True Range) can be used to position a trailing stop
In this script, the true range of today is calculated based on the low of yesterday in order to be more stable.
It only goes up, as a trailing stop should do.
It only goes down when the trailing stop is reached by the price.

ATR for Trailing StopThe calculation of this ATR is based on the low of yesterday in order to not change continuously during the day.
You can use this indicator to create a trailing stop taking into account volatility on the nATRPeriod previous days.
It also always go up as a trailing stop should. It only goes down the price reaches the trailing stop.
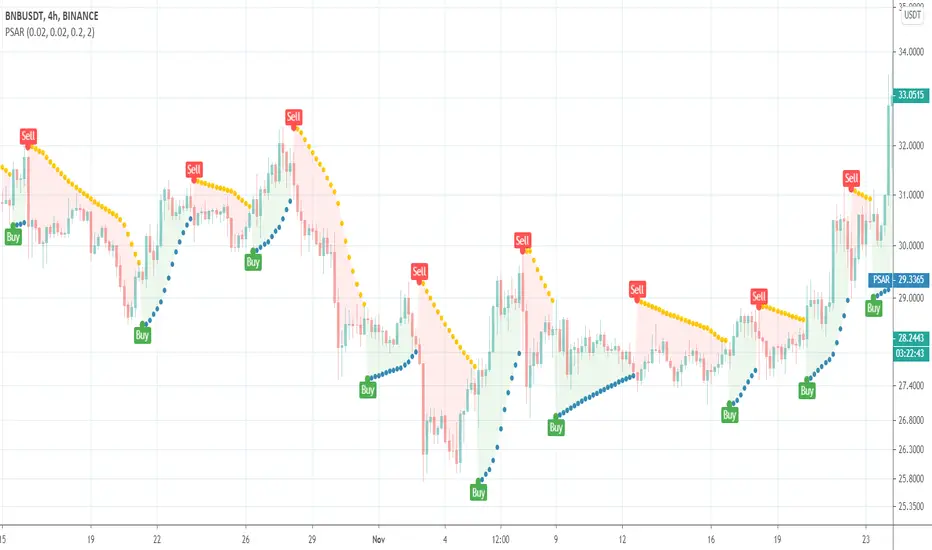
Parabolic SARThis is a redesign of the built-in Parabolic SAR indicator. I added a proper input system, an option to highlight initial points for both lines and an option to choose points width. So, customize it as you want.
Parabolic SAR was originally developed by J. Welles Wilder and described in his book "New Concepts in Technical Trading Systems" (1978). It is a trend-following indicator that can be used as a trailing stop loss.
To know which settings for PSAR are the most profitable on your instrument and timeframe you can use this tool
Profitable Parabolic SAR
SuperTrendThis is a redesign of the SuperTrend indicator. It removes stupid transitions between SuperTrend states and highlights initial points for both lines.
SuperTrend is a moving stop and reversal line based on the volatility (ATR).


Binque's Stop LossFixed Script only showing Daily Stop Loss. Now will show stop loss based on the resolution of the chart you are on, i.e. 1 min, 5 min, 15 min, 1 h, 4 h, 1 d, 1 w, 1 month, etc...


Double EMA with stop loss indicatorThis is an updated version of my previous stop loss script.
I've added a double EMA line and modified the stop as below;
In an uptrend....
1. a yellow dot will appear once it's time to move your stop. The yellow dot will display at the level of the stop loss. Place your stop 1 pip below the dot.
2. The yellow dot will only appear if a new higher low has formed and has been confirmed. Also the current candle must have broken the high of a previous bullish candle or the dot will not appear.
3. The dot will also appear if there is a likely reversal of the current trend.
Also works in downtrends.....

Binque's Stop Loss IndicatorBinque's Stop Loss Indicator is a great way to visualize a trailing stop loss based on a percent from the high. i.e. If the high was $10 of a trading day and your stop loss was set at 5% (percent) then your chart would show a small dot 5% below the high of the day. This is a great way to quickly see a trailing stock idea. Change the color to match your back ground. Adjust your trailing stop loss to fit your trading style.
Note: This indicator is calculated off of the daily high.

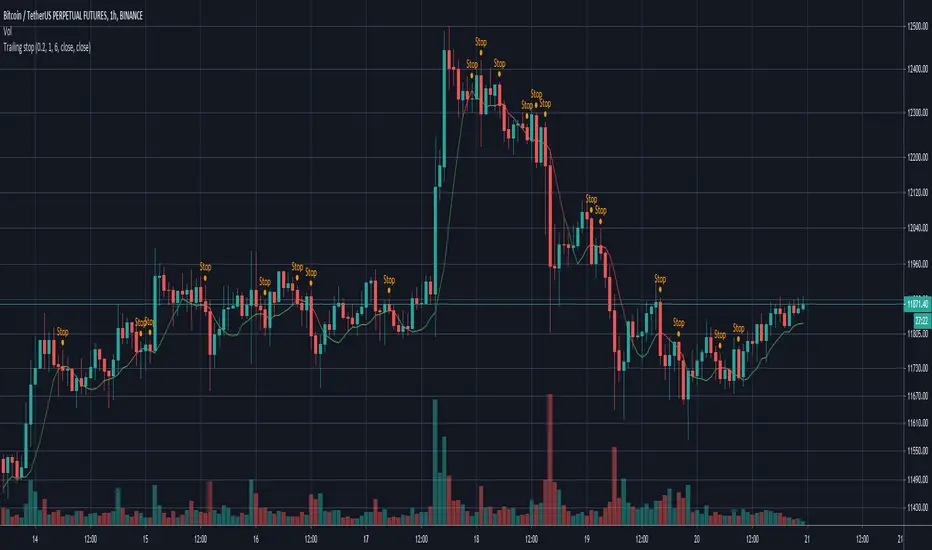
Simple Trailing stopSince my exchange doesn't support trailing stop I made a script for it.
It is fully configurable, which means you can set the bars for calculation, the offset and sources for trigger and calculation.
The original purpose for me was to send a command to my bot. If you like it please comment and check out my other scripts.
ATR+ (Stop Loss Indicator)This script is designed to aid in back-testing and trade execution.
It displays three sets of values - the teal colored value is the current ATR, the green colored value is your stop loss distance (in pips) below the most recent swing low for long trades , and the red colored value is your stop loss distance (in pips) above the most recent swing high for short trades .
You can change the stop loss settings to base your stop loss on a set pip amount or by however many multiples of the current ATR as you wish (eg. 1.5x ATR).
Feel free to ask any questions or edit the script without permission :)
- Matt.

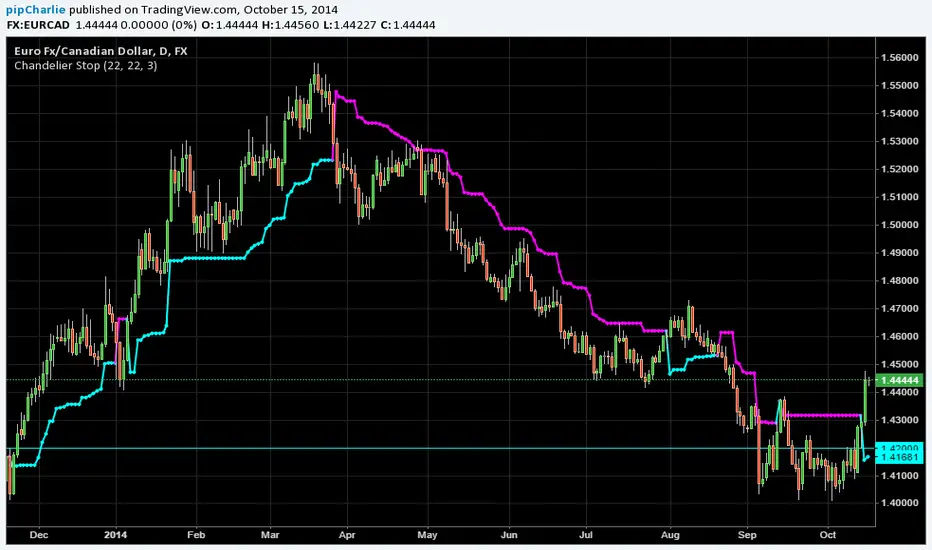
CDC ATR Trailing Stop V1Based on the standard ATR trailing stop indicator.
A few minor tweaks as used in Chaloke.com's community

Parabolic GlitterThis indicator overlays a series of Parabolic Stop And Reverses (SARs) to continuously illustrate trends as they form in addition to a range of good possible levels at which to place stop orders.
The Initial Start argument gives the minimum value for the SAR function's "Start" argument. The Increment/Start Ratio argument gives the ratio of the SAR function's "Increment" and "Start" arguments (i.e. SAR default is Start = 0.02, Increment = 0.02, therefore Increment/Start Ratio = 1). The same logic applies to the Max/Start Ratio Argument (i.e. SAR default is Start = 0.02, Max = 0.2, therefore Max/Start Ratio = 10).
The Adaptive Coloring argument determines whether the plotting points are red in downtrends and green in uptrends, or if all the plotted points are given the same color (defaults to silver).

[RS]Function Volatility Stop V0Function for Volatility Stop:
added some tweeks so it can be used on any series as in example a rsi.

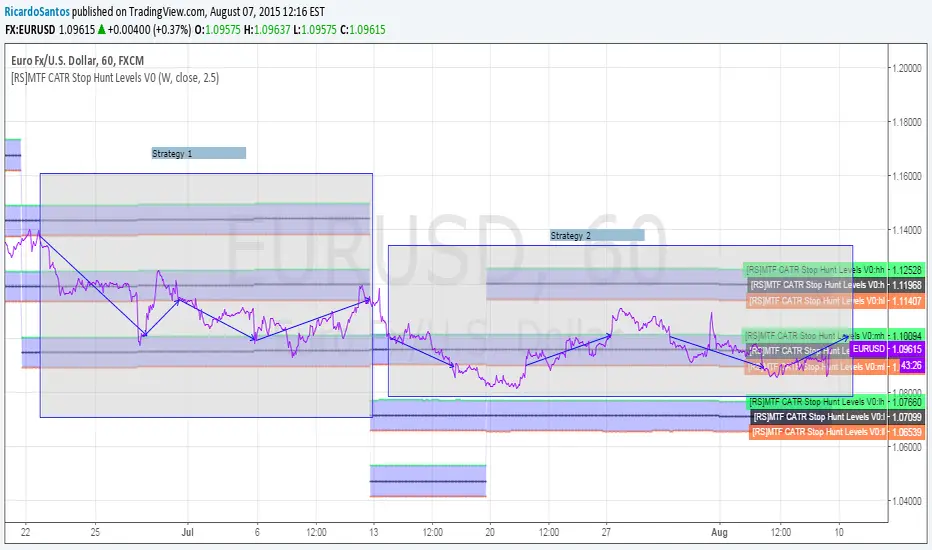
[RS]MTF CATR Stop Hunt Levels V0EXPERIMENTAL:
Adaptation from stop hunt levels:
Uses timeframe and atr to set ranges.
[RS]Stop Hunt Levels V0Request for SpreadEagle71:
Stop Hunt Levels adapted from:
www.investopedia.com
configuration:
smoothing: smooths/average the source higher value will remove spikes but delay the speed of adjusting
source: source to compare crossing lines.
Rounding Value: value space of the grid.
Entry Window Size: Space for entrys.