Extreme Reversal SignalThe Extreme Reversal Signal is designed to signal potential pivot points when the price of an asset becomes extremely overbought or oversold. Extreme conditions typically signal a brief or extensive price reversal, offering valuable entry or exit points. It's important to note that this indicator may produce multiple signals, making it essential to corroborate these signals with other forms of analysis to determine their validity. While the default settings provide valuable insights, it might be beneficial to experiment with different configurations to ensure the indicator's efficacy.
Two primary conditions define extremely overbought and oversold states. The first condition is that the price must deviate by two standard deviations from the 20-day Simple Moving Average (SMA). The second condition is that the 3-day SMA of the 14-day Stochastic Oscillator (STO) derived from the 14-day Relative Strength Index (RSI) is above or below the upper or lower limit.
Oversold states arise when the first condition is met and the 3-day SMA of the 14-day Stochastic RSI falls below the lower limit, suggesting a buy signal. These are visually represented by green triangles below the price bars. Overbought states arise when the first condition is met and the 3-day SMA of the 14-day Stochastic RSI rises above the upper limit, suggesting a sell signal. These are visually represented by red triangles above the price bars. It's also possible to set up automated alerts to get notifications when either of these two conditions is met to avoid missing out.
While this indicator has traditionally identified overbought and oversold conditions in various different assets, past performance does not guarantee future results. Therefore, it is advisable to supplement this indicator with other technical tools. For instance, trend indicators can greatly improve the decision-making process when planning for entries and exit points.
Stokastik RSI (STOCH RSI)

12&50 RSI + %R2/50 RSI+ %R is a PineScript indicator that combines two popular technical indicators, the Relative Strength Index (RSI) and the Williams %R. The indicator plots two lines, K and D, which represent the smoothed moving averages of the RSI. It also plots the RSI with a 60-period length and the Williams %R with a 21-period length. The indicator can be used to identify overbought and oversold conditions, as well as potential reversals.
Here are some of the key features of the script:
It uses two different RSI lengths to provide a more comprehensive view of the market.
It plots the Williams %R, which can be used to identify overbought and oversold conditions.
It includes overbought and oversold levels to help traders identify potential entry and exit points.

Kalman Filtered ROC & Stochastic with MA SmoothingThe "Smooth ROC & Stochastic with Kalman Filter" indicator is a trend following tool designed to identify trends in the price movement. It combines the Rate of Change (ROC) and Stochastic indicators into a single oscillator, the combination of ROC and Stochastic indicators aims to offer complementary information: ROC measures the speed of price change, while Stochastic identifies overbought and oversold conditions, allowing for a more robust assessment of market trends and potential reversals. The indicator plots green "B" labels to indicate buy signals and blue "S" labels to represent sell signals. Additionally, it displays a white line that reflects the overall trend for buy signals and a blue line for sell signals. The aim of the indicator is to incorporate Kalman and Moving Average (MA) smoothing techniques to reduce noise and enhance the clarity of the signals.
Rationale for using Kalman Filter:
The Kalman Filter is chosen as a smoothing tool in the indicator because it effectively reduces noise and fluctuations. The Kalman Filter is a mathematical algorithm used for estimating and predicting the state of a system based on noisy and incomplete measurements. It combines information from previous states and current measurements to generate an optimal estimate of the true state, while simultaneously minimizing the effects of noise and uncertainty. In the context of the indicator, the Kalman Filter is applied to smooth the input data, which is the source for the Rate of Change (ROC) calculation. By considering the previous smoothed state and the difference between the current measurement and the predicted value, the Kalman Filter dynamically adjusts its estimation to reduce the impact of outliers.
Calculation:
The indicator utilizes a combination of the ROC and the Stochastic indicator. The ROC is smoothed using a Kalman Filter (credit to © Loxx: ), which helps eliminate unwanted fluctuations and improve the signal quality. The Stochastic indicator is calculated with customizable parameters for %K length, %K smoothing, and %D smoothing. The smoothed ROC and Stochastic values are then averaged using the formula ((roc + d) / 2) to create the blended oscillator. MA smoothing is applied to the combined oscillator aiming to further reduce fluctuations and enhance trend visibility. Traders are free to choose their own preferred MA type from 'EMA', 'DEMA', 'TEMA', 'WMA', 'VWMA', 'SMA', 'SMMA', 'HMA', 'LSMA', and 'PEMA' (credit to: © traderharikrishna for this code: ).
Application:
The indicator's buy signals (represented by green "B" labels) indicate potential entry points for buying assets, suggesting a bullish trend. The white line visually represents the trend, helping traders identify and follow the upward momentum. Conversely, the sell signals (blue "S" labels) highlight possible exit points or opportunities for short selling, indicating a bearish trend. The blue line illustrates the bearish movement, aiding in the identification of downward momentum.
The "Smoothed ROC & Stochastic" indicator offers traders a comprehensive view of market trends by combining two powerful oscillators. By incorporating the ROC and Stochastic indicators into a single oscillator, it provides a more holistic perspective on the market's momentum. The use of a Kalman Filter for smoothing helps reduce noise and enhance the accuracy of the signals. Additionally, the indicator allows customization of the smoothing technique through various moving average types. Traders can also utilize the overbought and oversold zones for additional analysis, providing insights into potential market reversals or extreme price conditions. Please note that future performance of any trading strategy is fundamentally unknowable, and past results do not guarantee future performance.

RSI with J-Line ***For ease of use, I recommend changing the J Histogram to a line indicator, then it works like the KDJ Stochastic indicator. Full disclosure, I created this script with the help of GPT. This script was inspired by the KDJ Stochastic indicator by Dreadblitz***
The "RSI with J-Line" script is essentially a modified Relative Strength Index (RSI) indicator with an added histogram component. Here's how to use the different components of the script:
RSI Line (Blue): The RSI is a momentum oscillator that measures the speed and change of price movements. It oscillates between zero and 100, and is typically used to identify overbought and oversold conditions in a market. Traditionally, readings over 70 are considered overbought, and readings under 30 are considered oversold. However, these are not strict rules and can vary depending on the market and the overall trend.
RSI Smooth Line (Orange): This is the simple moving average of the RSI. It helps to smooth out the RSI and to identify the overall trend of the momentum. When the RSI line crosses above the RSI Smooth line, it might indicate that the momentum is moving upwards. When the RSI line crosses below the RSI Smooth line, it might indicate that the momentum is moving downwards.
RSI J-Line (Red Histogram): The J-Line is an additional line that's calculated as 3*rsiSmooth - 2*rsi. It's similar to the %J line in the Stochastic indicator and is designed to provide quicker signals than the RSI or RSI Smooth line. When the histogram is above the 0 line, it might indicate bullish momentum. When it's below the 0 line, it might indicate bearish momentum.
Please note that these interpretations are standard for these types of indicators, but actual market behavior can be complex and is influenced by many factors. Indicators should be used as part of a comprehensive trading strategy, not in isolation. Always take into account other market information and indicators before making trading decisions.

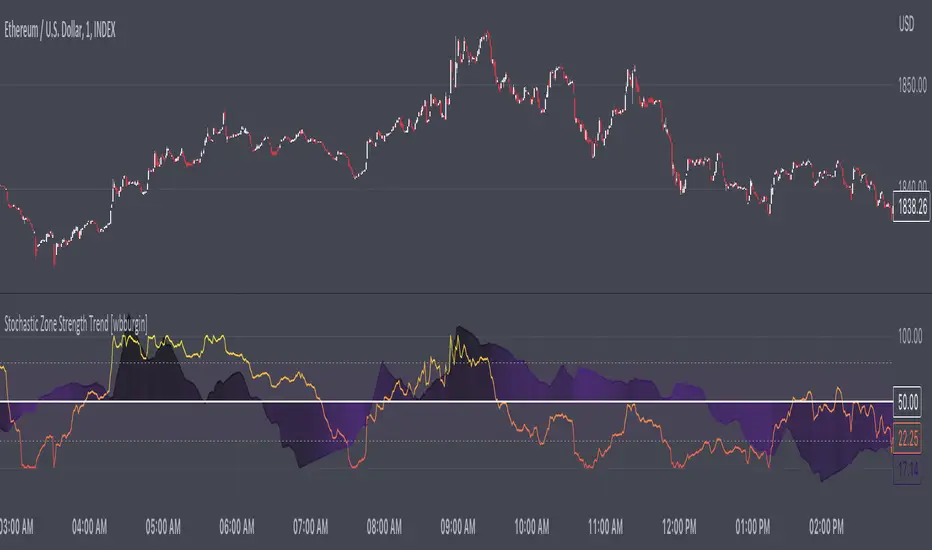
Stochastic Zone Strength Trend [wbburgin]The Stochastic Zone Strength Trend indicator is a very powerful momentum and trend indicator that 1) identifies trend direction and strength, 2) determines pullbacks and reversals (including possible entry/exit conditions), 3) works on every instrument, and 4) can filter out ranges. I have some examples below on how to use it to its full effectiveness. It is composed of two components: Stochastic Zone Strength and Stochastic Trend Strength .
Stochastic Zone Strength
At its most basic level, the stochastic Zone Strength plots the momentum of the price action of the instrument, and identifies bearish and bullish changes with a high degree of accuracy. Think of the stochastic Zone Strength as a much more robust version of the RSI. Momentum-change thresholds are demonstrated by the "20" and "80" levels on the indicator (see below image).
Stochastic Trend Strength
The stochastic Trend Strength component of the script uses resistance in each candlestick to calculate the trend strength of the instrument. I will go more into detail about the settings after my description of how to use the indicator, but there are two forms of the stochastic Trend Strength:
Anchored at 50 (directional stochastic Trend Strength:
The directional stochastic Trend Strength can be used similarly to the MACD difference or other histogram-like indicators : a rising plot indicates an upward trend, while a falling plot indicates a downward trend.
Anchored at 0 (nondirectional stochastic Trend Strength:
The nondirectional stochastic Trend Strength can be used similarly to the ADX or other non-directional indicators : a rising plot indicates increasing trend strength, and look at the stochastic Zone Strength component and your instrument to determine if this indicates increasing bullish strength or increasing bearish strength (see photo below):
(In the above photo, a bearish divergence indicated that the high Trend Strength predicted a strong downwards move, which was confirmed shortly after. Later, a bullish move upward by the Zone Strength while the Trend Strength was elevated predicated a strong upwards move, which was also confirmed. Note the period where the Trend Strength never reached above 80, which indicated a ranging period (and thus unprofitable to enter or exit)).
How to Use the Indicator
The above image is a good example on how to use the indicator to determine divergences and possible pivot points (lines and circles, respectively). I recommend using both the stochastic Zone Strength and the stochastic Trend Strength at the same time, as it can give you a robust picture of where momentum is in relation to the price action and its trajectory. Every color is changeable in the settings.
Settings
The Amplitude of the indicator is essentially the high-low lookback for both components.
The Wavelength of the indicator is how stretched-out you want the indicator to be: how many amplitudes do you want the indicator to process in one given bar.
A useful analogy that I use (and that I derived the names from) is from traditional physics. In wave motion, the Amplitude is the up-down sensitivity of the wave, and the Wavelength is the side-side stretch of the wave.
The Smoothing Factor of the settings is simply how smoothed you want the stochastic to be. It's not that important in most circumstances.
Trend Anchor was covered above (see my description of Trend Strength). The "Trend Transform MA Length" is the EMA length of the Trend Strength that you use to transform it into the directional oscillator. Think of the EMA being transformed onto the 50 line and then the Trend Strength being dragged relative to that.
Finally, the colors are changeable on the bottom.
Final Notes
As with previous and future invite-only scripts, I only restrict access to 1) maintain effectiveness of scripts, 2) because I use these scripts myself heavily, and/or 3) to support myself. Additionally, I will never make an restricted indicator that is not completely original in idea, scope, and execution.
Yours,
wbburgin
Stochastic RSI with DivergencesThis indicator is Stochastic RSI using code loops* rather than pivot low/high functions.
The pivot low/high function provided by Pine Script requires a set number of bars to pass prior to locating a swing low/high.
This can mean large moves have occurred prior to a swing low having passed if the lookback range was set to five bars (5).
5 bars on a 2 hour chart is a long time and large moves may be missed.
As I don't use these functions, there is no requirement for a set number of bars to have passed prior to swing low/high positions to be identified.
This means it doesn't rely on a set number of bars to pass prior to finding a new pivot point.
* Code loops are a function which will check conditions in a range until a defined condition is met.
In this case a pivot low is a bar with no lower bars within 3 bars either side of the current checked bar.
Additional:
Lines will redraw and delete previous divergences to remove clutter on the indicator.
A table cells for alternate timeframe Stochastic RSI values so you don't need to swap between charts constantly.
How it works:
The first lookback finds an initial low/high within a small range of the current bar. (default of 10)
This low/high must be the lowest/highest point within 3 bars either side.
The second low/high must be over 5 bars prior to the recent low and a max range of previous lookback. (default of 30)
This low/high must be the lowest/highest point within 3 bars either side.
If a divergence is found, it will draw the divergence on the indicator and delete the prior line drawn.
Personal note:
Personally coded functions for my personal use, though others may find use with it.

Stochastic [Tcs] | OSCThis script is an implementation of the stochastic relative strength index (STOCH RSI) indicator
The script takes inputs from the length of the RSI, the source of the data, and parameters for the smoothing of the STOCH RSI.
The STOCH RSI is calculated by first calculating the RSI of the chosen source data, then smoothing it with an exponential moving average. The stochastic oscillator is then applied to the smoothed RSI, and smoothed again to create the final STOCH RSI.
The script also calculates a trigger value using a combination of the STOCH RSI and a volume-weighted moving average. It then plots the STOCH RSI, trigger value, and overbought/oversold levels, and fills the background of the plot based on the relationship between the trigger and STOCH RSI values.
Finally, the script plots buy and sell signals based on crossovers and crossunders of the STOCH RSI and its smoothed version.
The cross signal is stronger than the dots, in both direction and usually the best entries happen when two crosses signal on the level 0(long) or 100(short) appear after a dot signal.
Please note that this indicator is for educational purposes only and should not be used for trading without further testing and analysis.

Oscillator pack [Tcs] | OSCThese oscillators are a reinterpretation of some of the most famous indicators for traders, with the scope to provide higher accuracy and better readability.
The improvements are based on both calculation and visual impact, with calculations incorporating not only price but also tick volume to enhance signal accuracy.
All oscillators can be applied to different timeframes than the chart being analyzed.
This indicator includes three different oscillators: TCS Stochastic, TCS MACD, and TCS Momentum.
• TCS STOCHASTIC
The TCS STOCHASTIC removes the noise from the standard RSI Stochastic and significantly reduces the number of anticipated signals (line crosses) that the RSI Stochastic provides. Similarly, the divergences are less frequent but more accurate.
The indicator plots overbought conditions (plotted as green waves) and oversold conditions (plotted as purple waves) in a clear way.
The Stochastic channel marks the power of buyers or sellers with white (bullish) and gray (bearish) shades.
The dots on the Stochastic line indicate when buyers or sellers are in control. This helps both in trend following conditions and reversal points.
The tinier the channel, defined by the Stochastic line and signal line, the stronger the trend is likely to be.
• TCS MACD
The TCS MACD removes noise from the standard MACD and often anticipates good entry points for standard MACD crosses, while delaying bad ones.
Additionally, the indicator's performance for divergences has been improved, as it takes into account both price action and on balance volume.
It has also been developed to provide better performance at the 0 line level, which can be a good entry point when the baseline is crossed.
The histogram helps to identify divergences and the strength of the trend.
• TCS MOMENTUM
The TCS MOMENTUM WAVES indicate the trend direction based on the strength of momentum and moments of accumulation/distribution, which are highlighted with a red background.
Bullish trends are represented with white waves, while bearish trends are shown in gray.
Crosses symbol on the 0 line indicate a possible trend reversal, with green for bullish and purple for bearish.
The best entry point for a reversal is when the momentum line changes to the trend direction color after a reversal point is detected.
The momentum line and its signal line can also be used to identify entry points for a strategy, as well as the crosses of the waves.
Please note that this indicator is for educational purposes only and should not be used for trading without further testing and analysis.

Market Cycle IndicatorThe Market Cycle Indicator is a tool that integrates the elements of RSI, Stochastic RSI, and Donchian Channels. It is designed to detect market cycles, enabling traders to enter and exit the market at the most opportune times.
This indicator provides a unique perspective on the market, combining multiple strategies into one unified and weighted approach. By factoring in the inputs from each of these popular technical analysis methods, it offers a more holistic view of the market trends and cycles.
Parameter Details:
Donchian Channels (DCO):
- donchianPeriod: Sets the period for the Donchian Channel calculation. Default is set to 14.
- donchianSmoothing: Sets the smoothing factor for the Donchian Channel calculation. Default is set to 3.
- donchianPrice: Selects the price type to be used in the Donchian Channel calculation. Default is set to the closing price.
Relative Strength Index (RSI):
- rsiPeriod: Sets the period for the RSI calculation. Default is set to 14.
- rsiSmoothing: Sets the smoothing factor for the RSI calculation. Default is set to 3.
- rsiPrice: Selects the price type to be used in the RSI calculation. Default is set to the closing price.
Stochastic RSI (StochRSI):
- srsiPeriod: Sets the period for the Stochastic RSI calculation. Default is set to 20.
- srsiSmoothing: Sets the smoothing factor for the Stochastic RSI calculation. Default is set to 3.
- srsiK: Sets the period for the %K line in the Stochastic RSI calculation. Default is set to 5.
- srsiD: Sets the period for the %D line in the Stochastic RSI calculation. Default is set to 5.
- srsiPrice: Selects the price type to be used in the Stochastic RSI calculation. Default is set to the closing price.
Weights:
- rsiWeight: Sets the weight for the RSI in the final aggregate calculation. Default is set to 1.
- srsiWeight: Sets the weight for the Stochastic RSI in the final aggregate calculation. Default is set to 1.
- dcoWeight: Sets the weight for the Donchian Channel in the final aggregate calculation. Default is set to 1.
Limits:
- limitHigh: Sets the upper limit for the indicator. Default is set to 80.
- limitLow: Sets the lower limit for the indicator. Default is set to 20.
By customizing these parameters, users can tweak the indicator to align with their own trading strategies and risk tolerance levels. Whether you're a novice or an experienced trader, the Comprehensive Market Cycle Indicator provides valuable insights into the market's behavior.
Uses library HelperTA

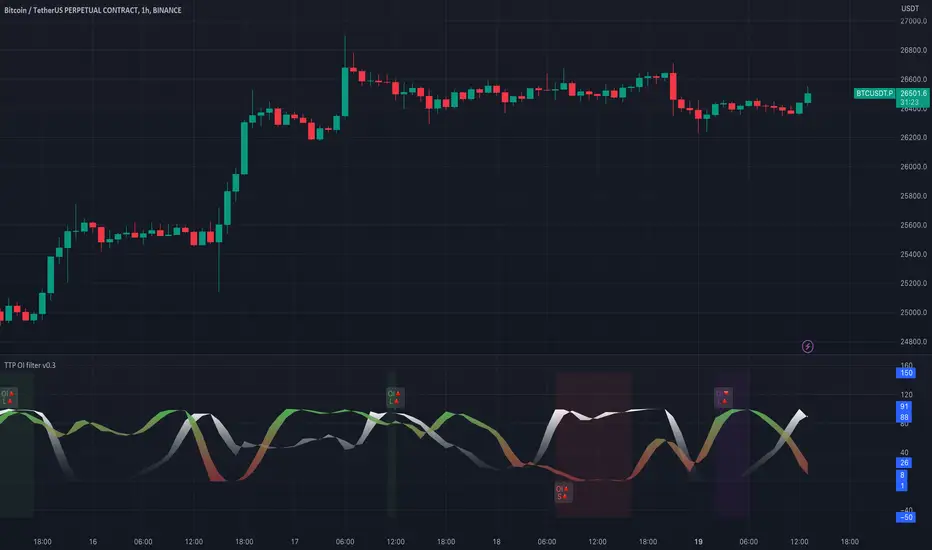
TTP OI + LS signal filterThis oscillator helps filtering specific conditions in the market based on open interest (OI) and the ratio of longs and shorts (LS) for crypto assets.
Currently it works with BINANCE:BTCUSDT.P but soon I'll be adding support for more assets.
It flags areas of interest like:
- Too many longs, too many shorts in the market
- Open interest too high or too low
It accepts an external signal as a source in which case filters can be applied to the original signal. For example the external signal might trigger and plot a 1 when RSI break below 70. By connecting such signal with this oscillator you'll be able to only pass-through the ones that occur when any of the areas of interest mentioned above are also valid.
If both filter are applied it acts as an OR. For example, if too many longs and too many shorts are active, it will pass through the signal in either condition.
The results of the original signal filtered is printed to be able to later use it in any external backtester strategy that accepts external sources too.
If external source signal is disabled it will trigger any time the combined filters are returning true.
Open interest and the ratio of longs/shorts is considered too high whenever the stochastic RSI calculation of the OI or ratio LS reaches a level above 80 and too low when below 20
The ratio of long/shorts is calculated by dividing the ratio of longs vs shorts from BITFINEX:BTCUSDLONGS and BITFINEX:BTCUSDSHORTS
True Trend Oscillator [wbburgin]The True Trend oscillator identifies trending or ranging markets with a stochastic ATR and RSI. Here are some examples for how it can be used.
Uptrends
If the candlesticks are lime green, this signals an uptrend. On the oscillator, you can identify an uptrend if the bull strength (the green line) is above the bear strength (the red line). The strength of the uptrend and the downtrend can be found by looking at the slope of these lines.
Downtrends
If the candlesticks are red, this signals a downtrend. On the oscillator, notice how the bear strength line is above the bull strength line.
Ranging Markets and Pullbacks
The True Trend oscillator can also be used to identify ranging markets or pullbacks. Let's look at the previous example again:
If you notice that the bull and bear lines are bouncing above the red weak-trend zone (as in the example above), this signals an extended trend. On the contrary, when the bull and bear lines fall into the weak-trend zone, this may indicate a larger pullback or a range to look to enter a trade again, as in this example, where the ranging candles in gray demonstrate temporary pullbacks in a larger bullish trend:
Ranges can also occur before trend reversals, so a range may also indicate a smart time to secure profits.
You can customize the ranging threshold in the settings. It can be set from 0-100 because the indicator is a stochastic.
Hope you all find this indicator useful!

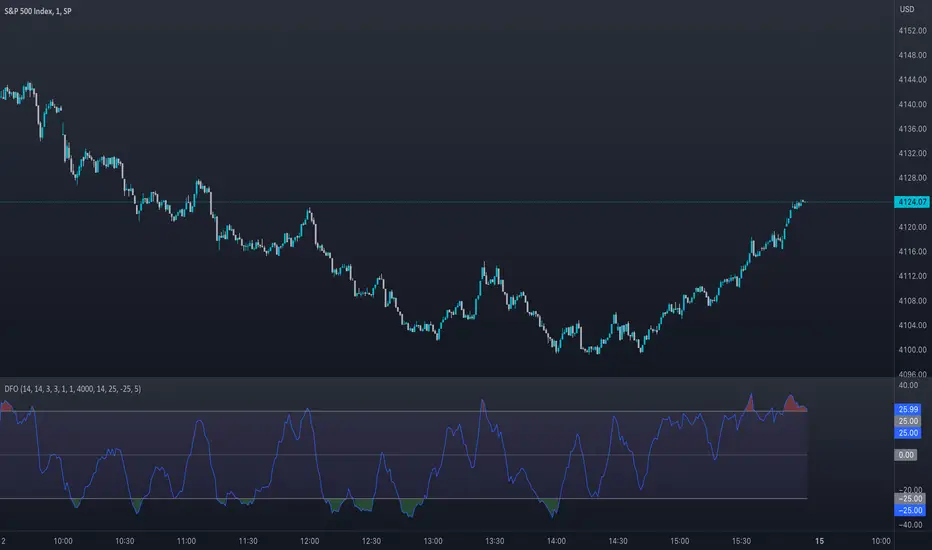
Dynamic Fusion Oscillator (DFO)The Dynamic Fusion Oscillator (DFO) is a uniquely crafted trading indicator that amalgamates the power of the Relative Strength Index (RSI) and the Stochastic Oscillator into a single, comprehensive tool. It provides traders with a more nuanced analysis of market momentum and overbought or oversold conditions. The DFO's distinctiveness lies in its ability to leverage the strengths of both RSI and Stochastic Oscillator, offering a more robust reading of market conditions. Moreover, it does so by offering a weighted approach, which combines the standardized values of both indicators. This flexibility in adjusting the weight of each component enhances its adaptability to different market scenarios, making it a versatile tool in a trader's arsenal. The following sections will delve into the intricacies of the DFO, demonstrating its advantages, usage, and applicability across various market conditions.
Differences from Existing Scripts:
The Dynamic Fusion Oscillator (DFO) is unique from other trading indicators as it combines the strengths of two popular technical analysis tools: the Relative Strength Index (RSI) and the Stochastic Oscillator. This fusion results in a dynamic, weighted oscillator that provides a more comprehensive view of the market's momentum and overbought or oversold conditions.
Usage and Market Conditions:
DFO can be used across different markets, including stocks, forex, commodities, and cryptocurrencies. It is designed to perform well in varying market conditions - trending or ranging. However, like any other technical indicator, it is advised to use it in conjunction with other technical analysis tools and not rely solely on it for making trading decisions.
Importance of Combining RSI and Stochastic Oscillator:
The RSI and Stochastic Oscillator are both momentum indicators, but they have their individual strengths and weaknesses. The RSI excels at identifying overbought and oversold conditions, while the Stochastic Oscillator is adept at predicting price reversals. By combining these two into a single oscillator, we can benefit from the strengths of both while minimizing their weaknesses. This fusion results in a more robust indicator that offers better signal quality and reliability.
Input Explanations:
RSI Length : This determines the number of periods used to calculate the RSI. A smaller value will make the RSI more sensitive to price changes, while a larger value will smooth out the RSI line.
Stochastic Length, Smooth K, Smooth D : These are parameters for calculating the Stochastic Oscillator. Length is the observation period, Smooth K is the smoothing factor for the %K line, and Smooth D is the smoothing factor for the %D line.
RSI Weight, Stochastic Weight : These determine the weights of the RSI and the Stochastic Oscillator in the final calculation. Increasing the weight of one will make the oscillator more sensitive to that component.
Standardization Length : This is the number of periods used to calculate the moving average and standard deviation for standardization purposes.
MA Length : This determines the number of periods used to calculate the moving average of the oscillator.
Upper Band Value, Lower Band Value : These set the maximum and minimum values for the oscillator. Signals are generated when the oscillator crosses these thresholds.
Number of periods above the band for alert condition : This sets the number of periods the oscillator stays above the band to trigger an alert.
Alert Conditions:
Alerts are generated under the following conditions:
Bullish Signal : An alert is generated when the Moving Average (MA) crosses above the Oscillator. This can be seen as a potential bullish signal indicating an upward price trend.
Bearish Signal : An alert is generated when the MA crosses below the Oscillator. This can be seen as a potential bearish signal indicating a downward price trend.
Oscillator above/below upper/lower band : Alerts are also generated when the oscillator has been above the upper band or below the lower band for a specified number of periods. This could signal overbought or oversold conditions, respectively. These signals can help traders identify potential reversal points in the market.
These alerts can help traders by providing timely signals for potential trading opportunities. However, they should be used as part of a comprehensive trading strategy that also takes into account other technical and fundamental factors.
RSI, SRSI, MACD and DMI cross - Open source codeHello,
I'm a passionate trader who has spent years studying technical analysis and exploring different trading strategies. Through my research, I've come to realize that certain indicators are essential tools for conducting accurate market analysis and identifying profitable trading opportunities. In particular, I've found that the RSI, SRSI, MACD cross, and Di cross indicators are crucial for my trading success.
Detailed explanation:
The RSI is a momentum indicator that measures the strength of price movements. It is calculated by comparing the average of gains and losses over a certain period of time. In this indicator, the RSI is calculated based on the close price with a length of 14 periods.
The Stochastic RSI is a combination of the Stochastic Oscillator and the RSI. It is used to identify overbought and oversold conditions of the market. In this indicator, the Stochastic RSI is calculated based on the RSI with a length of 14 periods.
The MACD is a trend-following momentum indicator that shows the relationship between two moving averages of prices. It consists of two lines, the MACD line and the signal line, which are used to generate buy and sell signals. In this indicator, the MACD is calculated based on the close price with fast and slow lengths of 12 and 26 periods, respectively, and a signal length of 9 periods.
The DMI is a trend-following indicator that measures the strength of directional movement in the market. It consists of three lines, the Positive Directional Indicator (+DI), the Negative Directional Indicator (-DI), and the Average Directional Index (ADX), which are used to generate buy and sell signals. In this indicator, the DMI is calculated with a length of 14 periods and an ADX smoothing of 14 periods.
The indicator generates buy signals when certain conditions are met for each of these indicators.
1) For the RSI, a buy signal is generated when the RSI is below or equal to 35 and the Stochastic RSI %K is below or equal to 15, or when the RSI is below or equal to 28 the Stochastic RSI %K is below or equal to 15 or when the RSI is below or equal to 25 and the Stochastic RSI %K is below or equal to 10 or when the RSI is below or equal to 28.
2) For the MACD, a buy signal is generated when the MACD line is below 0, there is a change in the histogram from negative to positive, the MACD line and histogram are negative in the previous period, and the current histogram value is greater than 0.
3) For the DMI, a buy signal is generated when the Positive Directional Indicator (+DI) crosses above the Negative Directional Indicator (-DI), and the -DI is less than the +DI.
The indicator generates sell signals when certain conditions are met for each of these indicators:
1) For the RSI, a sell signal is generated when the RSI is above or equal to 75 and the Stochastic RSI %K is above or equal to 85, or when the RSI is above or equal to 80 and the Stochastic RSI %K is above or equal to 85, or when the RSI is above or equal to 85 and the Stochastic RSI %K is above or equal to 90 or when the RSI is above or equal to 82.
2)For the MACD, a sell signal is generated when the MACD line is above 0, there is a change in the histogram from positive to negative, the MACD line and histogram are positive in the previous period, and the current histogram value is less than the previous histogram value. On the other hand, a buy signal is generated when the MACD line is below 0, there is a change in the histogram from negative to positive, the MACD line and histogram are negative in the previous period, and the current histogram value is greater than the previous histogram value.
3)For the DMI a bearish signal is generated when plusDI crosses above minusDI, indicating that bulls are losing strength and bears are taking control.
The indicator uses a combination of these four indicators to generate potential buy and sell signals. The buy signals are generated when RSI and SRSI values are in oversold conditions, while sell signals are generated when RSI and SRSI values are in overbought conditions. The indicator also uses MACD crossovers and DMI crossovers to generate additional buy and sell signals.
When a signal is strong?
The use of multiple signals within a specific timeframe can increase the accuracy and reliability of the signals generated by this indicator. It is recommended to look for at least two signals within a range of 5-8 candles in order to increase the probability of a successful trade.
Why it's original?
1) There is no indicator in the library that combine all of these indicators and give you a 360 view
2)The combination of the RSI, Stochastic RSI, MACD, and DMI indicators in a single script it's unique and not available in the libray.
3)The specific parameters and conditions used to calculate the signals may be unique and not found in other scripts or libraries.
4)The use of plotshape() to plot the signals as shapes on the chart may be unique compared to other scripts that simply plot lines or bars to indicate signals.
5)The use of alertcondition() to trigger alerts based on the signals may be unique compared to other scripts that do not have custom alert functionality.
Keep attention!
It is important to note that no trading indicator or strategy is foolproof, and there is always a risk of losses in trading. While this indicator may provide useful information for making conclusions, it should not be used as the sole basis for making trading decisions. Traders should always use proper risk management techniques and consider multiple factors when making trading decisions.
Support me:)
If you find this new indicator helpful in your trading analysis, I would greatly appreciate your support! Please consider giving it a like, leaving feedback, or sharing it with your trading network. Your engagement will not only help me improve this tool but will also help other traders discover it and benefit from its features. Thank you for your support!

Stochastic RSI+ by MartialChartsFXThe original Stochastic RSI was built to generate more signals than either of the ordinary RSI or Stochastic Oscillator.
This Stochastic RSI+ is a customized Stochastic RSI meant to be less obtrusive as a lower indicator with several added components for improved utility.
The Stochastic RSI+ has 3 components:
1. The Single line color changing Stochastic RSI (%K line)
2. Divergence detection using one of three oscillators (RSI, Stochastic, or the default Stochastic RSI). Divergence may be detected in Strict or Non-Strict modes.
3. Strength indicator
Single Line Stochastic RSI (%K)
To make manual detection of divergence easier, I decided to reduce the Stochastic RSI down to just the %K line. In order to see how the %K line interacts with the %D line without having the extra line as a distraction, the %K line has been coded to change colors based on its relation to the %D line.
The Stochastic %K is green when %K is greater than %D
The Stochastic %K is red when %K is less than %D
The oversold region is 0-20 and highlighted in a light green on the scale.
The overbought region is 80-100 and highlighted in light red on the scale.
Divergence Detection
The optional divergence detection settings include the selection of 3 oscillators: RSI, Stochastic, or Stochastic RSI (default). Regardless of which oscillator is selected for divergence detection the indicator will only show the Stochastic RSI's %K line. This gives the trader the change to see if divergence is present on multiple oscillators. The divergence detection does not draw trendlines on the chart or the lower indicator, instead it plots an H (for Hidden Divergence) or a D (for Divergence) in green (bullish) or red (bearish) where the 2nd point of divergence is located based on the oscillator used and whether the detection is set to strict or not. This programming will not capture every instance of divergence. You should still manually verify any divergence indicated.
Strict Divergence enabled is the traditional method of divergence detection where swing points on the price charts align with peaks and valleys on the oscillator. Where there are not matching peaks and valleys on both price and the oscillator, divergence is not detected.
Strict Divergence disabled is an alternate divergence detection by connecting swing points on the price chart and then checking to see what the corresponding oscillator values are regardless of if it is a peak or valley on the oscillator. To draw this method manually would be drawing the oscillator trendline through the %K line to connect which ever points on Stochastic RSI line up with the swing points on the price chart. This will find more divergence than would ordinarily be overlooked.
Asset Strength
The Strength indicator is the 2nd set of numbers on the indicator information line. Values above 0 are bullish, Values below 0 are bearish. Strength is measured by comparing fast and slow RSI calculations to gauge a rate of change towards bullish or bearish.
Strength color changes:
Dark green to light green = asset is bullish but getting weaker
Light green to dark green = asset is bullish and getting stronger
Red to pink = asset is bearish but getting stronger
Pink to Red = asset is bearish and getting weaker
Usage
Can be used in all asset classes. This is a Stochastic RSI oscillator so the same Stochastic RSI usage rules apply.
The ways that I use Stochastic RSI+:
1. To gauge if a zone is likely to hold or be broken.
- Buying zones have better confluence when Stochastic RSI+ is very oversold (0-5) and have bullish divergence.
- Selling zone have better confluence when Stochastic RSI+ is very overbought (95-100) and have bearish divergence.
2. For divergence to time entries and to identify continuations, retracements, reversals, and stop hunts.
3. For strength to see if the asset is getting stronger or weaker when price reaches a zone.

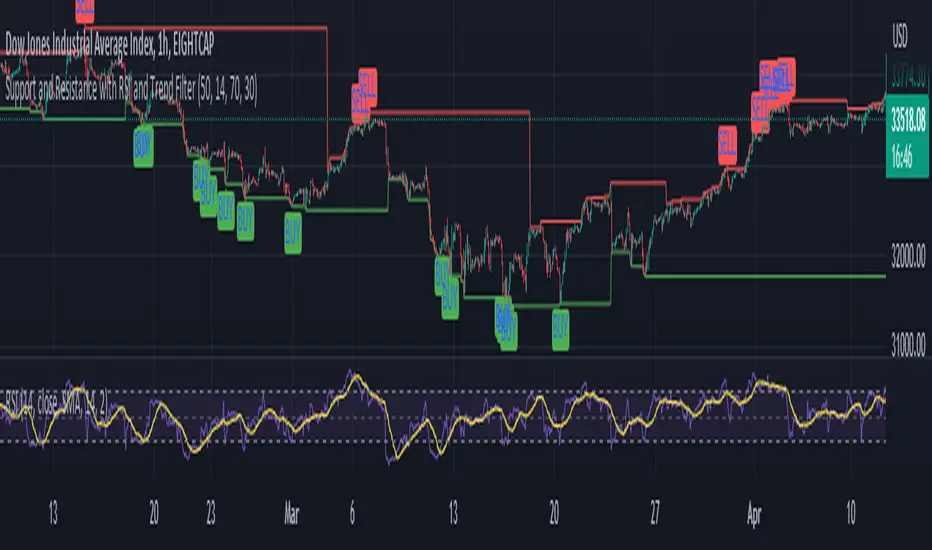
S & R RSi stratIn this updated version, a trend filter is applied using the Simple Moving Average (SMA) on the 4-hour timeframe. The trend is considered up when the 50-period SMA is below the 200-period SMA (ta.sma(trendFilterSource, 50) < ta.sma(trendFilterSource, 200)).
The buy condition (buyCondition) is triggered when the RSI crosses above the oversold threshold (ta.crossover(rsi, oversoldThreshold)), the trend filter confirms an uptrend (isUptrend is true), and the close price is greater than or equal to the support level (close >= supportLevel).
The sell condition (sellCondition) is triggered when the RSI crosses below the overbought threshold (ta.crossunder(rsi, overboughtThreshold)), the trend filter confirms a downtrend (isUptrend is false), and the close price is less than or equal to the resistance level (close <= resistanceLevel).
With this implementation, the signals will only be generated in the direction of the trend on the 4-hour timeframe.
RBX - RSI and StoRSIThis trading indicator on TradingView combines the Relative Strength Index (RSI) and Stochastic RSI, with a Donchian Channel applied to RSI to detect whether it is making new highs or lows. Additionally, it includes a function to detect a possible reversal candle during oversold/overbought conditions.
The RSI component of the indicator is configurable with inputs for RSI length, moving average type, and length. The Stochastic RSI component is also configurable with inputs for its length, as well as the smoothing parameters K and D.
The Donchian Channel is applied to the RSI component using two separate inputs for its high and low length. This can be used to identify whether RSI is making new highs or lows within a certain time period.
The oversold/overbought component of the indicator uses the Average True Range (ATR) to determine the size of candles, and identifies whether a candle is overextended based on a multiplier input. Users can also choose to use the RSI filter to look for potential reversal candles when the RSI falls below a certain value (oversold) or rises above a certain value (overbought).
The resulting signals are plotted on the chart, including the RSI upper and lower bands, the Stochastic-RSI upper and lower bands, the Stochastic-RSI K and D lines, and the RSI line itself, which is color-coded to indicate its level.

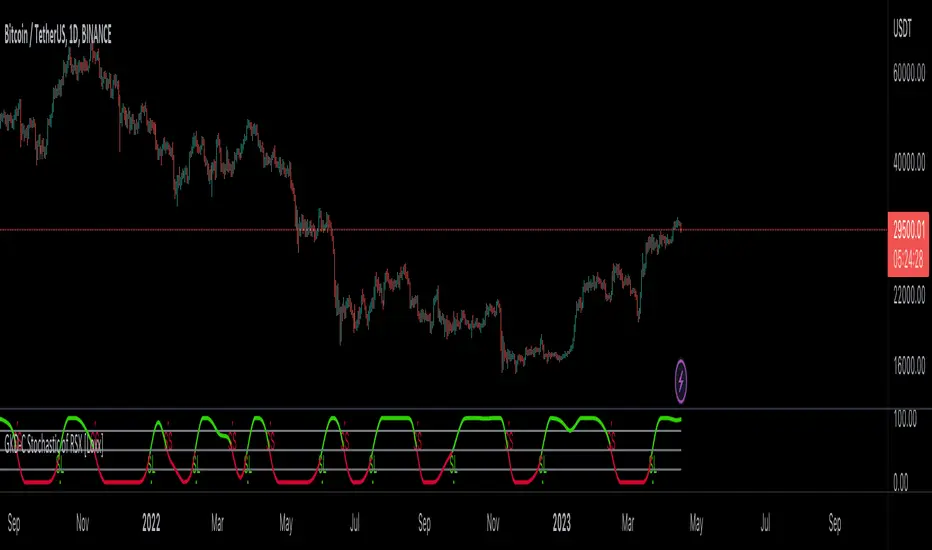
GKD-C Stochastic of RSX [Loxx]Giga Kaleidoscope GKD-C Stochastic of RSX is a Confirmation module included in Loxx's "Giga Kaleidoscope Modularized Trading System".
█ Giga Kaleidoscope Modularized Trading System
What is Loxx's "Giga Kaleidoscope Modularized Trading System"?
The Giga Kaleidoscope Modularized Trading System is a trading system built on the philosophy of the NNFX (No Nonsense Forex) algorithmic trading.
What is the NNFX algorithmic trading strategy?
The NNFX (No-Nonsense Forex) trading system is a comprehensive approach to Forex trading that is designed to simplify the process and remove the confusion and complexity that often surrounds trading. The system was developed by a Forex trader who goes by the pseudonym "VP" and has gained a significant following in the Forex community.
The NNFX trading system is based on a set of rules and guidelines that help traders make objective and informed decisions. These rules cover all aspects of trading, including market analysis, trade entry, stop loss placement, and trade management.
Here are the main components of the NNFX trading system:
1. Trading Philosophy: The NNFX trading system is based on the idea that successful trading requires a comprehensive understanding of the market, objective analysis, and strict risk management. The system aims to remove subjective elements from trading and focuses on objective rules and guidelines.
2. Technical Analysis: The NNFX trading system relies heavily on technical analysis and uses a range of indicators to identify high-probability trading opportunities. The system uses a combination of trend-following and mean-reverting strategies to identify trades.
3. Market Structure: The NNFX trading system emphasizes the importance of understanding the market structure, including price action, support and resistance levels, and market cycles. The system uses a range of tools to identify the market structure, including trend lines, channels, and moving averages.
4. Trade Entry: The NNFX trading system has strict rules for trade entry. The system uses a combination of technical indicators to identify high-probability trades, and traders must meet specific criteria to enter a trade.
5. Stop Loss Placement: The NNFX trading system places a significant emphasis on risk management and requires traders to place a stop loss order on every trade. The system uses a combination of technical analysis and market structure to determine the appropriate stop loss level.
6. Trade Management: The NNFX trading system has specific rules for managing open trades. The system aims to minimize risk and maximize profit by using a combination of trailing stops, take profit levels, and position sizing.
Overall, the NNFX trading system is designed to be a straightforward and easy-to-follow approach to Forex trading that can be applied by traders of all skill levels.
Core components of an NNFX algorithmic trading strategy
The NNFX algorithm is built on the principles of trend, momentum, and volatility. There are six core components in the NNFX trading algorithm:
1. Volatility - price volatility; e.g., Average True Range, True Range Double, Close-to-Close, etc.
2. Baseline - a moving average to identify price trend
3. Confirmation 1 - a technical indicator used to identify trends
4. Confirmation 2 - a technical indicator used to identify trends
5. Continuation - a technical indicator used to identify trends
6. Volatility/Volume - a technical indicator used to identify volatility/volume breakouts/breakdown
7. Exit - a technical indicator used to determine when a trend is exhausted
What is Volatility in the NNFX trading system?
In the NNFX (No Nonsense Forex) trading system, ATR (Average True Range) is typically used to measure the volatility of an asset. It is used as a part of the system to help determine the appropriate stop loss and take profit levels for a trade. ATR is calculated by taking the average of the true range values over a specified period.
True range is calculated as the maximum of the following values:
-Current high minus the current low
-Absolute value of the current high minus the previous close
-Absolute value of the current low minus the previous close
ATR is a dynamic indicator that changes with changes in volatility. As volatility increases, the value of ATR increases, and as volatility decreases, the value of ATR decreases. By using ATR in NNFX system, traders can adjust their stop loss and take profit levels according to the volatility of the asset being traded. This helps to ensure that the trade is given enough room to move, while also minimizing potential losses.
Other types of volatility include True Range Double (TRD), Close-to-Close, and Garman-Klass
What is a Baseline indicator?
The baseline is essentially a moving average, and is used to determine the overall direction of the market.
The baseline in the NNFX system is used to filter out trades that are not in line with the long-term trend of the market. The baseline is plotted on the chart along with other indicators, such as the Moving Average (MA), the Relative Strength Index (RSI), and the Average True Range (ATR).
Trades are only taken when the price is in the same direction as the baseline. For example, if the baseline is sloping upwards, only long trades are taken, and if the baseline is sloping downwards, only short trades are taken. This approach helps to ensure that trades are in line with the overall trend of the market, and reduces the risk of entering trades that are likely to fail.
By using a baseline in the NNFX system, traders can have a clear reference point for determining the overall trend of the market, and can make more informed trading decisions. The baseline helps to filter out noise and false signals, and ensures that trades are taken in the direction of the long-term trend.
What is a Confirmation indicator?
Confirmation indicators are technical indicators that are used to confirm the signals generated by primary indicators. Primary indicators are the core indicators used in the NNFX system, such as the Average True Range (ATR), the Moving Average (MA), and the Relative Strength Index (RSI).
The purpose of the confirmation indicators is to reduce false signals and improve the accuracy of the trading system. They are designed to confirm the signals generated by the primary indicators by providing additional information about the strength and direction of the trend.
Some examples of confirmation indicators that may be used in the NNFX system include the Bollinger Bands, the MACD (Moving Average Convergence Divergence), and the MACD Oscillator. These indicators can provide information about the volatility, momentum, and trend strength of the market, and can be used to confirm the signals generated by the primary indicators.
In the NNFX system, confirmation indicators are used in combination with primary indicators and other filters to create a trading system that is robust and reliable. By using multiple indicators to confirm trading signals, the system aims to reduce the risk of false signals and improve the overall profitability of the trades.
What is a Continuation indicator?
In the NNFX (No Nonsense Forex) trading system, a continuation indicator is a technical indicator that is used to confirm a current trend and predict that the trend is likely to continue in the same direction. A continuation indicator is typically used in conjunction with other indicators in the system, such as a baseline indicator, to provide a comprehensive trading strategy.
What is a Volatility/Volume indicator?
Volume indicators, such as the On Balance Volume (OBV), the Chaikin Money Flow (CMF), or the Volume Price Trend (VPT), are used to measure the amount of buying and selling activity in a market. They are based on the trading volume of the market, and can provide information about the strength of the trend. In the NNFX system, volume indicators are used to confirm trading signals generated by the Moving Average and the Relative Strength Index. Volatility indicators include Average Direction Index, Waddah Attar, and Volatility Ratio. In the NNFX trading system, volatility is a proxy for volume and vice versa.
By using volume indicators as confirmation tools, the NNFX trading system aims to reduce the risk of false signals and improve the overall profitability of trades. These indicators can provide additional information about the market that is not captured by the primary indicators, and can help traders to make more informed trading decisions. In addition, volume indicators can be used to identify potential changes in market trends and to confirm the strength of price movements.
What is an Exit indicator?
The exit indicator is used in conjunction with other indicators in the system, such as the Moving Average (MA), the Relative Strength Index (RSI), and the Average True Range (ATR), to provide a comprehensive trading strategy.
The exit indicator in the NNFX system can be any technical indicator that is deemed effective at identifying optimal exit points. Examples of exit indicators that are commonly used include the Parabolic SAR, the Average Directional Index (ADX), and the Chandelier Exit.
The purpose of the exit indicator is to identify when a trend is likely to reverse or when the market conditions have changed, signaling the need to exit a trade. By using an exit indicator, traders can manage their risk and prevent significant losses.
In the NNFX system, the exit indicator is used in conjunction with a stop loss and a take profit order to maximize profits and minimize losses. The stop loss order is used to limit the amount of loss that can be incurred if the trade goes against the trader, while the take profit order is used to lock in profits when the trade is moving in the trader's favor.
Overall, the use of an exit indicator in the NNFX trading system is an important component of a comprehensive trading strategy. It allows traders to manage their risk effectively and improve the profitability of their trades by exiting at the right time.
How does Loxx's GKD (Giga Kaleidoscope Modularized Trading System) implement the NNFX algorithm outlined above?
Loxx's GKD v1.0 system has five types of modules (indicators/strategies). These modules are:
1. GKD-BT - Backtesting module (Volatility, Number 1 in the NNFX algorithm)
2. GKD-B - Baseline module (Baseline and Volatility/Volume, Numbers 1 and 2 in the NNFX algorithm)
3. GKD-C - Confirmation 1/2 and Continuation module (Confirmation 1/2 and Continuation, Numbers 3, 4, and 5 in the NNFX algorithm)
4. GKD-V - Volatility/Volume module (Confirmation 1/2, Number 6 in the NNFX algorithm)
5. GKD-E - Exit module (Exit, Number 7 in the NNFX algorithm)
(additional module types will added in future releases)
Each module interacts with every module by passing data between modules. Data is passed between each module as described below:
GKD-B => GKD-V => GKD-C(1) => GKD-C(2) => GKD-C(Continuation) => GKD-E => GKD-BT
That is, the Baseline indicator passes its data to Volatility/Volume. The Volatility/Volume indicator passes its values to the Confirmation 1 indicator. The Confirmation 1 indicator passes its values to the Confirmation 2 indicator. The Confirmation 2 indicator passes its values to the Continuation indicator. The Continuation indicator passes its values to the Exit indicator, and finally, the Exit indicator passes its values to the Backtest strategy.
This chaining of indicators requires that each module conform to Loxx's GKD protocol, therefore allowing for the testing of every possible combination of technical indicators that make up the six components of the NNFX algorithm.
What does the application of the GKD trading system look like?
Example trading system:
Backtest: Strategy with 1-3 take profits, trailing stop loss, multiple types of PnL volatility, and 2 backtesting styles
Baseline: Hull Moving Average
Volatility/Volume: Hurst Exponent
Confirmation 1: Stochastic of RSX as shown on the chart above
Confirmation 2: Williams Percent Range
Continuation: Fisher Transform
Exit: Rex Oscillator
Each GKD indicator is denoted with a module identifier of either: GKD-BT, GKD-B, GKD-C, GKD-V, or GKD-E. This allows traders to understand to which module each indicator belongs and where each indicator fits into the GKD protocol chain.
Giga Kaleidoscope Modularized Trading System Signals (based on the NNFX algorithm)
Standard Entry
1. GKD-C Confirmation 1 Signal
2. GKD-B Baseline agrees
3. Price is within a range of 0.2x Volatility and 1.0x Volatility of the Goldie Locks Mean
4. GKD-C Confirmation 2 agrees
5. GKD-V Volatility/Volume agrees
Baseline Entry
1. GKD-B Baseline signal
2. GKD-C Confirmation 1 agrees
3. Price is within a range of 0.2x Volatility and 1.0x Volatility of the Goldie Locks Mean
4. GKD-C Confirmation 2 agrees
5. GKD-V Volatility/Volume agrees
6. GKD-C Confirmation 1 signal was less than 7 candles prior
Volatility/Volume Entry
1. GKD-V Volatility/Volume signal
2. GKD-C Confirmation 1 agrees
3. Price is within a range of 0.2x Volatility and 1.0x Volatility of the Goldie Locks Mean
4. GKD-C Confirmation 2 agrees
5. GKD-B Baseline agrees
6. GKD-C Confirmation 1 signal was less than 7 candles prior
Continuation Entry
1. Standard Entry, Baseline Entry, or Pullback; entry triggered previously
2. GKD-B Baseline hasn't crossed since entry signal trigger
3. GKD-C Confirmation Continuation Indicator signals
4. GKD-C Confirmation 1 agrees
5. GKD-B Baseline agrees
6. GKD-C Confirmation 2 agrees
1-Candle Rule Standard Entry
1. GKD-C Confirmation 1 signal
2. GKD-B Baseline agrees
3. Price is within a range of 0.2x Volatility and 1.0x Volatility of the Goldie Locks Mean
Next Candle:
1. Price retraced (Long: close < close or Short: close > close )
2. GKD-B Baseline agrees
3. GKD-C Confirmation 1 agrees
4. GKD-C Confirmation 2 agrees
5. GKD-V Volatility/Volume agrees
1-Candle Rule Baseline Entry
1. GKD-B Baseline signal
2. GKD-C Confirmation 1 agrees
3. Price is within a range of 0.2x Volatility and 1.0x Volatility of the Goldie Locks Mean
4. GKD-C Confirmation 1 signal was less than 7 candles prior
Next Candle:
1. Price retraced (Long: close < close or Short: close > close )
2. GKD-B Baseline agrees
3. GKD-C Confirmation 1 agrees
4. GKD-C Confirmation 2 agrees
5. GKD-V Volatility/Volume Agrees
1-Candle Rule Volatility/Volume Entry
1. GKD-V Volatility/Volume signal
2. GKD-C Confirmation 1 agrees
3. Price is within a range of 0.2x Volatility and 1.0x Volatility of the Goldie Locks Mean
4. GKD-C Confirmation 1 signal was less than 7 candles prior
Next Candle:
1. Price retraced (Long: close < close or Short: close > close)
2. GKD-B Volatility/Volume agrees
3. GKD-C Confirmation 1 agrees
4. GKD-C Confirmation 2 agrees
5. GKD-B Baseline agrees
PullBack Entry
1. GKD-B Baseline signal
2. GKD-C Confirmation 1 agrees
3. Price is beyond 1.0x Volatility of Baseline
Next Candle:
1. Price is within a range of 0.2x Volatility and 1.0x Volatility of the Goldie Locks Mean
2. GKD-C Confirmation 1 agrees
3. GKD-C Confirmation 2 agrees
4. GKD-V Volatility/Volume Agrees
]█ Setting up the GKD
The GKD system involves chaining indicators together. These are the steps to set this up.
Use a GKD-C indicator alone on a chart
1. Inside the GKD-C indicator, change the "Confirmation Type" setting to "Solo Confirmation Simple"
Use a GKD-V indicator alone on a chart
**nothing, it's already useable on the chart without any settings changes
Use a GKD-B indicator alone on a chart
**nothing, it's already useable on the chart without any settings changes
Baseline (Baseline, Backtest)
1. Import the GKD-B Baseline into the GKD-BT Backtest: "Input into Volatility/Volume or Backtest (Baseline testing)"
2. Inside the GKD-BT Backtest, change the setting "Backtest Special" to "Baseline"
Volatility/Volume (Volatility/Volume, Backte st)
1. Inside the GKD-V indicator, change the "Testing Type" setting to "Solo"
2. Inside the GKD-V indicator, change the "Signal Type" setting to "Crossing" (neither traditional nor both can be backtested)
3. Import the GKD-V indicator into the GKD-BT Backtest: "Input into C1 or Backtest"
4. Inside the GKD-BT Backtest, change the setting "Backtest Special" to "Volatility/Volume"
5. Inside the GKD-BT Backtest, a) change the setting "Backtest Type" to "Trading" if using a directional GKD-V indicator; or, b) change the setting "Backtest Type" to "Full" if using a directional or non-directional GKD-V indicator (non-directional GKD-V can only test Longs and Shorts separately)
6. If "Backtest Type" is set to "Full": Inside the GKD-BT Backtest, change the setting "Backtest Side" to "Long" or "Short
7. If "Backtest Type" is set to "Full": To allow the system to open multiple orders at one time so you test all Longs or Shorts, open the GKD-BT Backtest, click the tab "Properties" and then insert a value of something like 10 orders into the "Pyramiding" settings. This will allow 10 orders to be opened at one time which should be enough to catch all possible Longs or Shorts.
Solo Confirmation Simple (Confirmation, Backtest)
1. Inside the GKD-C indicator, change the "Confirmation Type" setting to "Solo Confirmation Simple"
1. Import the GKD-C indicator into the GKD-BT Backtest: "Input into Backtest"
2. Inside the GKD-BT Backtest, change the setting "Backtest Special" to "Solo Confirmation Simple"
Solo Confirmation Complex without Exits (Baseline, Volatility/Volume, Confirmation, Backtest)
1. Inside the GKD-V indicator, change the "Testing Type" setting to "Chained"
2. Import the GKD-B Baseline into the GKD-V indicator: "Input into Volatility/Volume or Backtest (Baseline testing)"
3. Inside the GKD-C indicator, change the "Confirmation Type" setting to "Solo Confirmation Complex"
4. Import the GKD-V indicator into the GKD-C indicator: "Input into C1 or Backtest"
5. Inside the GKD-BT Backtest, change the setting "Backtest Special" to "GKD Full wo/ Exits"
6. Import the GKD-C into the GKD-BT Backtest: "Input into Exit or Backtest"
Solo Confirmation Complex with Exits (Baseline, Volatility/Volume, Confirmation, Exit, Backtest)
1. Inside the GKD-V indicator, change the "Testing Type" setting to "Chained"
2. Import the GKD-B Baseline into the GKD-V indicator: "Input into Volatility/Volume or Backtest (Baseline testing)"
3. Inside the GKD-C indicator, change the "Confirmation Type" setting to "Solo Confirmation Complex"
4. Import the GKD-V indicator into the GKD-C indicator: "Input into C1 or Backtest"
5. Import the GKD-C indicator into the GKD-E indicator: "Input into Exit"
6. Inside the GKD-BT Backtest, change the setting "Backtest Special" to "GKD Full w/ Exits"
7. Import the GKD-E into the GKD-BT Backtest: "Input into Backtest"
Full GKD without Exits (Baseline, Volatility/Volume, Confirmation 1, Confirmation 2, Continuation, Backtest)
1. Inside the GKD-V indicator, change the "Testing Type" setting to "Chained"
2. Import the GKD-B Baseline into the GKD-V indicator: "Input into Volatility/Volume or Backtest (Baseline testing)"
3. Inside the GKD-C 1 indicator, change the "Confirmation Type" setting to "Confirmation 1"
4. Import the GKD-V indicator into the GKD-C 1 indicator: "Input into C1 or Backtest"
5. Inside the GKD-C 2 indicator, change the "Confirmation Type" setting to "Confirmation 2"
6. Import the GKD-C 1 indicator into the GKD-C 2 indicator: "Input into C2"
7. Inside the GKD-C Continuation indicator, change the "Confirmation Type" setting to "Continuation"
8. Inside the GKD-BT Backtest, change the setting "Backtest Special" to "GKD Full wo/ Exits"
9. Import the GKD-E into the GKD-BT Backtest: "Input into Exit or Backtest"
Full GKD with Exits (Baseline, Volatility/Volume, Confirmation 1, Confirmation 2, Continuation, Exit, Backtest)
1. Inside the GKD-V indicator, change the "Testing Type" setting to "Chained"
2. Import the GKD-B Baseline into the GKD-V indicator: "Input into Volatility/Volume or Backtest (Baseline testing)"
3. Inside the GKD-C 1 indicator, change the "Confirmation Type" setting to "Confirmation 1"
4. Import the GKD-V indicator into the GKD-C 1 indicator: "Input into C1 or Backtest"
5. Inside the GKD-C 2 indicator, change the "Confirmation Type" setting to "Confirmation 2"
6. Import the GKD-C 1 indicator into the GKD-C 2 indicator: "Input into C2"
7. Inside the GKD-C Continuation indicator, change the "Confirmation Type" setting to "Continuation"
8. Import the GKD-C Continuation indicator into the GKD-E indicator: "Input into Exit"
9. Inside the GKD-BT Backtest, change the setting "Backtest Special" to "GKD Full w/ Exits"
10. Import the GKD-E into the GKD-BT Backtest: "Input into Backtest"
Baseline + Volatility/Volume (Baseline, Volatility/Volume, Backtest)
1. Inside the GKD-V indicator, change the "Testing Type" setting to "Baseline + Volatility/Volume"
2. Inside the GKD-V indicator, make sure the "Signal Type" setting is set to "Traditional"
3. Import the GKD-B Baseline into the GKD-V indicator: "Input into Volatility/Volume or Backtest (Baseline testing)"
4. Inside the GKD-BT Backtest, change the setting "Backtest Special" to "Baseline + Volatility/Volume"
5. Import the GKD-V into the GKD-BT Backtest: "Input into C1 or Backtest"
6. Inside the GKD-BT Backtest, change the setting "Backtest Type" to "Full". For this backtest, you must test Longs and Shorts separately
7. To allow the system to open multiple orders at one time so you can test all Longs or Shorts, open the GKD-BT Backtest, click the tab "Properties" and then insert a value of something like 10 orders into the "Pyramiding" settings. This will allow 10 orders to be opened at one time which should be enough to catch all possible Longs or Shorts.
█ GKD-C Stochastic of RSX
What is the RSX?
The Jurik RSX is a technical indicator developed by Mark Jurik to measure the momentum and strength of price movements in financial markets, such as stocks, commodities, and currencies. It is an advanced version of the traditional Relative Strength Index (RSI), designed to offer smoother and less lagging signals compared to the standard RSI.
The main advantage of the Jurik RSX is that it provides more accurate and timely signals for traders and analysts, thanks to its improved calculation methods that reduce noise and lag in the indicator's output. This enables better decision-making when analyzing market trends and potential trading opportunities.
What is Stochastic RSI?
Stochastic RSI (StochRSI) is a technical analysis indicator that combines the concepts of the Stochastic Oscillator and the Relative Strength Index (RSI). It is used to identify potential overbought and oversold conditions in financial markets, as well as to generate buy and sell signals based on the momentum of price movements.
To understand Stochastic RSI, let's first define the two individual indicators it is based on:
Stochastic Oscillator: A momentum indicator that compares a particular closing price of a security to a range of its prices over a certain period. It is used to identify potential trend reversals and generate buy and sell signals.
Relative Strength Index (RSI): A momentum oscillator that measures the speed and change of price movements. It ranges between 0 and 100 and is used to identify overbought or oversold conditions in the market.
Now, let's dive into the Stochastic RSI:
The Stochastic RSI applies the Stochastic Oscillator formula to the RSI values, essentially creating an indicator of an indicator. It helps to identify when the RSI is in overbought or oversold territory with more sensitivity, providing more frequent signals than the standalone RSI.
The formula for StochRSI is as follows:
StochRSI = (RSI - Lowest Low RSI) / (Highest High RSI - Lowest Low RSI)
Where:
RSI is the current RSI value.
Lowest Low RSI is the lowest RSI value over a specified period (e.g., 14 days).
Highest High RSI is the highest RSI value over the same specified period.
StochRSI ranges from 0 to 1, but it is usually multiplied by 100 for easier interpretation, making the range 0 to 100. Like the RSI, values close to 0 indicate oversold conditions, while values close to 100 indicate overbought conditions. However, since the StochRSI is more sensitive, traders typically use 20 as the oversold threshold and 80 as the overbought threshold.
Traders use the StochRSI to generate buy and sell signals by looking for crossovers with a signal line (a moving average of the StochRSI), similar to the way the Stochastic Oscillator is used. When the StochRSI crosses above the signal line, it is considered a bullish signal, and when it crosses below the signal line, it is considered a bearish signal.
It is essential to use the Stochastic RSI in conjunction with other technical analysis tools and indicators, as well as to consider the overall market context, to improve the accuracy and reliability of trading signals.
What is the Stochastic of RSX?
Instead of using RSI for the Stochastic RSI calculation, this indicator uses RSX.
Requirements
Inputs
Confirmation 1: GKD-V Volatility / Volume indicator
Confirmation 2: GKD-C Confirmation indicator
Continuation: GKD-C Confirmation indicator
Solo Confirmation Simple: GKD-B Baseline
Solo Confirmation Complex: GKD-V Volatility / Volume indicator
Solo Confirmation Super Complex: GKD-V Volatility / Volume indicator
Stacked 1: None
Stacked 2+: GKD-C, GKD-V, or GKD-B Stacked 1
Outputs
Confirmation 1: GKD-C Confirmation 2 indicator
Confirmation 2: GKD-C Continuation indicator
Continuation: GKD-E Exit indicator
Solo Confirmation Simple: GKD-BT Backtest
Solo Confirmation Complex: GKD-BT Backtest or GKD-E Exit indicator
Solo Confirmation Super Complex: GKD-C Continuation indicator
Stacked 1: GKD-C, GKD-V, or GKD-B Stacked 2+
Stacked 2+: GKD-C, GKD-V, or GKD-B Stacked 2+ or GKD-BT Backtest
Additional features will be added in future releases.
Stochastic RSI of Smoothed Price [Loxx]What is Stochastic RSI of Smoothed Price?
This indicator is just as it's title suggests. There are six different signal types, various price smoothing types, and seven types of RSI.
This indicator contains 7 different types of RSI:
RSX
Regular
Slow
Rapid
Harris
Cuttler
Ehlers Smoothed
What is RSI?
RSI stands for Relative Strength Index . It is a technical indicator used to measure the strength or weakness of a financial instrument's price action.
The RSI is calculated based on the price movement of an asset over a specified period of time, typically 14 days, and is expressed on a scale of 0 to 100. The RSI is considered overbought when it is above 70 and oversold when it is below 30.
Traders and investors use the RSI to identify potential buy and sell signals. When the RSI indicates that an asset is oversold, it may be considered a buying opportunity, while an overbought RSI may signal that it is time to sell or take profits.
It's important to note that the RSI should not be used in isolation and should be used in conjunction with other technical and fundamental analysis tools to make informed trading decisions.
What is RSX?
Jurik RSX is a technical analysis indicator that is a variation of the Relative Strength Index Smoothed ( RSX ) indicator. It was developed by Mark Jurik and is designed to help traders identify trends and momentum in the market.
The Jurik RSX uses a combination of the RSX indicator and an adaptive moving average (AMA) to smooth out the price data and reduce the number of false signals. The adaptive moving average is designed to adjust the smoothing period based on the current market conditions, which makes the indicator more responsive to changes in price.
The Jurik RSX can be used to identify potential trend reversals and momentum shifts in the market. It oscillates between 0 and 100, with values above 50 indicating a bullish trend and values below 50 indicating a bearish trend . Traders can use these levels to make trading decisions, such as buying when the indicator crosses above 50 and selling when it crosses below 50.
The Jurik RSX is a more advanced version of the RSX indicator, and while it can be useful in identifying potential trade opportunities, it should not be used in isolation. It is best used in conjunction with other technical and fundamental analysis tools to make informed trading decisions.
What is Slow RSI?
Slow RSI is a variation of the traditional Relative Strength Index ( RSI ) indicator. It is a more smoothed version of the RSI and is designed to filter out some of the noise and short-term price fluctuations that can occur with the standard RSI .
The Slow RSI uses a longer period of time than the traditional RSI , typically 21 periods instead of 14. This longer period helps to smooth out the price data and makes the indicator less reactive to short-term price fluctuations.
Like the traditional RSI , the Slow RSI is used to identify potential overbought and oversold conditions in the market. It oscillates between 0 and 100, with values above 70 indicating overbought conditions and values below 30 indicating oversold conditions. Traders often use these levels as potential buy and sell signals.
The Slow RSI is a more conservative version of the RSI and can be useful in identifying longer-term trends in the market. However, it can also be slower to respond to changes in price, which may result in missed trading opportunities. Traders may choose to use a combination of both the Slow RSI and the traditional RSI to make informed trading decisions.
What is Rapid RSI?
Same as regular RSI but with a faster calculation method
What is Harris RSI?
Harris RSI is a technical analysis indicator that is a variation of the Relative Strength Index ( RSI ). It was developed by Larry Harris and is designed to help traders identify potential trend changes and momentum shifts in the market.
The Harris RSI uses a different calculation formula compared to the traditional RSI . It takes into account both the opening and closing prices of a financial instrument, as well as the high and low prices. The Harris RSI is also normalized to a range of 0 to 100, with values above 50 indicating a bullish trend and values below 50 indicating a bearish trend .
Like the traditional RSI , the Harris RSI is used to identify potential overbought and oversold conditions in the market. It oscillates between 0 and 100, with values above 70 indicating overbought conditions and values below 30 indicating oversold conditions. Traders often use these levels as potential buy and sell signals.
The Harris RSI is a more advanced version of the RSI and can be useful in identifying longer-term trends in the market. However, it can also generate more false signals than the standard RSI . Traders may choose to use a combination of both the Harris RSI and the traditional RSI to make informed trading decisions.
What is Cuttler RSI?
Cuttler RSI is a technical analysis indicator that is a variation of the Relative Strength Index ( RSI ). It was developed by Curt Cuttler and is designed to help traders identify potential trend changes and momentum shifts in the market.
The Cuttler RSI uses a different calculation formula compared to the traditional RSI . It takes into account the difference between the closing price of a financial instrument and the average of the high and low prices over a specified period of time. This difference is then normalized to a range of 0 to 100, with values above 50 indicating a bullish trend and values below 50 indicating a bearish trend .
Like the traditional RSI , the Cuttler RSI is used to identify potential overbought and oversold conditions in the market. It oscillates between 0 and 100, with values above 70 indicating overbought conditions and values below 30 indicating oversold conditions. Traders often use these levels as potential buy and sell signals.
The Cuttler RSI is a more advanced version of the RSI and can be useful in identifying longer-term trends in the market. However, it can also generate more false signals than the standard RSI . Traders may choose to use a combination of both the Cuttler RSI and the traditional RSI to make informed trading decisions.
What is Ehlers Smoothed RSI?
Ehlers smoothed RSI is a technical analysis indicator that is a variation of the Relative Strength Index ( RSI ). It was developed by John Ehlers and is designed to help traders identify potential trend changes and momentum shifts in the market.
The Ehlers smoothed RSI uses a different calculation formula compared to the traditional RSI . It uses a smoothing algorithm that is designed to reduce the noise and random fluctuations that can occur with the standard RSI . The smoothing algorithm is based on a concept called "digital signal processing" and is intended to improve the accuracy of the indicator.
Like the traditional RSI , the Ehlers smoothed RSI is used to identify potential overbought and oversold conditions in the market. It oscillates between 0 and 100, with values above 70 indicating overbought conditions and values below 30 indicating oversold conditions. Traders often use these levels as potential buy and sell signals.
The Ehlers smoothed RSI can be useful in identifying longer-term trends and momentum shifts in the market. However, it can also generate more false signals than the standard RSI . Traders may choose to use a combination of both the Ehlers smoothed RSI and the traditional RSI to make informed trading decisions.
What is Stochastic RSI?
Stochastic RSI (StochRSI) is a technical analysis indicator that combines the concepts of the Stochastic Oscillator and the Relative Strength Index (RSI). It is used to identify potential overbought and oversold conditions in financial markets, as well as to generate buy and sell signals based on the momentum of price movements.
To understand Stochastic RSI, let's first define the two individual indicators it is based on:
Stochastic Oscillator: A momentum indicator that compares a particular closing price of a security to a range of its prices over a certain period. It is used to identify potential trend reversals and generate buy and sell signals.
Relative Strength Index (RSI): A momentum oscillator that measures the speed and change of price movements. It ranges between 0 and 100 and is used to identify overbought or oversold conditions in the market.
Now, let's dive into the Stochastic RSI:
The Stochastic RSI applies the Stochastic Oscillator formula to the RSI values, essentially creating an indicator of an indicator. It helps to identify when the RSI is in overbought or oversold territory with more sensitivity, providing more frequent signals than the standalone RSI.
The formula for StochRSI is as follows:
StochRSI = (RSI - Lowest Low RSI) / (Highest High RSI - Lowest Low RSI)
Where:
RSI is the current RSI value.
Lowest Low RSI is the lowest RSI value over a specified period (e.g., 14 days).
Highest High RSI is the highest RSI value over the same specified period.
StochRSI ranges from 0 to 1, but it is usually multiplied by 100 for easier interpretation, making the range 0 to 100. Like the RSI, values close to 0 indicate oversold conditions, while values close to 100 indicate overbought conditions. However, since the StochRSI is more sensitive, traders typically use 20 as the oversold threshold and 80 as the overbought threshold.
Traders use the StochRSI to generate buy and sell signals by looking for crossovers with a signal line (a moving average of the StochRSI), similar to the way the Stochastic Oscillator is used. When the StochRSI crosses above the signal line, it is considered a bullish signal, and when it crosses below the signal line, it is considered a bearish signal.
It is essential to use the Stochastic RSI in conjunction with other technical analysis tools and indicators, as well as to consider the overall market context, to improve the accuracy and reliability of trading signals.
Signal types included are the following;
Fixed Levels
Floating Levels
Quantile Levels
Fixed Middle
Floating Middle
Quantile Middle
Extras
Alerts
Bar coloring
Loxx's Expanded Source Types

GKD-C Stochastic RSI of Smoothed Price [Loxx]Giga Kaleidoscope GKD-C Stochastic RSI of Smoothed Price is a Confirmation module included in Loxx's "Giga Kaleidoscope Modularized Trading System".
█ Giga Kaleidoscope Modularized Trading System
What is Loxx's "Giga Kaleidoscope Modularized Trading System"?
The Giga Kaleidoscope Modularized Trading System is a trading system built on the philosophy of the NNFX (No Nonsense Forex) algorithmic trading.
What is the NNFX algorithmic trading strategy?
The NNFX (No-Nonsense Forex) trading system is a comprehensive approach to Forex trading that is designed to simplify the process and remove the confusion and complexity that often surrounds trading. The system was developed by a Forex trader who goes by the pseudonym "VP" and has gained a significant following in the Forex community.
The NNFX trading system is based on a set of rules and guidelines that help traders make objective and informed decisions. These rules cover all aspects of trading, including market analysis, trade entry, stop loss placement, and trade management.
Here are the main components of the NNFX trading system:
1. Trading Philosophy: The NNFX trading system is based on the idea that successful trading requires a comprehensive understanding of the market, objective analysis, and strict risk management. The system aims to remove subjective elements from trading and focuses on objective rules and guidelines.
2. Technical Analysis: The NNFX trading system relies heavily on technical analysis and uses a range of indicators to identify high-probability trading opportunities. The system uses a combination of trend-following and mean-reverting strategies to identify trades.
3. Market Structure: The NNFX trading system emphasizes the importance of understanding the market structure, including price action, support and resistance levels, and market cycles. The system uses a range of tools to identify the market structure, including trend lines, channels, and moving averages.
4. Trade Entry: The NNFX trading system has strict rules for trade entry. The system uses a combination of technical indicators to identify high-probability trades, and traders must meet specific criteria to enter a trade.
5. Stop Loss Placement: The NNFX trading system places a significant emphasis on risk management and requires traders to place a stop loss order on every trade. The system uses a combination of technical analysis and market structure to determine the appropriate stop loss level.
6. Trade Management: The NNFX trading system has specific rules for managing open trades. The system aims to minimize risk and maximize profit by using a combination of trailing stops, take profit levels, and position sizing.
Overall, the NNFX trading system is designed to be a straightforward and easy-to-follow approach to Forex trading that can be applied by traders of all skill levels.
Core components of an NNFX algorithmic trading strategy
The NNFX algorithm is built on the principles of trend, momentum, and volatility. There are six core components in the NNFX trading algorithm:
1. Volatility - price volatility; e.g., Average True Range, True Range Double, Close-to-Close, etc.
2. Baseline - a moving average to identify price trend
3. Confirmation 1 - a technical indicator used to identify trends
4. Confirmation 2 - a technical indicator used to identify trends
5. Continuation - a technical indicator used to identify trends
6. Volatility/Volume - a technical indicator used to identify volatility/volume breakouts/breakdown
7. Exit - a technical indicator used to determine when a trend is exhausted
What is Volatility in the NNFX trading system?
In the NNFX (No Nonsense Forex) trading system, ATR (Average True Range) is typically used to measure the volatility of an asset. It is used as a part of the system to help determine the appropriate stop loss and take profit levels for a trade. ATR is calculated by taking the average of the true range values over a specified period.
True range is calculated as the maximum of the following values:
-Current high minus the current low
-Absolute value of the current high minus the previous close
-Absolute value of the current low minus the previous close
ATR is a dynamic indicator that changes with changes in volatility. As volatility increases, the value of ATR increases, and as volatility decreases, the value of ATR decreases. By using ATR in NNFX system, traders can adjust their stop loss and take profit levels according to the volatility of the asset being traded. This helps to ensure that the trade is given enough room to move, while also minimizing potential losses.
Other types of volatility include True Range Double (TRD), Close-to-Close, and Garman-Klass
What is a Baseline indicator?
The baseline is essentially a moving average, and is used to determine the overall direction of the market.
The baseline in the NNFX system is used to filter out trades that are not in line with the long-term trend of the market. The baseline is plotted on the chart along with other indicators, such as the Moving Average (MA), the Relative Strength Index (RSI), and the Average True Range (ATR).
Trades are only taken when the price is in the same direction as the baseline. For example, if the baseline is sloping upwards, only long trades are taken, and if the baseline is sloping downwards, only short trades are taken. This approach helps to ensure that trades are in line with the overall trend of the market, and reduces the risk of entering trades that are likely to fail.
By using a baseline in the NNFX system, traders can have a clear reference point for determining the overall trend of the market, and can make more informed trading decisions. The baseline helps to filter out noise and false signals, and ensures that trades are taken in the direction of the long-term trend.
What is a Confirmation indicator?
Confirmation indicators are technical indicators that are used to confirm the signals generated by primary indicators. Primary indicators are the core indicators used in the NNFX system, such as the Average True Range (ATR), the Moving Average (MA), and the Relative Strength Index (RSI).
The purpose of the confirmation indicators is to reduce false signals and improve the accuracy of the trading system. They are designed to confirm the signals generated by the primary indicators by providing additional information about the strength and direction of the trend.
Some examples of confirmation indicators that may be used in the NNFX system include the Bollinger Bands, the MACD (Moving Average Convergence Divergence), and the MACD Oscillator. These indicators can provide information about the volatility, momentum, and trend strength of the market, and can be used to confirm the signals generated by the primary indicators.
In the NNFX system, confirmation indicators are used in combination with primary indicators and other filters to create a trading system that is robust and reliable. By using multiple indicators to confirm trading signals, the system aims to reduce the risk of false signals and improve the overall profitability of the trades.
What is a Continuation indicator?
In the NNFX (No Nonsense Forex) trading system, a continuation indicator is a technical indicator that is used to confirm a current trend and predict that the trend is likely to continue in the same direction. A continuation indicator is typically used in conjunction with other indicators in the system, such as a baseline indicator, to provide a comprehensive trading strategy.
What is a Volatility/Volume indicator?
Volume indicators, such as the On Balance Volume (OBV), the Chaikin Money Flow (CMF), or the Volume Price Trend (VPT), are used to measure the amount of buying and selling activity in a market. They are based on the trading volume of the market, and can provide information about the strength of the trend. In the NNFX system, volume indicators are used to confirm trading signals generated by the Moving Average and the Relative Strength Index. Volatility indicators include Average Direction Index, Waddah Attar, and Volatility Ratio. In the NNFX trading system, volatility is a proxy for volume and vice versa.
By using volume indicators as confirmation tools, the NNFX trading system aims to reduce the risk of false signals and improve the overall profitability of trades. These indicators can provide additional information about the market that is not captured by the primary indicators, and can help traders to make more informed trading decisions. In addition, volume indicators can be used to identify potential changes in market trends and to confirm the strength of price movements.
What is an Exit indicator?
The exit indicator is used in conjunction with other indicators in the system, such as the Moving Average (MA), the Relative Strength Index (RSI), and the Average True Range (ATR), to provide a comprehensive trading strategy.
The exit indicator in the NNFX system can be any technical indicator that is deemed effective at identifying optimal exit points. Examples of exit indicators that are commonly used include the Parabolic SAR, the Average Directional Index (ADX), and the Chandelier Exit.
The purpose of the exit indicator is to identify when a trend is likely to reverse or when the market conditions have changed, signaling the need to exit a trade. By using an exit indicator, traders can manage their risk and prevent significant losses.
In the NNFX system, the exit indicator is used in conjunction with a stop loss and a take profit order to maximize profits and minimize losses. The stop loss order is used to limit the amount of loss that can be incurred if the trade goes against the trader, while the take profit order is used to lock in profits when the trade is moving in the trader's favor.
Overall, the use of an exit indicator in the NNFX trading system is an important component of a comprehensive trading strategy. It allows traders to manage their risk effectively and improve the profitability of their trades by exiting at the right time.
How does Loxx's GKD (Giga Kaleidoscope Modularized Trading System) implement the NNFX algorithm outlined above?
Loxx's GKD v1.0 system has five types of modules (indicators/strategies). These modules are:
1. GKD-BT - Backtesting module (Volatility, Number 1 in the NNFX algorithm)
2. GKD-B - Baseline module (Baseline and Volatility/Volume, Numbers 1 and 2 in the NNFX algorithm)
3. GKD-C - Confirmation 1/2 and Continuation module (Confirmation 1/2 and Continuation, Numbers 3, 4, and 5 in the NNFX algorithm)
4. GKD-V - Volatility/Volume module (Confirmation 1/2, Number 6 in the NNFX algorithm)
5. GKD-E - Exit module (Exit, Number 7 in the NNFX algorithm)
(additional module types will added in future releases)
Each module interacts with every module by passing data between modules. Data is passed between each module as described below:
GKD-B => GKD-V => GKD-C(1) => GKD-C(2) => GKD-C(Continuation) => GKD-E => GKD-BT
That is, the Baseline indicator passes its data to Volatility/Volume. The Volatility/Volume indicator passes its values to the Confirmation 1 indicator. The Confirmation 1 indicator passes its values to the Confirmation 2 indicator. The Confirmation 2 indicator passes its values to the Continuation indicator. The Continuation indicator passes its values to the Exit indicator, and finally, the Exit indicator passes its values to the Backtest strategy.
This chaining of indicators requires that each module conform to Loxx's GKD protocol, therefore allowing for the testing of every possible combination of technical indicators that make up the six components of the NNFX algorithm.
What does the application of the GKD trading system look like?
Example trading system:
Backtest: Strategy with 1-3 take profits, trailing stop loss, multiple types of PnL volatility, and 2 backtesting styles
Baseline: Hull Moving Average
Volatility/Volume: Hurst Exponent
Confirmation 1: Stochastic RSI of Smoothed Price as shown on the chart above
Confirmation 2: Williams Percent Range
Continuation: Fisher Transform
Exit: Rex Oscillator
Each GKD indicator is denoted with a module identifier of either: GKD-BT, GKD-B, GKD-C, GKD-V, or GKD-E. This allows traders to understand to which module each indicator belongs and where each indicator fits into the GKD protocol chain.
Giga Kaleidoscope Modularized Trading System Signals (based on the NNFX algorithm)
Standard Entry
1. GKD-C Confirmation 1 Signal
2. GKD-B Baseline agrees
3. Price is within a range of 0.2x Volatility and 1.0x Volatility of the Goldie Locks Mean
4. GKD-C Confirmation 2 agrees
5. GKD-V Volatility/Volume agrees
Baseline Entry
1. GKD-B Baseline signal
2. GKD-C Confirmation 1 agrees
3. Price is within a range of 0.2x Volatility and 1.0x Volatility of the Goldie Locks Mean
4. GKD-C Confirmation 2 agrees
5. GKD-V Volatility/Volume agrees
6. GKD-C Confirmation 1 signal was less than 7 candles prior
Continuation Entry
1. Standard Entry, Baseline Entry, or Pullback; entry triggered previously
2. GKD-B Baseline hasn't crossed since entry signal trigger
3. GKD-C Confirmation Continuation Indicator signals
4. GKD-C Confirmation 1 agrees
5. GKD-B Baseline agrees
6. GKD-C Confirmation 2 agrees
1-Candle Rule Standard Entry
1. GKD-C Confirmation 1 signal
2. GKD-B Baseline agrees
3. Price is within a range of 0.2x Volatility and 1.0x Volatility of the Goldie Locks Mean
Next Candle:
1. Price retraced (Long: close < close or Short: close > close )
2. GKD-B Baseline agrees
3. GKD-C Confirmation 1 agrees
4. GKD-C Confirmation 2 agrees
5. GKD-V Volatility/Volume agrees
1-Candle Rule Baseline Entry
1. GKD-B Baseline signal
2. GKD-C Confirmation 1 agrees
3. Price is within a range of 0.2x Volatility and 1.0x Volatility of the Goldie Locks Mean
4. GKD-C Confirmation 1 signal was less than 7 candles prior
Next Candle:
1. Price retraced (Long: close < close or Short: close > close )
2. GKD-B Baseline agrees
3. GKD-C Confirmation 1 agrees
4. GKD-C Confirmation 2 agrees
5. GKD-V Volatility/Volume Agrees
PullBack Entry
1. GKD-B Baseline signal
2. GKD-C Confirmation 1 agrees
3. Price is beyond 1.0x Volatility of Baseline
Next Candle:
1. Price is within a range of 0.2x Volatility and 1.0x Volatility of the Goldie Locks Mean
3. GKD-C Confirmation 1 agrees
4. GKD-C Confirmation 2 agrees
5. GKD-V Volatility/Volume Agrees
█ GKD-C Stochastic RSI of Smoothed Price
This indicator contains 7 different types of RSI:
RSX
Regular
Slow
Rapid
Harris
Cuttler
Ehlers Smoothed
What is RSI?
RSI stands for Relative Strength Index . It is a technical indicator used to measure the strength or weakness of a financial instrument's price action.
The RSI is calculated based on the price movement of an asset over a specified period of time, typically 14 days, and is expressed on a scale of 0 to 100. The RSI is considered overbought when it is above 70 and oversold when it is below 30.
Traders and investors use the RSI to identify potential buy and sell signals. When the RSI indicates that an asset is oversold, it may be considered a buying opportunity, while an overbought RSI may signal that it is time to sell or take profits.
It's important to note that the RSI should not be used in isolation and should be used in conjunction with other technical and fundamental analysis tools to make informed trading decisions.
What is RSX?
Jurik RSX is a technical analysis indicator that is a variation of the Relative Strength Index Smoothed ( RSX ) indicator. It was developed by Mark Jurik and is designed to help traders identify trends and momentum in the market.
The Jurik RSX uses a combination of the RSX indicator and an adaptive moving average (AMA) to smooth out the price data and reduce the number of false signals. The adaptive moving average is designed to adjust the smoothing period based on the current market conditions, which makes the indicator more responsive to changes in price.
The Jurik RSX can be used to identify potential trend reversals and momentum shifts in the market. It oscillates between 0 and 100, with values above 50 indicating a bullish trend and values below 50 indicating a bearish trend . Traders can use these levels to make trading decisions, such as buying when the indicator crosses above 50 and selling when it crosses below 50.
The Jurik RSX is a more advanced version of the RSX indicator, and while it can be useful in identifying potential trade opportunities, it should not be used in isolation. It is best used in conjunction with other technical and fundamental analysis tools to make informed trading decisions.
What is Slow RSI?
Slow RSI is a variation of the traditional Relative Strength Index ( RSI ) indicator. It is a more smoothed version of the RSI and is designed to filter out some of the noise and short-term price fluctuations that can occur with the standard RSI .
The Slow RSI uses a longer period of time than the traditional RSI , typically 21 periods instead of 14. This longer period helps to smooth out the price data and makes the indicator less reactive to short-term price fluctuations.
Like the traditional RSI , the Slow RSI is used to identify potential overbought and oversold conditions in the market. It oscillates between 0 and 100, with values above 70 indicating overbought conditions and values below 30 indicating oversold conditions. Traders often use these levels as potential buy and sell signals.
The Slow RSI is a more conservative version of the RSI and can be useful in identifying longer-term trends in the market. However, it can also be slower to respond to changes in price, which may result in missed trading opportunities. Traders may choose to use a combination of both the Slow RSI and the traditional RSI to make informed trading decisions.
What is Rapid RSI?
Same as regular RSI but with a faster calculation method
What is Harris RSI?
Harris RSI is a technical analysis indicator that is a variation of the Relative Strength Index ( RSI ). It was developed by Larry Harris and is designed to help traders identify potential trend changes and momentum shifts in the market.
The Harris RSI uses a different calculation formula compared to the traditional RSI . It takes into account both the opening and closing prices of a financial instrument, as well as the high and low prices. The Harris RSI is also normalized to a range of 0 to 100, with values above 50 indicating a bullish trend and values below 50 indicating a bearish trend .
Like the traditional RSI , the Harris RSI is used to identify potential overbought and oversold conditions in the market. It oscillates between 0 and 100, with values above 70 indicating overbought conditions and values below 30 indicating oversold conditions. Traders often use these levels as potential buy and sell signals.
The Harris RSI is a more advanced version of the RSI and can be useful in identifying longer-term trends in the market. However, it can also generate more false signals than the standard RSI . Traders may choose to use a combination of both the Harris RSI and the traditional RSI to make informed trading decisions.
What is Cuttler RSI?
Cuttler RSI is a technical analysis indicator that is a variation of the Relative Strength Index ( RSI ). It was developed by Curt Cuttler and is designed to help traders identify potential trend changes and momentum shifts in the market.
The Cuttler RSI uses a different calculation formula compared to the traditional RSI . It takes into account the difference between the closing price of a financial instrument and the average of the high and low prices over a specified period of time. This difference is then normalized to a range of 0 to 100, with values above 50 indicating a bullish trend and values below 50 indicating a bearish trend .
Like the traditional RSI , the Cuttler RSI is used to identify potential overbought and oversold conditions in the market. It oscillates between 0 and 100, with values above 70 indicating overbought conditions and values below 30 indicating oversold conditions. Traders often use these levels as potential buy and sell signals.
The Cuttler RSI is a more advanced version of the RSI and can be useful in identifying longer-term trends in the market. However, it can also generate more false signals than the standard RSI . Traders may choose to use a combination of both the Cuttler RSI and the traditional RSI to make informed trading decisions.
What is Ehlers Smoothed RSI?
Ehlers smoothed RSI is a technical analysis indicator that is a variation of the Relative Strength Index ( RSI ). It was developed by John Ehlers and is designed to help traders identify potential trend changes and momentum shifts in the market.
The Ehlers smoothed RSI uses a different calculation formula compared to the traditional RSI . It uses a smoothing algorithm that is designed to reduce the noise and random fluctuations that can occur with the standard RSI . The smoothing algorithm is based on a concept called "digital signal processing" and is intended to improve the accuracy of the indicator.
Like the traditional RSI , the Ehlers smoothed RSI is used to identify potential overbought and oversold conditions in the market. It oscillates between 0 and 100, with values above 70 indicating overbought conditions and values below 30 indicating oversold conditions. Traders often use these levels as potential buy and sell signals.
The Ehlers smoothed RSI can be useful in identifying longer-term trends and momentum shifts in the market. However, it can also generate more false signals than the standard RSI . Traders may choose to use a combination of both the Ehlers smoothed RSI and the traditional RSI to make informed trading decisions.
What is Stochastic RSI?
Stochastic RSI (StochRSI) is a technical analysis indicator that combines the concepts of the Stochastic Oscillator and the Relative Strength Index (RSI). It is used to identify potential overbought and oversold conditions in financial markets, as well as to generate buy and sell signals based on the momentum of price movements.
To understand Stochastic RSI, let's first define the two individual indicators it is based on:
Stochastic Oscillator: A momentum indicator that compares a particular closing price of a security to a range of its prices over a certain period. It is used to identify potential trend reversals and generate buy and sell signals.
Relative Strength Index (RSI): A momentum oscillator that measures the speed and change of price movements. It ranges between 0 and 100 and is used to identify overbought or oversold conditions in the market.
Now, let's dive into the Stochastic RSI:
The Stochastic RSI applies the Stochastic Oscillator formula to the RSI values, essentially creating an indicator of an indicator. It helps to identify when the RSI is in overbought or oversold territory with more sensitivity, providing more frequent signals than the standalone RSI.
The formula for StochRSI is as follows:
StochRSI = (RSI - Lowest Low RSI) / (Highest High RSI - Lowest Low RSI)
Where:
RSI is the current RSI value.
Lowest Low RSI is the lowest RSI value over a specified period (e.g., 14 days).
Highest High RSI is the highest RSI value over the same specified period.
StochRSI ranges from 0 to 1, but it is usually multiplied by 100 for easier interpretation, making the range 0 to 100. Like the RSI, values close to 0 indicate oversold conditions, while values close to 100 indicate overbought conditions. However, since the StochRSI is more sensitive, traders typically use 20 as the oversold threshold and 80 as the overbought threshold.
Traders use the StochRSI to generate buy and sell signals by looking for crossovers with a signal line (a moving average of the StochRSI), similar to the way the Stochastic Oscillator is used. When the StochRSI crosses above the signal line, it is considered a bullish signal, and when it crosses below the signal line, it is considered a bearish signal.
It is essential to use the Stochastic RSI in conjunction with other technical analysis tools and indicators, as well as to consider the overall market context, to improve the accuracy and reliability of trading signals.
What is Stochastic RSI of Smoothed Price?
This indicator is just as it's title suggests. There are six different signal types and various price smoothing types.
Signal types included are the following;
Fixed Levels
Floating Levels
Quantile Levels
Fixed Middle
Floating Middle
Quantile Middle
Requirements
Inputs
Confirmation 1 and Solo Confirmation: GKD-V Volatility / Volume indicator
Confirmation 2: GKD-C Confirmation indicator
Outputs
Confirmation 2 and Solo Confirmation Complex: GKD-E Exit indicator
Confirmation 1: GKD-C Confirmation indicator
Continuation: GKD-E Exit indicator
Solo Confirmation Simple: GKD-BT Backtest strategy
Additional features will be added in future releases.
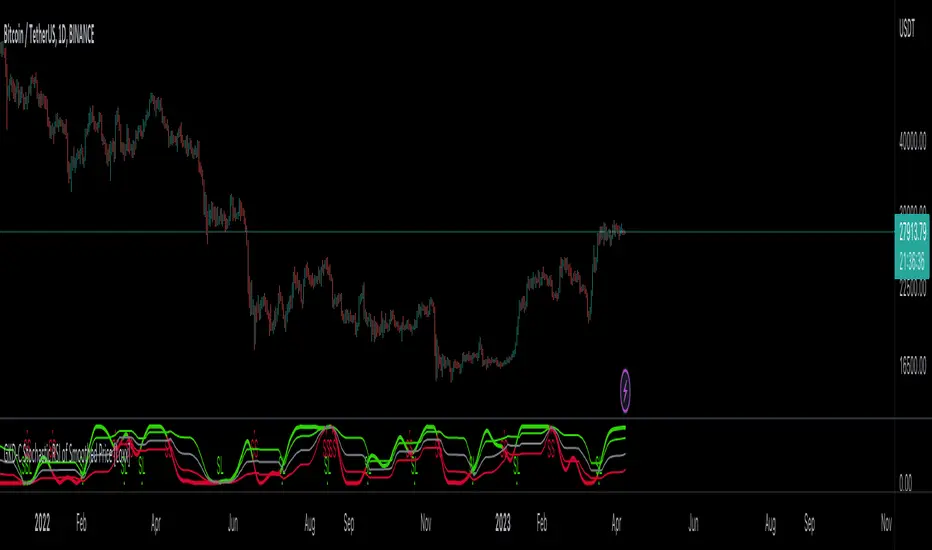
GKD-C Sigmoidal Normalized RSI [Loxx]Giga Kaleidoscope GKD-C Sigmoidal Normalized RSI is a Confirmation module included in Loxx's "Giga Kaleidoscope Modularized Trading System".
█ Giga Kaleidoscope Modularized Trading System
What is Loxx's "Giga Kaleidoscope Modularized Trading System"?
The Giga Kaleidoscope Modularized Trading System is a trading system built on the philosophy of the NNFX (No Nonsense Forex) algorithmic trading.
What is the NNFX algorithmic trading strategy?
The NNFX (No-Nonsense Forex) trading system is a comprehensive approach to Forex trading that is designed to simplify the process and remove the confusion and complexity that often surrounds trading. The system was developed by a Forex trader who goes by the pseudonym "VP" and has gained a significant following in the Forex community.
The NNFX trading system is based on a set of rules and guidelines that help traders make objective and informed decisions. These rules cover all aspects of trading, including market analysis, trade entry, stop loss placement, and trade management.
Here are the main components of the NNFX trading system:
1. Trading Philosophy: The NNFX trading system is based on the idea that successful trading requires a comprehensive understanding of the market, objective analysis, and strict risk management. The system aims to remove subjective elements from trading and focuses on objective rules and guidelines.
2. Technical Analysis: The NNFX trading system relies heavily on technical analysis and uses a range of indicators to identify high-probability trading opportunities. The system uses a combination of trend-following and mean-reverting strategies to identify trades.
3. Market Structure: The NNFX trading system emphasizes the importance of understanding the market structure, including price action, support and resistance levels, and market cycles. The system uses a range of tools to identify the market structure, including trend lines, channels, and moving averages.
4. Trade Entry: The NNFX trading system has strict rules for trade entry. The system uses a combination of technical indicators to identify high-probability trades, and traders must meet specific criteria to enter a trade.
5. Stop Loss Placement: The NNFX trading system places a significant emphasis on risk management and requires traders to place a stop loss order on every trade. The system uses a combination of technical analysis and market structure to determine the appropriate stop loss level.
6. Trade Management: The NNFX trading system has specific rules for managing open trades. The system aims to minimize risk and maximize profit by using a combination of trailing stops, take profit levels, and position sizing.
Overall, the NNFX trading system is designed to be a straightforward and easy-to-follow approach to Forex trading that can be applied by traders of all skill levels.
Core components of an NNFX algorithmic trading strategy
The NNFX algorithm is built on the principles of trend, momentum, and volatility. There are six core components in the NNFX trading algorithm:
1. Volatility - price volatility; e.g., Average True Range, True Range Double, Close-to-Close, etc.
2. Baseline - a moving average to identify price trend
3. Confirmation 1 - a technical indicator used to identify trends
4. Confirmation 2 - a technical indicator used to identify trends
5. Continuation - a technical indicator used to identify trends
6. Volatility/Volume - a technical indicator used to identify volatility/volume breakouts/breakdown
7. Exit - a technical indicator used to determine when a trend is exhausted
What is Volatility in the NNFX trading system?
In the NNFX (No Nonsense Forex) trading system, ATR (Average True Range) is typically used to measure the volatility of an asset. It is used as a part of the system to help determine the appropriate stop loss and take profit levels for a trade. ATR is calculated by taking the average of the true range values over a specified period.
True range is calculated as the maximum of the following values:
-Current high minus the current low
-Absolute value of the current high minus the previous close
-Absolute value of the current low minus the previous close
ATR is a dynamic indicator that changes with changes in volatility. As volatility increases, the value of ATR increases, and as volatility decreases, the value of ATR decreases. By using ATR in NNFX system, traders can adjust their stop loss and take profit levels according to the volatility of the asset being traded. This helps to ensure that the trade is given enough room to move, while also minimizing potential losses.
Other types of volatility include True Range Double (TRD), Close-to-Close, and Garman-Klass
What is a Baseline indicator?
The baseline is essentially a moving average, and is used to determine the overall direction of the market.
The baseline in the NNFX system is used to filter out trades that are not in line with the long-term trend of the market. The baseline is plotted on the chart along with other indicators, such as the Moving Average (MA), the Relative Strength Index (RSI), and the Average True Range (ATR).
Trades are only taken when the price is in the same direction as the baseline. For example, if the baseline is sloping upwards, only long trades are taken, and if the baseline is sloping downwards, only short trades are taken. This approach helps to ensure that trades are in line with the overall trend of the market, and reduces the risk of entering trades that are likely to fail.
By using a baseline in the NNFX system, traders can have a clear reference point for determining the overall trend of the market, and can make more informed trading decisions. The baseline helps to filter out noise and false signals, and ensures that trades are taken in the direction of the long-term trend.
What is a Confirmation indicator?
Confirmation indicators are technical indicators that are used to confirm the signals generated by primary indicators. Primary indicators are the core indicators used in the NNFX system, such as the Average True Range (ATR), the Moving Average (MA), and the Relative Strength Index (RSI).
The purpose of the confirmation indicators is to reduce false signals and improve the accuracy of the trading system. They are designed to confirm the signals generated by the primary indicators by providing additional information about the strength and direction of the trend.
Some examples of confirmation indicators that may be used in the NNFX system include the Bollinger Bands, the MACD (Moving Average Convergence Divergence), and the Stochastic Oscillator. These indicators can provide information about the volatility, momentum, and trend strength of the market, and can be used to confirm the signals generated by the primary indicators.
In the NNFX system, confirmation indicators are used in combination with primary indicators and other filters to create a trading system that is robust and reliable. By using multiple indicators to confirm trading signals, the system aims to reduce the risk of false signals and improve the overall profitability of the trades.
What is a Continuation indicator?
In the NNFX (No Nonsense Forex) trading system, a continuation indicator is a technical indicator that is used to confirm a current trend and predict that the trend is likely to continue in the same direction. A continuation indicator is typically used in conjunction with other indicators in the system, such as a baseline indicator, to provide a comprehensive trading strategy.
What is a Volatility/Volume indicator?
Volume indicators, such as the On Balance Volume (OBV), the Chaikin Money Flow (CMF), or the Volume Price Trend (VPT), are used to measure the amount of buying and selling activity in a market. They are based on the trading volume of the market, and can provide information about the strength of the trend. In the NNFX system, volume indicators are used to confirm trading signals generated by the Moving Average and the Relative Strength Index. Volatility indicators include Average Direction Index, Waddah Attar, and Volatility Ratio. In the NNFX trading system, volatility is a proxy for volume and vice versa.
By using volume indicators as confirmation tools, the NNFX trading system aims to reduce the risk of false signals and improve the overall profitability of trades. These indicators can provide additional information about the market that is not captured by the primary indicators, and can help traders to make more informed trading decisions. In addition, volume indicators can be used to identify potential changes in market trends and to confirm the strength of price movements.
What is an Exit indicator?
The exit indicator is used in conjunction with other indicators in the system, such as the Moving Average (MA), the Relative Strength Index (RSI), and the Average True Range (ATR), to provide a comprehensive trading strategy.
The exit indicator in the NNFX system can be any technical indicator that is deemed effective at identifying optimal exit points. Examples of exit indicators that are commonly used include the Parabolic SAR, the Average Directional Index (ADX), and the Chandelier Exit.
The purpose of the exit indicator is to identify when a trend is likely to reverse or when the market conditions have changed, signaling the need to exit a trade. By using an exit indicator, traders can manage their risk and prevent significant losses.
In the NNFX system, the exit indicator is used in conjunction with a stop loss and a take profit order to maximize profits and minimize losses. The stop loss order is used to limit the amount of loss that can be incurred if the trade goes against the trader, while the take profit order is used to lock in profits when the trade is moving in the trader's favor.
Overall, the use of an exit indicator in the NNFX trading system is an important component of a comprehensive trading strategy. It allows traders to manage their risk effectively and improve the profitability of their trades by exiting at the right time.
How does Loxx's GKD (Giga Kaleidoscope Modularized Trading System) implement the NNFX algorithm outlined above?
Loxx's GKD v1.0 system has five types of modules (indicators/strategies). These modules are:
1. GKD-BT - Backtesting module (Volatility, Number 1 in the NNFX algorithm)
2. GKD-B - Baseline module (Baseline and Volatility/Volume, Numbers 1 and 2 in the NNFX algorithm)
3. GKD-C - Confirmation 1/2 and Continuation module (Confirmation 1/2 and Continuation, Numbers 3, 4, and 5 in the NNFX algorithm)
4. GKD-V - Volatility/Volume module (Confirmation 1/2, Number 6 in the NNFX algorithm)
5. GKD-E - Exit module (Exit, Number 7 in the NNFX algorithm)
(additional module types will added in future releases)
Each module interacts with every module by passing data between modules. Data is passed between each module as described below:
GKD-B => GKD-V => GKD-C(1) => GKD-C(2) => GKD-C(Continuation) => GKD-E => GKD-BT
That is, the Baseline indicator passes its data to Volatility/Volume. The Volatility/Volume indicator passes its values to the Confirmation 1 indicator. The Confirmation 1 indicator passes its values to the Confirmation 2 indicator. The Confirmation 2 indicator passes its values to the Continuation indicator. The Continuation indicator passes its values to the Exit indicator, and finally, the Exit indicator passes its values to the Backtest strategy.
This chaining of indicators requires that each module conform to Loxx's GKD protocol, therefore allowing for the testing of every possible combination of technical indicators that make up the six components of the NNFX algorithm.
What does the application of the GKD trading system look like?
Example trading system:
Backtest: Strategy with 1-3 take profits, trailing stop loss, multiple types of PnL volatility, and 2 backtesting styles
Baseline: Hull Moving Average
Volatility/Volume: Hurst Exponent
Confirmation 1: Sigmoidal Normalized RSI as shown on the chart above
Confirmation 2: Williams Percent Range
Continuation: Fisher Transform
Exit: Rex Oscillator
Each GKD indicator is denoted with a module identifier of either: GKD-BT, GKD-B, GKD-C, GKD-V, or GKD-E. This allows traders to understand to which module each indicator belongs and where each indicator fits into the GKD protocol chain.
Giga Kaleidoscope Modularized Trading System Signals (based on the NNFX algorithm)
Standard Entry
1. GKD-C Confirmation 1 Signal
2. GKD-B Baseline agrees
3. Price is within a range of 0.2x Volatility and 1.0x Volatility of the Goldie Locks Mean
4. GKD-C Confirmation 2 agrees
5. GKD-V Volatility/Volume agrees
Baseline Entry
1. GKD-B Baseline signal
2. GKD-C Confirmation 1 agrees
3. Price is within a range of 0.2x Volatility and 1.0x Volatility of the Goldie Locks Mean
4. GKD-C Confirmation 2 agrees
5. GKD-V Volatility/Volume agrees
6. GKD-C Confirmation 1 signal was less than 7 candles prior
Continuation Entry
1. Standard Entry, Baseline Entry, or Pullback; entry triggered previously
2. GKD-B Baseline hasn't crossed since entry signal trigger
3. GKD-C Confirmation Continuation Indicator signals
4. GKD-C Confirmation 1 agrees
5. GKD-B Baseline agrees
6. GKD-C Confirmation 2 agrees
1-Candle Rule Standard Entry
1. GKD-C Confirmation 1 signal
2. GKD-B Baseline agrees
3. Price is within a range of 0.2x Volatility and 1.0x Volatility of the Goldie Locks Mean
Next Candle:
1. Price retraced (Long: close < close or Short: close > close )
2. GKD-B Baseline agrees
3. GKD-C Confirmation 1 agrees
4. GKD-C Confirmation 2 agrees
5. GKD-V Volatility/Volume agrees
1-Candle Rule Baseline Entry
1. GKD-B Baseline signal
2. GKD-C Confirmation 1 agrees
3. Price is within a range of 0.2x Volatility and 1.0x Volatility of the Goldie Locks Mean
4. GKD-C Confirmation 1 signal was less than 7 candles prior
Next Candle:
1. Price retraced (Long: close < close or Short: close > close )
2. GKD-B Baseline agrees
3. GKD-C Confirmation 1 agrees
4. GKD-C Confirmation 2 agrees
5. GKD-V Volatility/Volume Agrees
PullBack Entry
1. GKD-B Baseline signal
2. GKD-C Confirmation 1 agrees
3. Price is beyond 1.0x Volatility of Baseline
Next Candle:
1. Price is within a range of 0.2x Volatility and 1.0x Volatility of the Goldie Locks Mean
3. GKD-C Confirmation 1 agrees
4. GKD-C Confirmation 2 agrees
5. GKD-V Volatility/Volume Agrees
█ GKD-C Sigmoidal Normalized RSI
What is the Sigmoidal normalization?
Sigmoidal normalization is a mathematical technique used to transform data so that it is within a specific range or has a specific distribution. The sigmoid function used in this normalization is a mathematical function that maps any input value to a value between 0 and 1, and has an S-shaped curve.
The sigmoidal normalization process involves applying the sigmoid function to the data values, which maps the data to a range between 0 and 1. This range can be useful in situations where the data needs to be scaled to a specific range, such as when the data needs to be inputted into a machine learning algorithm that requires input features to be between 0 and 1.
One of the benefits of using sigmoidal normalization is that it can help to reduce the impact of outliers in the data. Outliers, or extreme values that are significantly different from the rest of the data, can have a significant impact on the mean and standard deviation of the data. By normalizing the data using a sigmoid function, the impact of outliers is reduced, and the data is scaled in a more even and consistent way.
Sigmoidal normalization can be especially useful in situations where the original data has a non-normal distribution. The sigmoid function can be used to transform the data to a more normal distribution, which can make it easier to analyze and model.
In summary, sigmoidal normalization is a mathematical technique used to transform data to a specific range or distribution by applying a sigmoid function to the data values. It can help to reduce the impact of outliers and can be especially useful in situations where the original data has a non-normal distribution.
What is RSI?
The Relative Strength Index ( RSI ) is a technical analysis indicator that is used to measure the strength of a security's price action. It was developed by J. Welles Wilder in 1978 and has since become a popular tool for traders and analysts.
The RSI is calculated by comparing the average gain of a security's price on up days to the average loss on down days over a given period of time. The RSI is displayed as a line graph that oscillates between zero and 100. Readings above 70 are considered overbought, while readings below 30 are considered oversold.
The formula for the RSI is as follows:
RSI = 100 - (100 / (1 + RS ))
Where:
RS = Average Gain / Average Loss
The calculation for Average Gain is:
((Current Price - Previous Price) if Current Price > Previous Price, otherwise 0) / n
The calculation for Average Loss is:
((Previous Price - Current Price) if Current Price < Previous Price, otherwise 0) / n
Where:
n = the number of periods used for the RSI calculation (usually 14)
The RSI can be used in a variety of ways, including identifying overbought and oversold conditions, as well as potential trend reversals. When the RSI rises above 70, it is considered overbought and indicates that the security may be due for a correction or reversal. Conversely, when the RSI falls below 30, it is considered oversold and indicates that the security may be due for a bounce or reversal.
In addition to overbought and oversold levels, traders can also look for divergences between the RSI and price action. For example, if the RSI is making higher highs while prices are making lower lows, it could indicate a potential trend reversal.
Overall, the RSI is a useful technical analysis tool for identifying potential price reversals and overbought/oversold conditions. However, like all technical indicators, it should be used in conjunction with other forms of analysis and risk management techniques to make informed trading decisions.
What is the Sigmoidal Normalized RSI?
This indicator indicator uses a proprietary smoothing function to smooth RSI after which it is fed through a Sigmoidal Normalization process to smooth one more time forcing the values to oscillator between -1 and 1. This greatly reduces noise and increases the signal quality of the output. This also helps identify reversals.
Requirements
Inputs
Confirmation 1 and Solo Confirmation: GKD-V Volatility / Volume indicator
Confirmation 2: GKD-C Confirmation indicator
Outputs
Confirmation 2 and Solo Confirmation Complex: GKD-E Exit indicator
Confirmation 1: GKD-C Confirmation indicator
Continuation: GKD-E Exit indicator
Solo Confirmation Simple: GKD-BT Backtest strategy
Additional features will be added in future releases.

GKD-C Adaptive RSX Dynamic Momentum Index [Loxx]Giga Kaleidoscope GKD-C Adaptive RSX Dynamic Momentum Index is a Confirmation module included in Loxx's "Giga Kaleidoscope Modularized Trading System".
█ Giga Kaleidoscope Modularized Trading System
What is Loxx's "Giga Kaleidoscope Modularized Trading System"?
The Giga Kaleidoscope Modularized Trading System is a trading system built on the philosophy of the NNFX (No Nonsense Forex) algorithmic trading.
What is the NNFX algorithmic trading strategy?
The NNFX (No-Nonsense Forex) trading system is a comprehensive approach to Forex trading that is designed to simplify the process and remove the confusion and complexity that often surrounds trading. The system was developed by a Forex trader who goes by the pseudonym "VP" and has gained a significant following in the Forex community.
The NNFX trading system is based on a set of rules and guidelines that help traders make objective and informed decisions. These rules cover all aspects of trading, including market analysis, trade entry, stop loss placement, and trade management.
Here are the main components of the NNFX trading system:
1. Trading Philosophy: The NNFX trading system is based on the idea that successful trading requires a comprehensive understanding of the market, objective analysis, and strict risk management. The system aims to remove subjective elements from trading and focuses on objective rules and guidelines.
2. Technical Analysis: The NNFX trading system relies heavily on technical analysis and uses a range of indicators to identify high-probability trading opportunities. The system uses a combination of trend-following and mean-reverting strategies to identify trades.
3. Market Structure: The NNFX trading system emphasizes the importance of understanding the market structure, including price action, support and resistance levels, and market cycles. The system uses a range of tools to identify the market structure, including trend lines, channels, and moving averages.
4. Trade Entry: The NNFX trading system has strict rules for trade entry. The system uses a combination of technical indicators to identify high-probability trades, and traders must meet specific criteria to enter a trade.
5. Stop Loss Placement: The NNFX trading system places a significant emphasis on risk management and requires traders to place a stop loss order on every trade. The system uses a combination of technical analysis and market structure to determine the appropriate stop loss level.
6. Trade Management: The NNFX trading system has specific rules for managing open trades. The system aims to minimize risk and maximize profit by using a combination of trailing stops, take profit levels, and position sizing.
Overall, the NNFX trading system is designed to be a straightforward and easy-to-follow approach to Forex trading that can be applied by traders of all skill levels.
Core components of an NNFX algorithmic trading strategy
The NNFX algorithm is built on the principles of trend, momentum, and volatility. There are six core components in the NNFX trading algorithm:
1. Volatility - price volatility; e.g., Average True Range, True Range Double, Close-to-Close, etc.
2. Baseline - a moving average to identify price trend
3. Confirmation 1 - a technical indicator used to identify trends
4. Confirmation 2 - a technical indicator used to identify trends
5. Continuation - a technical indicator used to identify trends
6. Volatility/Volume - a technical indicator used to identify volatility/volume breakouts/breakdown
7. Exit - a technical indicator used to determine when a trend is exhausted
What is Volatility in the NNFX trading system?
In the NNFX (No Nonsense Forex) trading system, ATR (Average True Range) is typically used to measure the volatility of an asset. It is used as a part of the system to help determine the appropriate stop loss and take profit levels for a trade. ATR is calculated by taking the average of the true range values over a specified period.
True range is calculated as the maximum of the following values:
-Current high minus the current low
-Absolute value of the current high minus the previous close
-Absolute value of the current low minus the previous close
ATR is a dynamic indicator that changes with changes in volatility. As volatility increases, the value of ATR increases, and as volatility decreases, the value of ATR decreases. By using ATR in NNFX system, traders can adjust their stop loss and take profit levels according to the volatility of the asset being traded. This helps to ensure that the trade is given enough room to move, while also minimizing potential losses.
Other types of volatility include True Range Double (TRD), Close-to-Close, and Garman-Klass
What is a Baseline indicator?
The baseline is essentially a moving average, and is used to determine the overall direction of the market.
The baseline in the NNFX system is used to filter out trades that are not in line with the long-term trend of the market. The baseline is plotted on the chart along with other indicators, such as the Moving Average (MA), the Relative Strength Index (RSI), and the Average True Range (ATR).
Trades are only taken when the price is in the same direction as the baseline. For example, if the baseline is sloping upwards, only long trades are taken, and if the baseline is sloping downwards, only short trades are taken. This approach helps to ensure that trades are in line with the overall trend of the market, and reduces the risk of entering trades that are likely to fail.
By using a baseline in the NNFX system, traders can have a clear reference point for determining the overall trend of the market, and can make more informed trading decisions. The baseline helps to filter out noise and false signals, and ensures that trades are taken in the direction of the long-term trend.
What is a Confirmation indicator?
Confirmation indicators are technical indicators that are used to confirm the signals generated by primary indicators. Primary indicators are the core indicators used in the NNFX system, such as the Average True Range (ATR), the Moving Average (MA), and the Relative Strength Index (RSI).
The purpose of the confirmation indicators is to reduce false signals and improve the accuracy of the trading system. They are designed to confirm the signals generated by the primary indicators by providing additional information about the strength and direction of the trend.
Some examples of confirmation indicators that may be used in the NNFX system include the Bollinger Bands, the MACD (Moving Average Convergence Divergence), and the Stochastic Oscillator. These indicators can provide information about the volatility, momentum, and trend strength of the market, and can be used to confirm the signals generated by the primary indicators.
In the NNFX system, confirmation indicators are used in combination with primary indicators and other filters to create a trading system that is robust and reliable. By using multiple indicators to confirm trading signals, the system aims to reduce the risk of false signals and improve the overall profitability of the trades.
What is a Continuation indicator?
In the NNFX (No Nonsense Forex) trading system, a continuation indicator is a technical indicator that is used to confirm a current trend and predict that the trend is likely to continue in the same direction. A continuation indicator is typically used in conjunction with other indicators in the system, such as a baseline indicator, to provide a comprehensive trading strategy.
What is a Volatility/Volume indicator?
Volume indicators, such as the On Balance Volume (OBV), the Chaikin Money Flow (CMF), or the Volume Price Trend (VPT), are used to measure the amount of buying and selling activity in a market. They are based on the trading volume of the market, and can provide information about the strength of the trend. In the NNFX system, volume indicators are used to confirm trading signals generated by the Moving Average and the Relative Strength Index. Volatility indicators include Average Direction Index, Waddah Attar, and Volatility Ratio. In the NNFX trading system, volatility is a proxy for volume and vice versa.
By using volume indicators as confirmation tools, the NNFX trading system aims to reduce the risk of false signals and improve the overall profitability of trades. These indicators can provide additional information about the market that is not captured by the primary indicators, and can help traders to make more informed trading decisions. In addition, volume indicators can be used to identify potential changes in market trends and to confirm the strength of price movements.
What is an Exit indicator?
The exit indicator is used in conjunction with other indicators in the system, such as the Moving Average (MA), the Relative Strength Index (RSI), and the Average True Range (ATR), to provide a comprehensive trading strategy.
The exit indicator in the NNFX system can be any technical indicator that is deemed effective at identifying optimal exit points. Examples of exit indicators that are commonly used include the Parabolic SAR, the Average Directional Index (ADX), and the Chandelier Exit.
The purpose of the exit indicator is to identify when a trend is likely to reverse or when the market conditions have changed, signaling the need to exit a trade. By using an exit indicator, traders can manage their risk and prevent significant losses.
In the NNFX system, the exit indicator is used in conjunction with a stop loss and a take profit order to maximize profits and minimize losses. The stop loss order is used to limit the amount of loss that can be incurred if the trade goes against the trader, while the take profit order is used to lock in profits when the trade is moving in the trader's favor.
Overall, the use of an exit indicator in the NNFX trading system is an important component of a comprehensive trading strategy. It allows traders to manage their risk effectively and improve the profitability of their trades by exiting at the right time.
How does Loxx's GKD (Giga Kaleidoscope Modularized Trading System) implement the NNFX algorithm outlined above?
Loxx's GKD v1.0 system has five types of modules (indicators/strategies). These modules are:
1. GKD-BT - Backtesting module (Volatility, Number 1 in the NNFX algorithm)
2. GKD-B - Baseline module (Baseline and Volatility/Volume, Numbers 1 and 2 in the NNFX algorithm)
3. GKD-C - Confirmation 1/2 and Continuation module (Confirmation 1/2 and Continuation, Numbers 3, 4, and 5 in the NNFX algorithm)
4. GKD-V - Volatility/Volume module (Confirmation 1/2, Number 6 in the NNFX algorithm)
5. GKD-E - Exit module (Exit, Number 7 in the NNFX algorithm)
(additional module types will added in future releases)
Each module interacts with every module by passing data between modules. Data is passed between each module as described below:
GKD-B => GKD-V => GKD-C(1) => GKD-C(2) => GKD-C(Continuation) => GKD-E => GKD-BT
That is, the Baseline indicator passes its data to Volatility/Volume. The Volatility/Volume indicator passes its values to the Confirmation 1 indicator. The Confirmation 1 indicator passes its values to the Confirmation 2 indicator. The Confirmation 2 indicator passes its values to the Continuation indicator. The Continuation indicator passes its values to the Exit indicator, and finally, the Exit indicator passes its values to the Backtest strategy.
This chaining of indicators requires that each module conform to Loxx's GKD protocol, therefore allowing for the testing of every possible combination of technical indicators that make up the six components of the NNFX algorithm.
What does the application of the GKD trading system look like?
Example trading system:
Backtest: Strategy with 1-3 take profits, trailing stop loss, multiple types of PnL volatility, and 2 backtesting styles
Baseline: Hull Moving Average
Volatility/Volume: Hurst Exponent
Confirmation 1: Adaptive RSX Dynamic Momentum Index as shown on the chart above
Confirmation 2: Williams Percent Range
Continuation: Fisher Transform
Exit: Rex Oscillator
Each GKD indicator is denoted with a module identifier of either: GKD-BT, GKD-B, GKD-C, GKD-V, or GKD-E. This allows traders to understand to which module each indicator belongs and where each indicator fits into the GKD protocol chain.
Giga Kaleidoscope Modularized Trading System Signals (based on the NNFX algorithm)
Standard Entry
1. GKD-C Confirmation 1 Signal
2. GKD-B Baseline agrees
3. Price is within a range of 0.2x Volatility and 1.0x Volatility of the Goldie Locks Mean
4. GKD-C Confirmation 2 agrees
5. GKD-V Volatility/Volume agrees
Baseline Entry
1. GKD-B Baseline signal
2. GKD-C Confirmation 1 agrees
3. Price is within a range of 0.2x Volatility and 1.0x Volatility of the Goldie Locks Mean
4. GKD-C Confirmation 2 agrees
5. GKD-V Volatility/Volume agrees
6. GKD-C Confirmation 1 signal was less than 7 candles prior
Continuation Entry
1. Standard Entry, Baseline Entry, or Pullback; entry triggered previously
2. GKD-B Baseline hasn't crossed since entry signal trigger
3. GKD-C Confirmation Continuation Indicator signals
4. GKD-C Confirmation 1 agrees
5. GKD-B Baseline agrees
6. GKD-C Confirmation 2 agrees
1-Candle Rule Standard Entry
1. GKD-C Confirmation 1 signal
2. GKD-B Baseline agrees
3. Price is within a range of 0.2x Volatility and 1.0x Volatility of the Goldie Locks Mean
Next Candle:
1. Price retraced (Long: close < close or Short: close > close )
2. GKD-B Baseline agrees
3. GKD-C Confirmation 1 agrees
4. GKD-C Confirmation 2 agrees
5. GKD-V Volatility/Volume agrees
1-Candle Rule Baseline Entry
1. GKD-B Baseline signal
2. GKD-C Confirmation 1 agrees
3. Price is within a range of 0.2x Volatility and 1.0x Volatility of the Goldie Locks Mean
4. GKD-C Confirmation 1 signal was less than 7 candles prior
Next Candle:
1. Price retraced (Long: close < close or Short: close > close )
2. GKD-B Baseline agrees
3. GKD-C Confirmation 1 agrees
4. GKD-C Confirmation 2 agrees
5. GKD-V Volatility/Volume Agrees
PullBack Entry
1. GKD-B Baseline signal
2. GKD-C Confirmation 1 agrees
3. Price is beyond 1.0x Volatility of Baseline
Next Candle:
1. Price is within a range of 0.2x Volatility and 1.0x Volatility of the Goldie Locks Mean
3. GKD-C Confirmation 1 agrees
4. GKD-C Confirmation 2 agrees
5. GKD-V Volatility/Volume Agrees
█ GKD-C Adaptive RSX Dynamic Momentum Index
What is RSX?
The Jurik RSX ( Relative Strength Index ) is a technical indicator used in financial markets to measure the strength of price movement. It was developed by Mark Jurik and is based on the RSI formula, with the addition of smoothing and other modifications.
The Jurik RSX is designed to be smoother and more responsive than traditional RSI indicators, making it more useful for detecting trends and trading signals. It is also less prone to false signals and noise, which can be a problem with some other technical indicators.
The Jurik RSX can be used in a variety of ways, including as a trend-following indicator or a momentum indicator . It can also be combined with other indicators and trading strategies to improve overall performance.
What is Dynamic Momentum Index?
The Dynamic Momentum Index (DMI) is a technical indicator used in financial trading to identify trend strength and potential trend reversals. It was developed by Tushar Chande in 1995.
The DMI calculates the difference between an asset's current price and a price from a certain number of periods ago, and then divides that difference by the sum of all price changes over those same periods. The resulting value is then multiplied by 100 to generate a percentage-based oscillator.
The DMI is similar to other momentum indicators such as the Relative Strength Index (RSI) and Stochastic Oscillator, but it is designed to be more responsive to changes in price momentum.
Traders typically use the DMI in conjunction with other technical indicators and chart patterns to confirm potential trade opportunities. A DMI value above 0 indicates a bullish trend, while a value below 0 indicates a bearish trend. A DMI value close to 0 suggests that the market is in a consolidation phase.
What is Volatility Ratio?
The Volatility Ratio is a technical indicator that compares the volatility of two different time periods. It is calculated by dividing the longer-term period's standard deviation by the shorter-term period's standard deviation.
The formula for calculating the Volatility Ratio is as follows:
Volatility Ratio = Standard Deviation (Longer-term Period) / Standard Deviation (Shorter-term Period)
The Volatility Ratio is used to identify changes in market volatility and potential trend reversals. Traders often use this indicator to confirm other technical indicators and to identify potential trading opportunities.
A high Volatility Ratio indicates that the longer-term volatility is significantly greater than the shorter-term volatility, which could suggest that a change in trend is imminent. Conversely, a low Volatility Ratio indicates that the shorter-term volatility is greater than the longer-term volatility, which could suggest that the current trend is likely to continue.
It is important to note that the Volatility Ratio is not a standalone indicator and should be used in conjunction with other technical indicators and analysis techniques.
What is the Adaptive RSX Dynamic Momentum Index?
This indicator uses a volatility-ratio adaptive Dynamic Momentum Index to determine breakout/breakdown levels for RSX. Breakouts, or longs, happen when upper level is crossed; breakdowns, or shorts, happen when the lower level is crossed.
Requirements
Inputs
Confirmation 1 and Solo Confirmation: GKD-V Volatility / Volume indicator
Confirmation 2: GKD-C Confirmation indicator
Outputs
Confirmation 2 and Solo Confirmation Complex: GKD-E Exit indicator
Confirmation 1: GKD-C Confirmation indicator
Continuation: GKD-E Exit indicator
Solo Confirmation Simple: GKD-BT Backtest strategy
Additional features will be added in future releases.

GKD-C Volatility Adaptive RSX w/ Dual DSL [Loxx]Giga Kaleidoscope GKD-C Volatility Adaptive RSX w/ Dual DSL is a Confirmation module included in Loxx's "Giga Kaleidoscope Modularized Trading System".
█ Giga Kaleidoscope Modularized Trading System
What is Loxx's "Giga Kaleidoscope Modularized Trading System"?
The Giga Kaleidoscope Modularized Trading System is a trading system built on the philosophy of the NNFX (No Nonsense Forex) algorithmic trading.
What is the NNFX algorithmic trading strategy?
The NNFX (No-Nonsense Forex) trading system is a comprehensive approach to Forex trading that is designed to simplify the process and remove the confusion and complexity that often surrounds trading. The system was developed by a Forex trader who goes by the pseudonym "VP" and has gained a significant following in the Forex community.
The NNFX trading system is based on a set of rules and guidelines that help traders make objective and informed decisions. These rules cover all aspects of trading, including market analysis, trade entry, stop loss placement, and trade management.
Here are the main components of the NNFX trading system:
1. Trading Philosophy: The NNFX trading system is based on the idea that successful trading requires a comprehensive understanding of the market, objective analysis, and strict risk management. The system aims to remove subjective elements from trading and focuses on objective rules and guidelines.
2. Technical Analysis: The NNFX trading system relies heavily on technical analysis and uses a range of indicators to identify high-probability trading opportunities. The system uses a combination of trend-following and mean-reverting strategies to identify trades.
3. Market Structure: The NNFX trading system emphasizes the importance of understanding the market structure, including price action, support and resistance levels, and market cycles. The system uses a range of tools to identify the market structure, including trend lines, channels, and moving averages.
4. Trade Entry: The NNFX trading system has strict rules for trade entry. The system uses a combination of technical indicators to identify high-probability trades, and traders must meet specific criteria to enter a trade.
5. Stop Loss Placement: The NNFX trading system places a significant emphasis on risk management and requires traders to place a stop loss order on every trade. The system uses a combination of technical analysis and market structure to determine the appropriate stop loss level.
6. Trade Management: The NNFX trading system has specific rules for managing open trades. The system aims to minimize risk and maximize profit by using a combination of trailing stops, take profit levels, and position sizing.
Overall, the NNFX trading system is designed to be a straightforward and easy-to-follow approach to Forex trading that can be applied by traders of all skill levels.
Core components of an NNFX algorithmic trading strategy
The NNFX algorithm is built on the principles of trend, momentum, and volatility. There are six core components in the NNFX trading algorithm:
1. Volatility - price volatility; e.g., Average True Range, True Range Double, Close-to-Close, etc.
2. Baseline - a moving average to identify price trend
3. Confirmation 1 - a technical indicator used to identify trends
4. Confirmation 2 - a technical indicator used to identify trends
5. Continuation - a technical indicator used to identify trends
6. Volatility/Volume - a technical indicator used to identify volatility/volume breakouts/breakdown
7. Exit - a technical indicator used to determine when a trend is exhausted
What is Volatility in the NNFX trading system?
In the NNFX (No Nonsense Forex) trading system, ATR (Average True Range) is typically used to measure the volatility of an asset. It is used as a part of the system to help determine the appropriate stop loss and take profit levels for a trade. ATR is calculated by taking the average of the true range values over a specified period.
True range is calculated as the maximum of the following values:
-Current high minus the current low
-Absolute value of the current high minus the previous close
-Absolute value of the current low minus the previous close
ATR is a dynamic indicator that changes with changes in volatility. As volatility increases, the value of ATR increases, and as volatility decreases, the value of ATR decreases. By using ATR in NNFX system, traders can adjust their stop loss and take profit levels according to the volatility of the asset being traded. This helps to ensure that the trade is given enough room to move, while also minimizing potential losses.
Other types of volatility include True Range Double (TRD), Close-to-Close, and Garman-Klass
What is a Baseline indicator?
The baseline is essentially a moving average, and is used to determine the overall direction of the market.
The baseline in the NNFX system is used to filter out trades that are not in line with the long-term trend of the market. The baseline is plotted on the chart along with other indicators, such as the Moving Average (MA), the Relative Strength Index (RSI), and the Average True Range (ATR).
Trades are only taken when the price is in the same direction as the baseline. For example, if the baseline is sloping upwards, only long trades are taken, and if the baseline is sloping downwards, only short trades are taken. This approach helps to ensure that trades are in line with the overall trend of the market, and reduces the risk of entering trades that are likely to fail.
By using a baseline in the NNFX system, traders can have a clear reference point for determining the overall trend of the market, and can make more informed trading decisions. The baseline helps to filter out noise and false signals, and ensures that trades are taken in the direction of the long-term trend.
What is a Confirmation indicator?
Confirmation indicators are technical indicators that are used to confirm the signals generated by primary indicators. Primary indicators are the core indicators used in the NNFX system, such as the Average True Range (ATR), the Moving Average (MA), and the Relative Strength Index (RSI).
The purpose of the confirmation indicators is to reduce false signals and improve the accuracy of the trading system. They are designed to confirm the signals generated by the primary indicators by providing additional information about the strength and direction of the trend.
Some examples of confirmation indicators that may be used in the NNFX system include the Bollinger Bands, the MACD (Moving Average Convergence Divergence), and the Stochastic Oscillator. These indicators can provide information about the volatility, momentum, and trend strength of the market, and can be used to confirm the signals generated by the primary indicators.
In the NNFX system, confirmation indicators are used in combination with primary indicators and other filters to create a trading system that is robust and reliable. By using multiple indicators to confirm trading signals, the system aims to reduce the risk of false signals and improve the overall profitability of the trades.
What is a Continuation indicator?
In the NNFX (No Nonsense Forex) trading system, a continuation indicator is a technical indicator that is used to confirm a current trend and predict that the trend is likely to continue in the same direction. A continuation indicator is typically used in conjunction with other indicators in the system, such as a baseline indicator, to provide a comprehensive trading strategy.
What is a Volatility/Volume indicator?
Volume indicators, such as the On Balance Volume (OBV), the Chaikin Money Flow (CMF), or the Volume Price Trend (VPT), are used to measure the amount of buying and selling activity in a market. They are based on the trading volume of the market, and can provide information about the strength of the trend. In the NNFX system, volume indicators are used to confirm trading signals generated by the Moving Average and the Relative Strength Index. Volatility indicators include Average Direction Index, Waddah Attar, and Volatility Ratio. In the NNFX trading system, volatility is a proxy for volume and vice versa.
By using volume indicators as confirmation tools, the NNFX trading system aims to reduce the risk of false signals and improve the overall profitability of trades. These indicators can provide additional information about the market that is not captured by the primary indicators, and can help traders to make more informed trading decisions. In addition, volume indicators can be used to identify potential changes in market trends and to confirm the strength of price movements.
What is an Exit indicator?
The exit indicator is used in conjunction with other indicators in the system, such as the Moving Average (MA), the Relative Strength Index (RSI), and the Average True Range (ATR), to provide a comprehensive trading strategy.
The exit indicator in the NNFX system can be any technical indicator that is deemed effective at identifying optimal exit points. Examples of exit indicators that are commonly used include the Parabolic SAR, the Average Directional Index (ADX), and the Chandelier Exit.
The purpose of the exit indicator is to identify when a trend is likely to reverse or when the market conditions have changed, signaling the need to exit a trade. By using an exit indicator, traders can manage their risk and prevent significant losses.
In the NNFX system, the exit indicator is used in conjunction with a stop loss and a take profit order to maximize profits and minimize losses. The stop loss order is used to limit the amount of loss that can be incurred if the trade goes against the trader, while the take profit order is used to lock in profits when the trade is moving in the trader's favor.
Overall, the use of an exit indicator in the NNFX trading system is an important component of a comprehensive trading strategy. It allows traders to manage their risk effectively and improve the profitability of their trades by exiting at the right time.
How does Loxx's GKD (Giga Kaleidoscope Modularized Trading System) implement the NNFX algorithm outlined above?
Loxx's GKD v1.0 system has five types of modules (indicators/strategies). These modules are:
1. GKD-BT - Backtesting module (Volatility, Number 1 in the NNFX algorithm)
2. GKD-B - Baseline module (Baseline and Volatility/Volume, Numbers 1 and 2 in the NNFX algorithm)
3. GKD-C - Confirmation 1/2 and Continuation module (Confirmation 1/2 and Continuation, Numbers 3, 4, and 5 in the NNFX algorithm)
4. GKD-V - Volatility/Volume module (Confirmation 1/2, Number 6 in the NNFX algorithm)
5. GKD-E - Exit module (Exit, Number 7 in the NNFX algorithm)
(additional module types will added in future releases)
Each module interacts with every module by passing data between modules. Data is passed between each module as described below:
GKD-B => GKD-V => GKD-C(1) => GKD-C(2) => GKD-C(Continuation) => GKD-E => GKD-BT
That is, the Baseline indicator passes its data to Volatility/Volume. The Volatility/Volume indicator passes its values to the Confirmation 1 indicator. The Confirmation 1 indicator passes its values to the Confirmation 2 indicator. The Confirmation 2 indicator passes its values to the Continuation indicator. The Continuation indicator passes its values to the Exit indicator, and finally, the Exit indicator passes its values to the Backtest strategy.
This chaining of indicators requires that each module conform to Loxx's GKD protocol, therefore allowing for the testing of every possible combination of technical indicators that make up the six components of the NNFX algorithm.
What does the application of the GKD trading system look like?
Example trading system:
Backtest: Strategy with 1-3 take profits, trailing stop loss, multiple types of PnL volatility, and 2 backtesting styles
Baseline: Hull Moving Average
Volatility/Volume: Hurst Exponent
Confirmation 1: Volatility Adaptive RSX w/ Dual DSL as shown on the chart above
Confirmation 2: Williams Percent Range
Continuation: Fisher Transform
Exit: Rex Oscillator
Each GKD indicator is denoted with a module identifier of either: GKD-BT, GKD-B, GKD-C, GKD-V, or GKD-E. This allows traders to understand to which module each indicator belongs and where each indicator fits into the GKD protocol chain.
Giga Kaleidoscope Modularized Trading System Signals (based on the NNFX algorithm)
Standard Entry
1. GKD-C Confirmation 1 Signal
2. GKD-B Baseline agrees
3. Price is within a range of 0.2x Volatility and 1.0x Volatility of the Goldie Locks Mean
4. GKD-C Confirmation 2 agrees
5. GKD-V Volatility/Volume agrees
Baseline Entry
1. GKD-B Baseline signal
2. GKD-C Confirmation 1 agrees
3. Price is within a range of 0.2x Volatility and 1.0x Volatility of the Goldie Locks Mean
4. GKD-C Confirmation 2 agrees
5. GKD-V Volatility/Volume agrees
6. GKD-C Confirmation 1 signal was less than 7 candles prior
Continuation Entry
1. Standard Entry, Baseline Entry, or Pullback; entry triggered previously
2. GKD-B Baseline hasn't crossed since entry signal trigger
3. GKD-C Confirmation Continuation Indicator signals
4. GKD-C Confirmation 1 agrees
5. GKD-B Baseline agrees
6. GKD-C Confirmation 2 agrees
1-Candle Rule Standard Entry
1. GKD-C Confirmation 1 signal
2. GKD-B Baseline agrees
3. Price is within a range of 0.2x Volatility and 1.0x Volatility of the Goldie Locks Mean
Next Candle:
1. Price retraced (Long: close < close or Short: close > close )
2. GKD-B Baseline agrees
3. GKD-C Confirmation 1 agrees
4. GKD-C Confirmation 2 agrees
5. GKD-V Volatility/Volume agrees
1-Candle Rule Baseline Entry
1. GKD-B Baseline signal
2. GKD-C Confirmation 1 agrees
3. Price is within a range of 0.2x Volatility and 1.0x Volatility of the Goldie Locks Mean
4. GKD-C Confirmation 1 signal was less than 7 candles prior
Next Candle:
1. Price retraced (Long: close < close or Short: close > close )
2. GKD-B Baseline agrees
3. GKD-C Confirmation 1 agrees
4. GKD-C Confirmation 2 agrees
5. GKD-V Volatility/Volume Agrees
PullBack Entry
1. GKD-B Baseline signal
2. GKD-C Confirmation 1 agrees
3. Price is beyond 1.0x Volatility of Baseline
Next Candle:
1. Price is within a range of 0.2x Volatility and 1.0x Volatility of the Goldie Locks Mean
3. GKD-C Confirmation 1 agrees
4. GKD-C Confirmation 2 agrees
5. GKD-V Volatility/Volume Agrees
█ GKD-C Volatility Adaptive RSX w/ Dual DSL
What is RSX?
The Jurik RSX ( Relative Strength Index ) is a technical indicator used in financial markets to measure the strength of price movement. It was developed by Mark Jurik and is based on the RSI formula, with the addition of smoothing and other modifications.
The Jurik RSX is designed to be smoother and more responsive than traditional RSI indicators, making it more useful for detecting trends and trading signals. It is also less prone to false signals and noise, which can be a problem with some other technical indicators.
The Jurik RSX can be used in a variety of ways, including as a trend-following indicator or a momentum indicator . It can also be combined with other indicators and trading strategies to improve overall performance.
What are DSL Discontinued Signal Line?
A lot of indicators are using signal lines in order to determine the trend (or some desired state of the indicator) easier. The idea of the signal line is easy : comparing the value to it's smoothed (slightly lagging) state, the idea of current momentum/state is made.
Discontinued signal line is inheriting that simple signal line idea and it is extending it : instead of having one signal line, more lines depending on the current value of the indicator.
"Signal" line is calculated the following way :
When a certain level is crossed into the desired direction, the EMA of that value is calculated for the desired signal line
When that level is crossed into the opposite direction, the previous "signal" line value is simply "inherited" and it becomes a kind of a level
This way it becomes a combination of signal lines and levels that are trying to combine both the good from both methods.
In simple terms, DSL uses the concept of a signal line and betters it by inheriting the previous signal line's value & makes it a level.
You can choose from either anchored and unanchored DSL. You can also use zero-line crosses without DSL.
Requirements
Inputs
Confirmation 1 and Solo Confirmation: GKD-V Volatility / Volume indicator
Confirmation 2: GKD-C Confirmation indicator
Outputs
Confirmation 2 and Solo Confirmation Complex: GKD-E Exit indicator
Confirmation 1: GKD-C Confirmation indicator
Continuation: GKD-E Exit indicator
Solo Confirmation Simple: GKD-BT Backtest strategy
Additional features will be added in future releases.

Reversal Finder by nnamWhat does this indicator do?
In short, this indicator looks for patterns using Relative Directional Strength and plots potential Reversal Areas on the chart. Candlesticks are shaded by a Gradient. This gradient is based on whether or not the market is currently experiencing a positive or negative sentiment.
In the screenshot below you can see that the market is experiencing positive sentiment, but also shows areas of possible resistance and reversal. The example shows the 1 minute timeframe which is very volatile and can show inconsistent results due to inherent volatility. It is recommended to trade the 15min timeframe or higher.
In the screenshot below we see the candle colors are varied with regards to shading. As moves become "stronger" in a particular direction, the candle colors actually switch from standard red/green to Pink and Yellow. This usually indicates an Oversold or Overbought condition.
In the example below, you can see that if an overbought condition no longer exists and the direction of the movement changes, a plotted arrow and line appear on the chart. This indicates a "potential" resistance or support area and "possibly" a reversal in price. (during strong trends, these are usually simple pullback areas and not reversals).
As seen in the screenshot below, an option to extend the lines is included (disabled by default in the settings). Turning this option ON allows the trader to better visualize potential resistance / support areas on the chart by extending the lines to the right.
Used in conjunction with other indicators, this indicator becomes a powerful confirmation tool for your arsenal.
Many settings are fully customizable including gradient color, bar color, line width etc.
I hope you enjoy the indicator and... HAPPY TRADING!
