Pine Script® göstergesi
Stokastik Osilatör

Pine Script® göstergesi

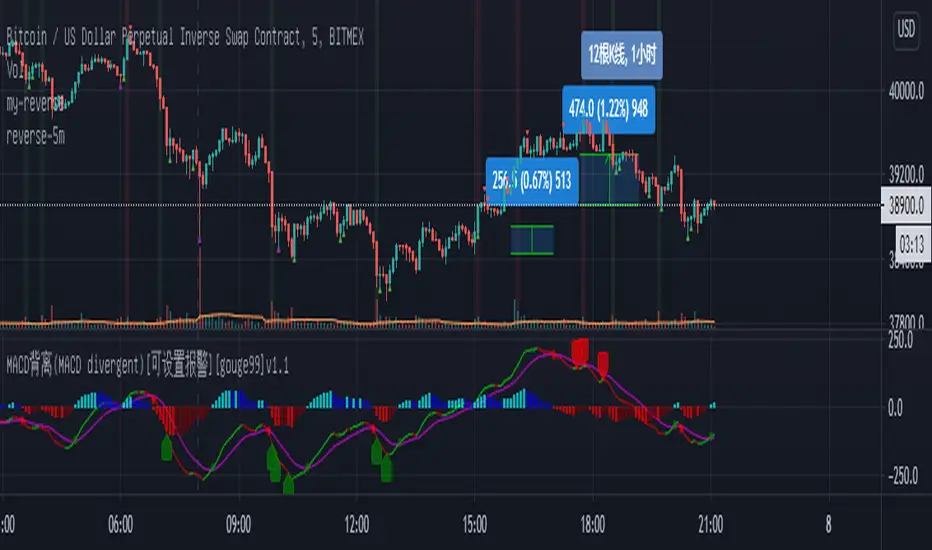
MACD背离(MACD divergent)[公开版][gouge99]注意:背离意味着做反转交易,所以入场要求很高,但是背离一般的收益风险比很大
MACD背离:收盘价创造新高或者新低,但是macd却没有出新高或者新低
计算原理:根据历史K线长度(默认90根K线)来判断收盘价的高低极值和macd的高低极值来进行比较判断
建议使用:
1.在震荡调整行情中,在支撑和压力位附近出现的突然的趋势K线,一般是假突破
2.在趋势末端,一般还会有一次缓慢的测试趋势极点的行情,一般这是趋势反转进入震荡的开始
3.结合其他形态如双顶,头肩,pin bar
4.结合其他指标如stoch随机指标做反转
5.推荐在1h, 30m, 15m级别中使用,5m也可以使用,但是最好背离计算长度设置大一点 比如150
Pine Script® göstergesi
Pine Script® göstergesi

Stoch + Stoch RSI [R1984]Simple comparison of stochastic based on price versus stochastic based on RSI.
Plan to add more features later like divergence indications, light/dark mode toggle, etc.
Pine Script® göstergesi

Hara's Favorit Stochastic 2BBs by Theo ParkThis indicator include :
- Stochastic
- Bollinger Bands of Stochastic
- Fibonacci based Bollinger Bands of Stochastic
with fill background color options for each BB. (upper and lower)
Pine Script® göstergesi

Triple Stochastic3 stochastic K-lines with short, medium & long periods & the D-lines removed.
Provides a good indication of where you are in the current supply/demand cycle & I find it helpful for timing entries.
Look for peaks & valleys formed by 2 or 3 lines, & entry would be when they start to turn around.
Try it on multiple timeframes & of course use confluence with other indicators & data.
Pine Script® göstergesi
Pine Script® göstergesi

yutas_RSI_Stochastic_BBver .1.0
Produce a combined signature of RSI, Stochastic and BB.
MTF compatible.
With alert function.
-----------------------------------------------------------------
RSIとStochasticとBBの複合サインを出します。
MTF対応。
アラート機能付き。
-----------------------------------------------------------------
Pine Script® göstergesi

Stoch + Stoch BB + Stoch BB with Fibnacci sequence by Theo ParkThis indicator contains :
- 1 Stochastic
- 1 Stochastic Bollinger Bands
the source of the Bollinger Bands is the %K of the Stochastic obove
- 1 Fibonacci Bollinger Bands
Stochastic Bollinger Bands with Fibonacci sequence like
0.236, 0.382, 0.5, 0.618, 0.764, 1..
Pine Script® göstergesi
Helios v1.0 - by @cryptomrdavis -1.0
This is another indicator for you guys. From different indicators its get the signals and combines them into one.
Green marks an uptrend and red an downtrend.
Happy trading
+++ use this tool on your own risk. i'm not responsible for your loses. DYOR +++
____________________________________________________________________________
BTC: 1GVRDK3HHr9CKM5SF2CGpCNXFuavB3L4j9
ETH: 0x7b825fa752b9926D3E8397cDb1d9E5473D074646
XMR: 41zL2SQS7zyZmwXKng2TeUWsMi5vMmkgSdDCjULUTvM6ichwm1E2ZDEYGt56zk9ghoM9bekhjycSwa8amtTcB2JiUet5jtg
NEO: AXja5xPDhczfm2ujHyBfpkQAAnMsXsazmb
TRX: THi1L1v2wHJxmQg6Wk9TgkKLcP6x2oMAwf
ZEC: zcZzFkRx95cp7MtuW8wLhC5zz5RYF9QkT2uPPmhZZHc6ppXepHGgCSeAS1rtD6WFdqsM5p1gZm2gfirnrnviucsdP4aCpqU
XLM: GAXUQJSW55C7MAC4GI26NZUGIKSHFDVFRFKZCXPLMPY4HCADSDT55XK6
WAVES: 3PCMkNpMHxSraTCkwV1ENcBKa9sXbVCGjQX
BCH: qz57n04ud6mn42u00aymqkku8tfh0lk4jv9c28mjvv
tippin.me
____________________________________________________________________________
Pine Script® göstergesi

StochastiXMy indicator is probably the most accurate indicator you can use today to make the most profitable trades. It will be open to the public for a limited time only so enjoy it while it is there. Come DM me if you want exactly how to use it. Tips and donations are welcome! I hope you have fun with it ;)
Pine Script® göstergesi

4 Stochastic + RSI + Stochastic RSI by Theo ParkThis indicator contains :
4 stochastics
1 RSI
1 Stochastic RSI
Pine Script® göstergesi

Pine Script® göstergesi

Pine Script® göstergesi

Pine Script® göstergesi

TA-Money Flow-v2, Stochastic OBVNot sure where I originally got this (somewhere off Tradingview several years ago, thanks to the person who shared), just publishing because of a request.
This is basically a stochastic OBV movement indicator. It is good to work with both price and volume. I've updated to be able to display either as positive only, or both sides (50/-50), also included an invert function. It works great on any time frame, but you need to have volume data.
Enjoy.
I've got a version 3 if you're interested.
Pine Script® göstergesi

Stuffed Oscillators/てんこ盛りオシレーターStuffed Oscillators
You can use Stochastic RSI, Stochastic, RSI at once.
てんこ盛りオシレーター
ストキャスティクスRSI, ストキャスティクス, RSIをいっぺんに使えます。
Pine Script® göstergesi

Fisher Stochastic Center of GravityWhat happens when you take the Fisher Transform of a Stochastic Oscillator?
Well, you filter out all the stuff you don't want and are left with super-precise entries!
This indicator works especially well in with a trend-follower in a higher timeframe - iTrend, MAMA, Hull, etc...
How to trade:
Use with another indicator to tell you the current trend.
Take buy and sell signals as you would with the Stoch.
-DasanC
Pine Script® göstergesi

Pine Script® göstergesi

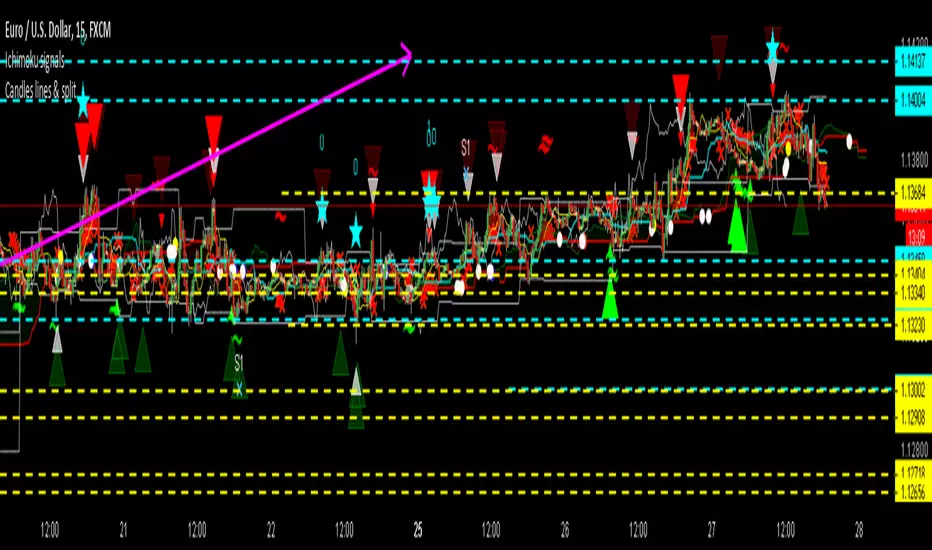
Candles lines & splitTrigger alerts when candle pattern are detected.
More conditions are shown : if previous ichimoku levels are touched, if divergence is being raised.
Pine Script® göstergesi
Pine Script® göstergesi

Modern Advance Stochastic (Hybrid BBMAS)This is a combination of three Stochastics (35, 65 and 100). Each has equal smoothing.
Powerzone: 5-20% and 95-100%
The centre line at 50% is a confirmation trend.
Pine Script® göstergesi
