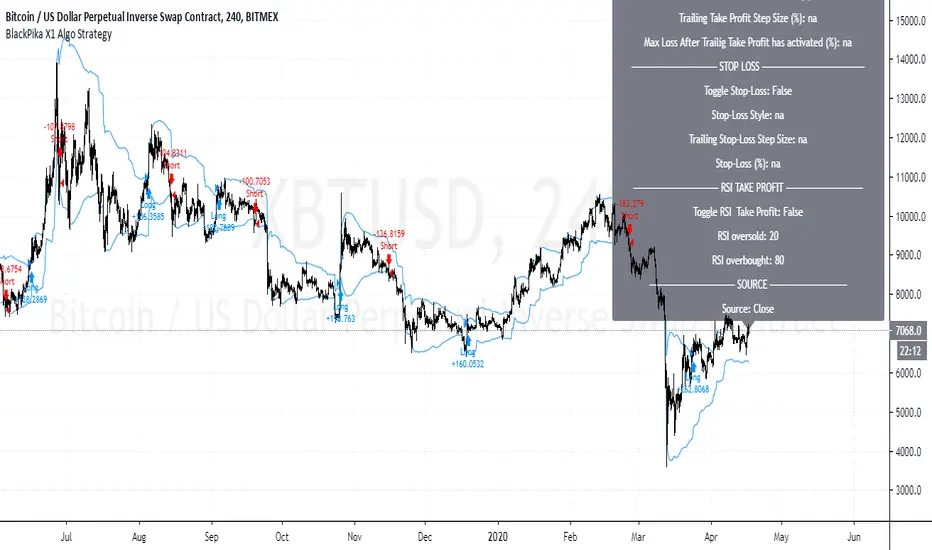
BlackPika X1 Algo StrategyBlackPika X1 Algo is a successor to the original BlackPika Algo.
It uses the following main elements:
RSI
ATR
ADX
Volume
Chopiness Filter
Trailing Profit
Fixed Profit
Trailing Stop loss
Fixed Stop Loss
Donchian channels and some more...
The backtest you see includes a commision of 1% and slippage of 1 tick. and the start date is from 2015
All the above mentioned settings are customisable, and can be adapted to your liking, timeframe and Asset.
Hit me up if you have any questions. This is only a backtest version.
All the best in your trading.
S&P 500 (SPX500)
XPloRR S&P500 Stock Market Crash Detection Strategy v2XPloRR S&P500 Stock Market Crash Detection Strategy v2
Long-Term Trailing-Stop strategy detecting S&P500 Stock Market Crashes/Corrections and showing Volatility as warning signal for upcoming crashes
Detecting or avoiding stock market crashes seems to be the 'Holy Grail' of strategies.
Since none of the strategies that I tested can beat the long term Buy&Hold strategy, the purpose was to detect a stock market crash on the S&P500 and step out in time to minimize losses and beat the Buy&Hold strategy. So beat the Buy&Hold strategy with around 10 trades. 100% capitalize sold trade into new trade.
With the default parameters the strategy generates 10262% profit (starting at 01/01/1962 until release date), with 10 closed trades, 100% profitable, while the Buy&Hold strategy only generates 3633% profit, so this strategy beats the Buy&Hold strategy by 2.82 times !
Also the strategy detects all major S&P500 stock market crashes and corrections since 1962 depending on the Trailing Stop Smoothness parameter, and steps out in time to cut losses and steps in again after the bottom has been reached. The 5 major crashes/corrections of 1987, 1990, 2001, 2008 and 2010 were successfully detected with the default parameters.
The script was first released on November 03 2019 and detected the Corona Crash on March 04 2020 with a Volatility crash-alert and a Sell crash-alert.
I have also created an Alerter Study Script based on the engine of this script, which generates Buy, Sell and Volatility signals.
If you are interested in this Alerter version script, please drop me a mail.
The script shows a lot of graphical information:
the Close value is shown in light-green. When the Close value is temporarily lower than the Buy value, the Close value is shown in light-red. This way it is possible to evaluate the virtual losses during the current trade.
the Trailing Stop value is shown in dark-green. When the Sell value is lower than the Buy value, the last color of the trade will be red (best viewed when zoomed)
the EMA and SMA values for both Buy and Sell signals are shown as colored graphs
the Buy signals are labeled in blue and the Sell signals are labeled in purple
the Volatility is shown below in green and red. The Alert Threshold (red) is default set to 2 (see Volatility Threshold parameter below)
How to use this Strategy?
Select the SPX (S&P500) graph and add this script to the graph.
Look in the strategy tester overview to optimize the values Percent Profitable and Net Profit (using the strategy settings icon, you can increase/decrease the parameters), then keep using these parameters for future Buy/Sell signals on the S&P500.
More trades don't necessarily generate more overall profit. It is important to detect only the major crashes and avoid closing trades on the smaller corrections. Bearing the smaller corrections generates a higher profit.
Watch out for the Volatility Alerts generated at the bottom (red). The Threshold can by changed by the Volatility Threshold parameter (default=2% ATR). In almost all crashes/corrections there is an alert ahead of the crash.
Although the signal doesn't predict the exact timing of the crash/correction, it is a clear warning signal that bearish times are ahead!
The correction in December 2018 was not a major crash but there was already a red Volatility warning alert. If the Volatility Alert repeats the next weeks/months, chances are higher that a bigger crash or correction is near. As can be seen in the graphic, the deeper the crash is, the higher and wider the red Volatility signal goes. So keep an eye on the red flag!
Here are the parameters:
Fast MA Buy: buy trigger when Fast MA Buy crosses over the Slow MA Buy value (use values between 10-20)
Slow MA Buy: buy trigger when Fast MA Buy crosses over the Slow MA Buy value (use values between 21-50)
Minimum Buy Strength: minimum upward trend value of the Fast MA Buy value (directional coefficient)(use values between 10-100)
Fast MA Sell: sell trigger when Fast MA Sell crosses under the Slow MA Sell value (use values between 10-20)
Slow MA Sell: sell trigger when Fast MA Sell crosses under the Slow MA Sell value (use values between 21-50)
Minimum Sell Strength: minimum downward trend value of the Fast MA Sell value (directional coefficient)(use values between 10-100)
Trailing Stop ATR: trailing stop % distance from the smoothed Close value (use values between 2-20)
Trailing Stop Smoothness: MA value for smoothing out the Trailing Stop close value
Buy On Start Date: force Buy on start date even without Buy signal (default: true)
Sell On End Date: force Sell on end date even without Sell signal (default: true)
Volatility EMA Period: MA value of the Volatility value (default 15)
Volatility Threshold: Threshold value to change volatility graph to red (default 2)
Volatility Graph Scaler: Scaling of the volatility graph (default 5)
Important : optimizing and using these parameters is no guarantee for future winning trades!

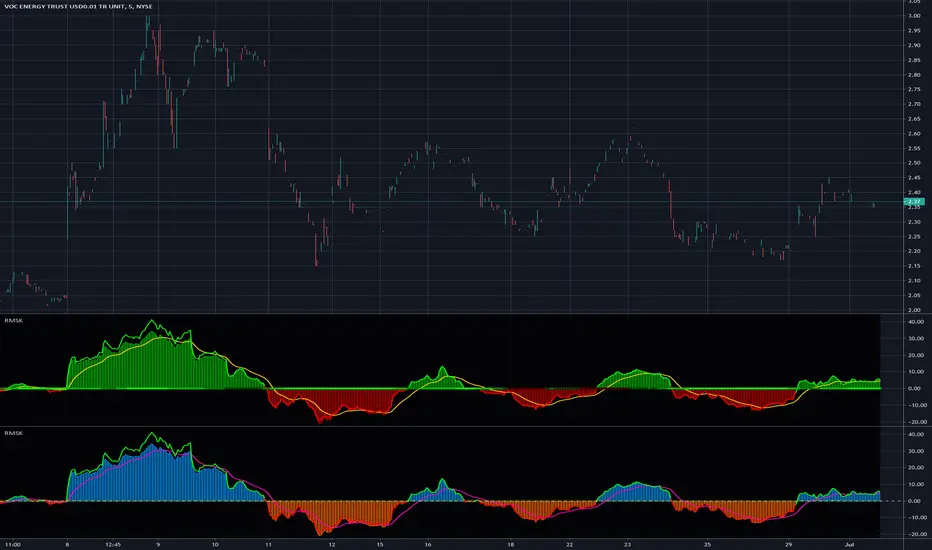
Relative Strength(RSMK) + Perks - Markos KatsanosIf you are desperately looking for a novel RSI, this isn't that. This is another lesser known novel species of indicator. Hot off the press, in multiple stunning color schemes, I present my version of "Relative Strength (RSMK)" employing PSv4.0, originally formulated by Markos Katsanos for TASC - March 2020 Traders Tips. This indicator is used to compare performance of an asset to a market index of your choosing. I included the S&P 500 index along side the Dow Jones and the NASDAQ indices selectively by an input() in "Settings". You may comparatively analyze other global market indices by adapting the code, if you are skilled enough in Pine to do so.
With this contribution to the Tradingview community, also included is MY twin algorithmic formulation of "Comparative Relative Strength" as a supplementary companion indicator. They are eerily similar, so I decided to include it. You may easily disable my algorithm within the indicator "Settings". I do hope you may find both of them useful. Configurations are displayed above in multiple scenarios that should be suitable for most traders.
As always, I have included advanced Pine programming techniques that conform to proper "Pine Etiquette". For those of you who are newcomers to Pine Script, this script may also help you understand advanced programming techniques in Pine and how they may be utilized in a most effective manner. Utilizing the "Power of Pine", I included the maximum amount of features I could surmise in an ultra small yet powerful package, being less than a 60 line implementation at initial release.
Unfortunately, there are so many Pine mastery techniques included, I don't have time to write about all of them. I will have to let you discover them for yourself, excluding the following Pine "Tricks and Tips" described next. Of notable mention with this release, I have "overwritten" the Pine built-in function ema(). You may overwrite other built-in functions too. If you weren't aware of this Pine capability, you now know! Just heed caution when doing so to ensure your replacement algorithms are 100% sound. My ema() will also accept a floating point number for the period having ultimate adjustability. Yep, you heard all of that properly. Pine is becoming more impressive than `impressive` was originally thought of...
Features List Includes:
Dark Background - Easily disabled in indicator Settings->Style for "Light" charts or with Pine commenting
AND much, much more... You have the source!
The comments section below is solely just for commenting and other remarks, ideas, compliments, etc... regarding only this indicator, not others. When available time provides itself, I will consider your inquiries, thoughts, and concepts presented below in the comments section, should you have any questions or comments regarding this indicator. When my indicators achieve more prevalent use by TV members, I may implement more ideas when they present themselves as worthy additions. As always, "Like" it if you simply just like it with a proper thumbs up, and also return to my scripts list occasionally for additional postings. Have a profitable future everyone!
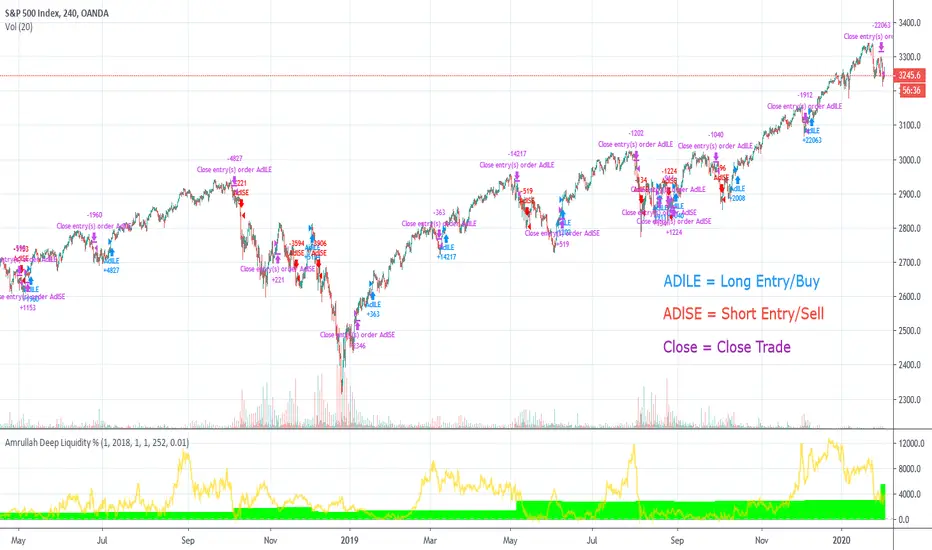
Amrullah Deep Liquidity for S&P 500Amrullah Deep Liquidity (ADL)
Amrullah Deep Liquidity (ADL) is a high profit factor strategy based on models designed by Muhd Amrullah.
Choosing your trading pair that you are planning to backtest
Check that you have been given access to Amrullah Deep Liquidity (ADL). Select SPX500USD with the default 4H time frame. Once done, open Indicators > Invite-Only Scripts > Amrullah Deep Liquidity %.
Choosing your initial capital that you want to begin backtesting
Go to Settings > Properties > Initial Capital and type in the amount of capital you're starting with. For the SPX500USD trading pair, the initial capital is denominated in USD.
Adjusting your equity at risk until the trades match your risk profile and comfort level
Go to Inputs > Equity Risk and adjust the value you are comfortable with. To analyse performance, you also want to choose the Start Year, Start Month and Start Date. Select lower equity risk for trades that you intend to take without the use of leverage. You can select an equity risk from 0.001 to 0.05 or all the way to 1.
Finding the time frame with the highest profit factor
Profit factor is defined as the gross profit a strategy makes across a defined period of time divided by its gross loss. You may choose to scroll through other time frames to find better models. You can select a different time frame from 1 min to 1H or all the way to 1M. Once you find the model you desire, you are encouraged to check that the model has a backtested profit factor of >3.5. You can then begin looking through the Performance Summary to find other detailed statistics.
Analysing the equity curve from the Amrullah Deep Liquidity (ADL) strategy
A green equity curve indicates that the trades are accumulating profits. A red equity curve indicates that the trades are accumulating losses. A healthy equity curve is one that is green and grows steadily to the right and upward direction.
Analysing the display arrows on the chart
Amrullah Deep Liquidity (ADL) tells you when to take a trade and how much to put in a trade. ADL can do this as the model identifies inventory risk in traders and market makers in the chosen market. On your Tradingview chart, ADL will display an arrow that tells you when to enter a trade. You can also see the amount to trade beside the arrow.
Opting for a trial
Yes you may opt for a trial which has limited availability.
The author's background and experience
My career in software and deep learning development spans across more than 5 years. At work, I lead a team to solve core computer vision tasks for large companies. I continually read all kinds of computer science books and papers, and follows progress on tools used in financial markets.
Candlesticks ANN for Stock Markets TF : 1WHello, this script consists of training candlesticks with Artificial Neural Networks (ANN).
In addition to the first series, candlesticks' bodies and wicks were also introduced as training inputs.
The inputs are individually trained to find the relationship between the subsequent historical value of all candlestick values 1.(High,Low,Close,Open)
The outputs are adapted to the current values with a simple forecast code.
Once the OHLC value is found, the exponential moving averages of 5 and 20 periods are used.
Reminder : OHLC = (Open + High + Close + Low ) / 4
First version :
Script is designed for S&P 500 Indices,Funds,ETFs, especially S&P 500 Stocks,and for all liquid Stocks all around the World.
NOTE: This script is only suitable for 1W time-frame for Stocks.
The average training error rates are less than 5 per thousand for each candlestick variable. (Average Error < 0.005 )
I've just finished it and haven't tested it in detail.
So let's use it carefully as a supporter.
Best regards !

Buffet Indicator [QuantNomad]Created a version of Buffet Indicator for TradingView.
He calls it "the best single measure of where valuations stand at any given moment".
Computations are very simple, it is simply the ratio between total stock market capitalization and US GDP.
I used the S&P 500 capitalization instead of the total so value here might be a bit lower than in the original indicator.
Very high values might mean that we're now in a bubble and correction might follow shortly.

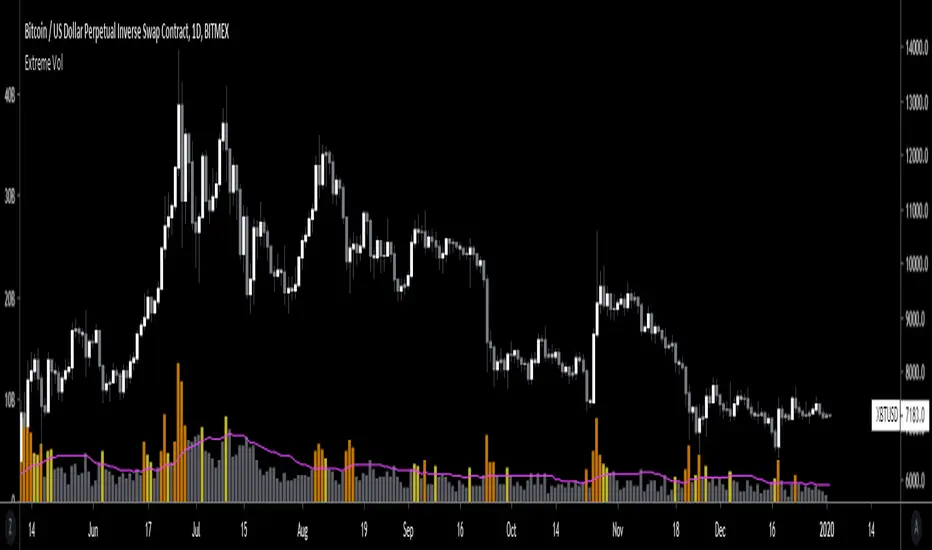
Extreme VolumeThis indicator colors volume bars that are significantly higher volume than the vol moving average ( SMA ). Utilizes two multiplier that can be adjusted by user. Defaults are that the indicator colors volume bars yellow if 20% higher than average, and orange if over 50% higher than average.
Reason why i created this indicator is i typically don't care about volume unless it is significantly higher than average. I find extreme volume useful for confirmation of a breakout, etc. This is why the rest of the volume bars are gray, they are still available for reference, but I dont pay much attention until volume is higher than average.
Also, when you load this indicator it will be in its own pane below the chart. To try and figure out how to add it to same pane as the chart was a huge pain in the ass. Once you figure it out it is pretty easy. I'll try to explain below...
Next to the indicator name you have the following options ... Hide, Settings, Show Source Code{}, Delete(X), and More (3 dots)
1) Click on "More" (3 dots)
2) Click on "Move To" then chose "Existing Pane Above"
3) Volume will likely be too large. Volume scale should be on left side, use your mouse to adjust volume smaller
4) Volume will likely be in the middle of your chart, click on it and drag it down.
Live Mini Terminal 6 : Major U.S Indices Change DataThis script displays relative data changes occurring in the adjustable period and/or adaptive automatic period in US Major Indices.
It was inspired by the data terminals used by commercial traders.
Period selection can be adjusted in the menu.
This script uses the adaptive period algorithm used by Autonomous LSTM and Relativity scripts.
Or you can set the period manually from the menu.
For more information about adaptive period this script uses:
This script works only for 1 day (1D) and 1 week (1W) time frames.
The most efficient time frame is 1 week (1W) because of different time-zones .
Features
Value changes on a percentage basis (%)
Recently, due to increasing interest, the NQNACE index has been added.
Index descriptions are printed on the information panel.
Sentiment NYSE ARCA and AMEX indices added.
INSTRUMENTS
SP1! : S&P 500 Futures Index
DJI : Dow Jones Industrial Average Index
NDX : Nasdaq 100 Index
RUT : Russell 2000 Index
NYA : NYSE Composite Index
OSX : PHLX Oil Service Sector Index
HGX : PHLX Housing Sector Index
UTY : PHLX Utility Sector Index
SOX : PHLX Semiconductor Sector Index
SPSIBI : S&P Biotechnology Select Industry Index
XNG : NYSE ARCA Natural Gas Index
SPGSCI : S&P Goldman Sachs Commodity Index
XAU : PHLX Gold and Silver Sector Index
SPSIOP : S&P Oil and Gas Exploration and Production Select Industry Index
GDM : NYSE ARCA Gold Miners Index
DRG : NYSE ARCA Pharmaceutical Index
TOB : NYSE ARCA Tobacco Index
DFI : NYSE ARCA Defense Index
NWX : NYSE ARCA Networking Index
XCI : NYSE ARCA Computer Technology
XOI : AMEX Oil Index
XAL : AMEX Airline Index
NQNACE : Nasdaq Yewno North America Cannabis Economy Index
USAGE
The script can be used as an indicator by putting it under the chart as shown above.
It is necessary to enlarge to see clearly.
Since it is not often looked at,such use is the best method for healthy interpretation.
Regards.

TradersAI - Test 3**** This is a TEST script only! Do NOT use on real money accounts! *****
***** Intended to be used in testing by invited_only members *****
***** If you want to participate in our testing using your paper trading account(s), send me a private message *****

TradersAI Test Script 1This is a script to test trading flows from an invite only script to one's trading view chart and then possibly to one of the connected brokers.
**** Do NOT use on real funds - this randomly triggers trades. Do NOT use on real money accounts. ******

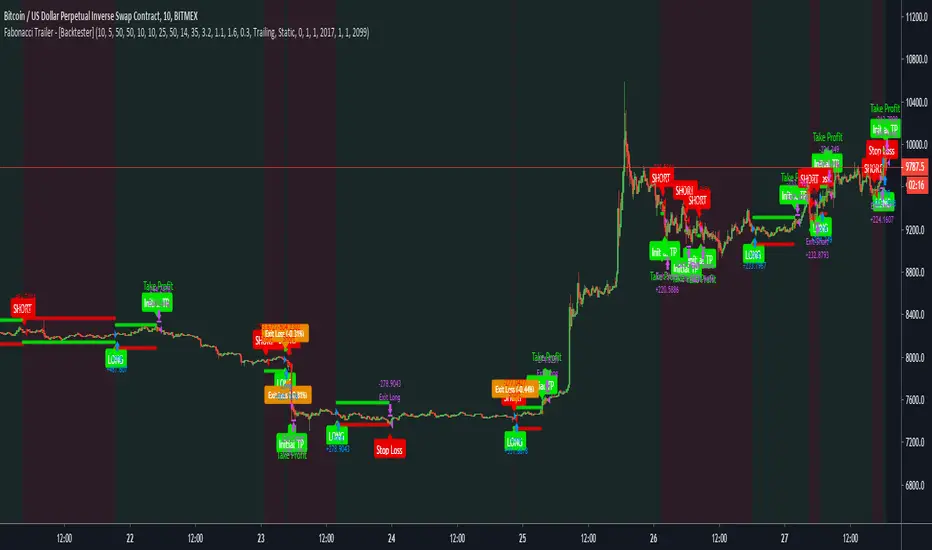
Fabonacci Trailer - [Backtester]This study comes with the following indicators and features:
ADX indicator
Chop indicator
Super Trend indicator
Trailing Take Profit and Stop Loss
Entry, Take Profit, and Stop Loss Alerts
Renko chart support
And a few more indicators in the back-end to increase accuracy and optimize entries
The study version with all alerts can be found in my profile. It is not repainting and we advise to use alerts on “Once Per Bar Close”.
Please note that this script is based on invite only.
Fabonacci Trailer - [Alerts]This script comes with the following indicators and features:
ADX indicator
Chop indicator
Super Trend indicator
Trailing Take Profit and Stop Loss
Entry, Take Profit, and Stop Loss Alerts
Renko chart support
And a few more indicators in the back-end to increase accuracy and optimize entries
This script works really well as a scalper on lower Time Frames as well as on higher Time Frames. Besides that you can also use it on pretty much any coin or asset.
This script is not repainting. We advise to use alerts on “Once Per Bar Close”.
If you’d like to automate this script you can do that by using AutoView, ProfitView, ProfitTrailer, CryptoHopper etc.
Please note that this script is based on invite only.

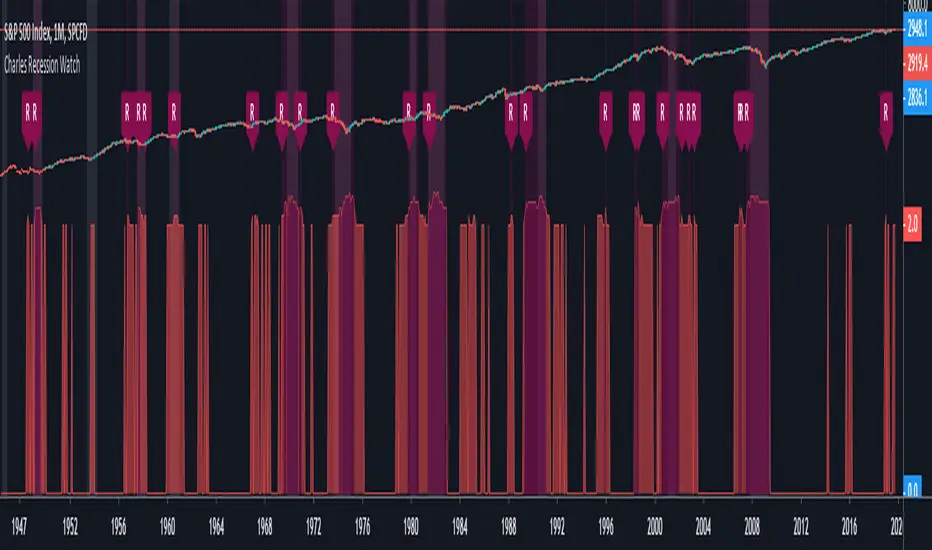
Charles Recession WatchThe “Recession Watch” indicator tracks 7 key economic metrics which have historically preceded US recessions. It provides a real-time indication of incoming recession risk.
This indicator gives a picture of when risk is increasing, and therefore when you might want to start taking some money out of risky assets.
All of the last seven recessions were preceded by a risk score of 3 or higher. Six of them were preceded by a risk score of 4 or higher. Unfortunately data prior to 1965 was inconsistent and prior recessions could not be considered.
Based on the indicator hit rate at successfully flagging recessions over the last 50 years, risk scores have the following approximate probabilities of recession:
- 0-1: Low
- 2: 25% within next 18 months
- 3: 30% within next 12 months
- 4-7: 50% within next 12 months
Note that a score of 3 is not necessarily a cause for panic. After all, there are substantial rewards to be had in the lead up to recessions (averaging 19% following yield curve inversion). For the brave, staying invested until the score jumps to 4+, or until the S&P500 drops below the 200day MA, will likely yield the best returns.
Notes on use:
- use MONTHLY time period only (the economic metrics are reported monthly)
- If you want to view the risk Score (1-7) you need to set your chart axis to "Logarithmic"
Enjoy and good luck!
(JS)S&P 500 Volatility Oscillator For Options 2.0I am going to start taking requests to open source my indicators and they will also be updated to Version 4 of Pinescript.
I added some features to the original code such the ability to smooth the oscillator and select the look back periods for the historical volatility.
Link to original:
Original post:
"The idea for this started here: www.tradingview.com with the user @dime
This should only be used on SPX or SPY (though you could use it on other things for correlation I suppose) given that the instrument used to create this calculation is derived from the S&P 500 (thank you VIX ). There's a lot of moving parts here though, so allow me to explain...
First: The main signal is when Implied Volatility (from VIX ) drops beneath Historical Volatility - which is what you want to see so you aren't purchasing a ton of premium on long options. Green and above 0 means that IV% has dropped lower than Historical Volatility . (this signal, for example, would suggest using a Long Call or Put depending on your sentiment)
Second: The green line running underneath zero is the bottom portion of the "Average True Range" derived from the values used to create the oscillator. the closer the bottom histogram is to the green line, the more "normal" IV% is. Obviously, if this gets far away from the line then it could be setting up nicely to short options and sell the IV premium to someone else. (this signal, for example, would suggest using something like a Bull Put Spread)
Third: The red background along with the white line that drops down below zero signals when (and how far) the IV% from 3 months out (from VIX3M ) is less than the current IV%. This would signal the current environment has IV way too high, a signal to short options once again (and don't take any long option positions!).
Tried to make this simple, yet effective. If you trade options on SPX , SPY , even ES1! futures - this is a tool tailored specifically for you! As I said before, if you want you can use it for correlation on other securities. Any other ideas or suggestions surrounding this, please let me know! Enjoy!
Feb 17, 2019
Release Notes: Cosmetic update for a much cleaner look:
-Replaced the "HIGH IV" with a simlple "H"
-Now the white line is constantly showing you the relationship between VIX and VIX3M - when VIX is greater than VIX3M the background still goes red
-However, now when VIX drops below Historical Volatility, the background is bright green
-When both above are true - it's dark green
-The Average True Range on the bottom is now a series of crosses"

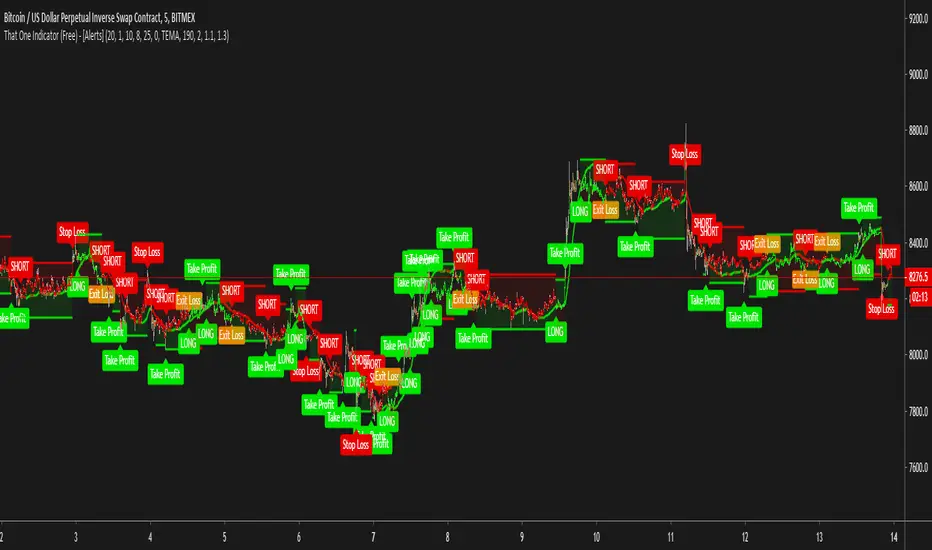
That One Indicator (Free) - [ALERTS]This script comes with the following indicators:
Bollinger Bands
Stochastic
Moving Average Trend Confirmation Filter (EMA, SMA)
Long/Short Alerts
Stop Loss Alerts
And a few more indicators in the back-end to increase accuracy
This script works really well as a scalper on lower Time Frames as well as on higher Time Frames. Besides that you can also trade it on pretty much any coin or asset.
This script is not repainting. We advise to use alerts on “Once Per Bar Close” .
If you’d like to automate this script you can do that by using AutoView, ProfitView, ProfitTrailer, CryptoHopper etc.
Alerts are set very clearly as Long and Short to avoid confusion.
A new script is being published soon with a lot more functionality, which includes noise filtering, all MA Types, RSI and other types of volatility measurements to filter out “less profitable” trades.
Feel free to leave a comment and share it with your friends.
Mega Trend Plus - S&P 500 Trend Follower / Market GaugeFirstly, 100% of the credit goes to Greg Morris @ Stockcharts.com for the article detailing the concept and most of the settings/components. I've simply implemented his idea. I haven't sought permission from him, but given that he was open with the components of the indicator I'm assuming he's happy for me to go ahead and code this in pinescript. See the article here: stockcharts.com
Okay, so this is part of a system/indicator Greg outlined in the article that he calls Trend Gauge. The idea is fairly simple: take a group of indexes that cover the breadth of the market you want to trade, track their relationship/position to their 200 period Exponential Moving Average (EMA), and assign scores to bull/bear crosses + relative location to the EMA. Once you've normalized and aggregated the scores you finish up with a trend following indicator that works surprisingly well.
This part is called Mega Trend Plus, and tracks whether an index is above or below its 200 period EMA. I'll be releasing the second part ("Trend Strength") soon. Once that's done I'll combine them to form the full "Trend Gauge" indicator.
I decided to provide the base version that people can then experiment with and tweak to their liking, so Greg's version shown in the article is smoother than the one provided here. It's up to you to play with smoothing options, and potentially tweak the weightings of the various components. Please see the script for info on what the various inputs are - I've added notes there.
So, how does it do? Well, as you can see from the chart above it works pretty well overall. The S&P 500 has been fairly trendy over the last few decades, so it's been prime territory for a system like this. It would have kept you out of the big bear markets (particularly GFC & 2015-16), and that's the goal of any trend-based system. They thrive on how little they lose, not necessarily on how much they make.
As you can see, the indicator is pretty choppy. So it's not designed (in the current configuration) to provide accurate buy/hold/sell signals. It currently functions more as a market gauge / strength indicator.
Hopefully you find this concept interesting. It's simple, but the best systems often are.
Please add comments below if you come up with an interesting configuration or variation.
Let me know if you have any queries.
DD

Ppsignal GSV V1Entry pattern GSV (Greatest Swing Value)
We return with another Larry Williams pattern, the Greatest Swing Value or GSV, in principle this pattern was developed for the S & P 500, but it could be extrapolated to other markets, as with the previous pattern we will only explain it for long positions. First of all we have calculated the difference between the maximum and the opening of the last 4 bars and its average, that is to say: /4. Being H the maximum of each bar and the O the opening price of each bar. From this average we will extract 180%, that is, we will multiply it by 1.8. The value of this result will be the GSV.
The logic of this GSV entry pattern is as follows: a widely used way to enter the markets is the breaking of highs, but many times false breakdowns occur or what Larry Williams calls "failure swings", to avoid these false ruptures Larry invented the GSV, which is like a moving average applied to the Swing Value (the difference between the maximum and the opening price).
Once we have the GSV we must add it to the opening price of the current bar and the entry will occur when the price exceeds this level.
to determine the entrance we use bollinguer band and atr. In this way we enter the pattern with volatility.
Patrón de entrada GSV (Greatest Swing Value)
Para esta tecnica usamos la volatilidad para determinar entradas, bollinguer band 13.1 y atr...
Volvemos con otro patrón de Larry Williams, el Greatest Swing Value o GSV, en principio estepatrón fue desarrollado para el S&P 500, pero se podría extrapolar a otros mercados, al igual que con el patrón anterior solamente lo explicaremos para posiciones largas. Primero de todo hemos calculado la diferencia entre el máximo y la apertura de las 4 últimas barras y hacersu media, es decir: /4. Siendo H el máximo de cada barra y la O el precio de apertura de cada barra. De esta media sacaremos el 180%, es decir, lo multiplicaremos por 1.8. El valor de este resultado será el GSV.
La lógica de este patrón de entrada GSV es la siguiente: una forma bastante usada para entraren los mercados es la ruptura de máximos, pero muchas veces se producen rupturas falsas o loque Larry Williams llama "failure swings", para evitar estas rupturas falsas Larry inventó el GSV,que es como una media móvil aplicada al Swing Value (la diferencia entre el máximo y el preciode apertura).
Una vez tenemos el GSV deberemos sumárselo al precio de apertura de la barra actual y la entrada se producirá cuando el precio supere este nivel.
para determinar la entrada usamos bollinguer band y atr. des esta manera entramos al patron con volatilidad.

PpSignal EWO BB IndexI have developed an indicator based on the oscillator of that with the escape bands, where we can see the relationship between the Vix. (histogram), Nasdaq color lime and SP500 color green.
it is very important to consider the relationship vix with these indices ...

Yaonology SPY StrategyOnly use this strategy in the US stock market. Especially use in SPY.
www.yaonology.com

A.I.Driven TradersAI Model Trades for 20190612The entry and exit levels here are NOT derived from any specific indicator but are coming from our A.I. driven proprietary models.
This is an attempt at exploring the trading community here at TradingView and sharing our daily trading plans published at our site with the community here in the form a Pine Script - just starting and learning this platform. Please help point out any obvious errors or gotchas committed in the scripts. Thanks and have a great trading day!
**** The Trading Plan Published for today ****
>>>> Medium-Frequency Models: <<<<< For today, Wednesday 06/12, our medium-frequency models indicate using the 2895 as a pivot point - opening a long on a break above 2895, and opening a short on a break below 2895 (wait for a close on at least a five minute chart to determine the break), both sides with a 9-point trailing stop.
Note: For the trades to trigger, the breaks should occur during the regular session hours starting at 9:30am ET. By design, these models do NOT open any new positions after 3:45pm. Only one open position at any given time.
>>>>> Aggressive Intraday Models: <<<<< For today, Wednesday 06/12, our aggressive intraday models indicate going long on a break above 2892 or 2875 with an 6-point trailing stop, and going short on a break below 2887 or 2878 with an 8-point trailing stop.
Note: For the trades to trigger, the breaks should occur during regular session hours starting at 9:30am ET. Due to the intraday nature of these aggressive models, they indicate closing any open trades at 3:55pm and remaining flat into the session close. No opening of new positions after 3:45pm. Only one open position at any given time.

PpSignal quantiles BandIn statistics and the theory of probability, quantiles are cutpoints dividing the range of a probability distribution into contiguous intervals with equal probabilities, or dividing the observations in a sample in the same way. There is one less quantile than the number of groups created. Thus quartiles are the three cut points that will divide a dataset into four equal-size groups (cf. depicted example). Common quantiles have special names: for instance quartile, decile (creating 10 groups: see below for more). The groups created are termed halves, thirds, quarters, etc., though sometimes the terms for the quantile are used for the groups created, rather than for the cut points. q-Quantiles are values that partition a finite set of values into q subsets of (nearly) equal sizes. There are q − 1 of the q-quantiles, one for each integer k satisfying 0 < k < q. In some cases the value of a quantile may not be uniquely determined, as can be the case for the median (2-quantile) of a uniform probability distribution on a set of even size. Quantiles can also be applied to continuous distributions, providing a way to generalize rank statistics to continuous variables. When the cumulative distribution function of a random variable is known, the q-quantiles are the application of the quantile function (the inverse function of the cumulative distribution function) to the values {1/q, 2/q, …, (q − 1)/q}

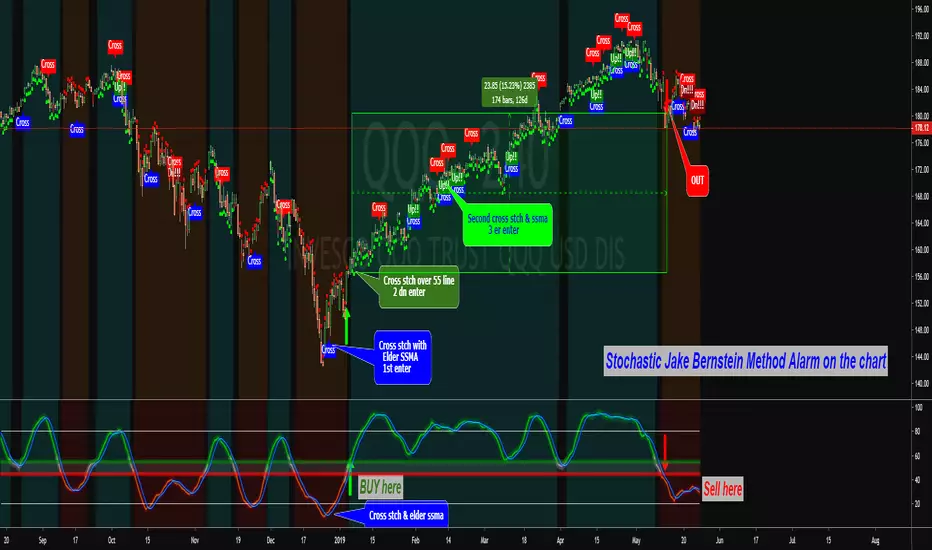
PpSignal Stochastic Jake Bernstein Method V 1.0 ALARM VERSIONAmazing Jake Bernstein Stochastic .
Buy when the price is above 55 and sell when the price is below 45.
Have MTF option.
For more information please visit stockcharts.com
PpSignal Stochastic Jake Bernstein Method V 1.0Amazing Jake Bernstein Stochastic.
Buy when the price is above 55 and sell when the price is below 45.
Have MTF option.
For more information please visit stockcharts.com