Quadratic RegressionA quadratic regression is the process of finding the equation that best fits a set of data.This form of regression is mainly used for smoothing data shaped like a parabola.
Because we can use short/midterm/longterm periods we can say that we use a Quadratic Least Squares Moving Average or a Moving Quadratic Regression.
Like the Linear Regression (LSMA) a Quadratic regression attempt to minimize the sum of squares (sum of the squared difference between a set of data and an estimator), this is why
those kinds of filters have low lag .
Here the difference between a Least Squared Moving Average ( green ) and a Quadratic Regression ( red ) of both period 500
Here it look like the Quadratic Regression have a best fit than the LSMA
Smooth

Hamming Windowed Volume Weighted Moving AverageApplying a window to the filter weights provides sometimes extra control over the characteristics of the filter.In this script an hamming window is applied to the volume before being used as a weight.In general this process smooth the frequency response of a filter.
Lets compare the classic vwma with hamming windowed vwma
Something i noticed is that windowed filters depending on their period ( high ones in general ) tend to make less bad crosses with the price ( at least with the hamming window )
Here are some data regarding number of crosses with period 50 with the hamming vwma in orange and the classic vwma in purple
Feel free to use the hamming window when using weighted filter.

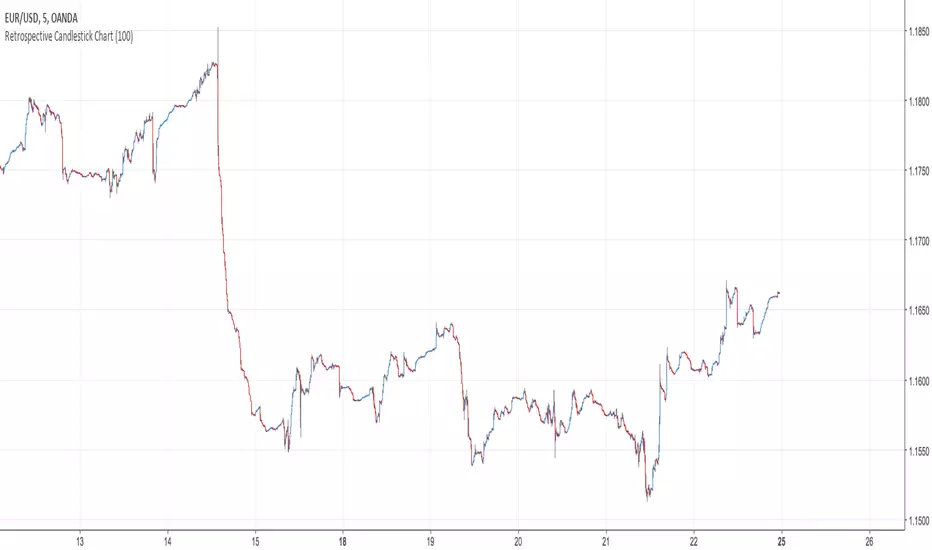
Retrospective Candlestick ChartWhen i was in Japan with some traders colleagues we talked about traditional charting tools from this country and how they changed the way we look at our charts today. Then suddenly one of the japanese traders i have met earlier said "Why not making another charting tool ? Smoother than Heikin-Ashi and including all the information a trader may need but easier to interpret".
So i had the idea of averaging the input and the output of the respective close / open / high and low price using a recursive exponential window functions, each values will be closer to their true value if they are volatile, if they are not then those values will look smoother, the length input represents the reactivity of the candles, high values represents smoother results but less reactive.The goal of those candles is to make all the information easier to interpret by a trader.
500 input length , the price look smoother, supports and resistances are easier to make.
The interpretation of highs and lows are important, the Retrospective Candlestick Chart save you time by showing only huge movements.
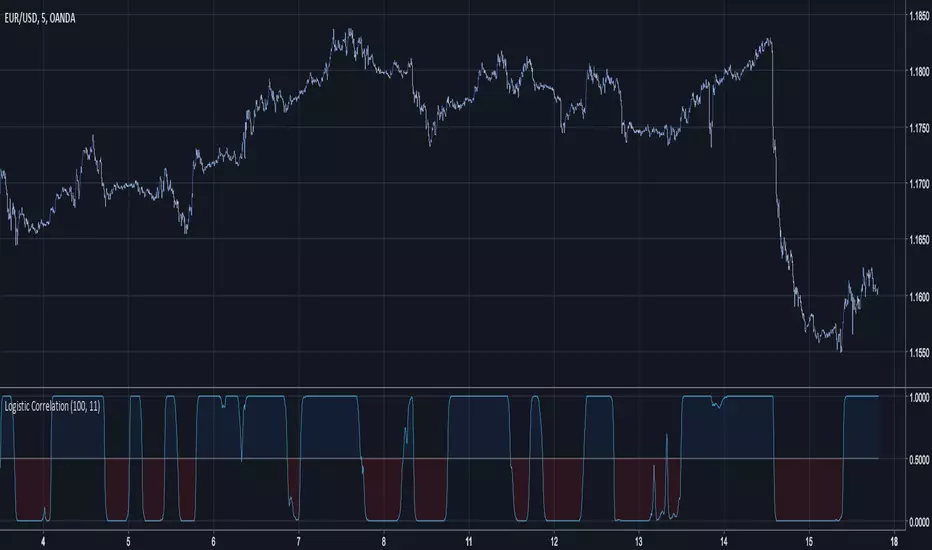
Logistic CorrelationLogistic Correlation is a correlation oscillator using a logistic function.
A Logistic Function is a Sigmoid Function who stabilize the variance of data.The logistic function have the same function as the inverse fisher transform but with an advantage over it, the k constant can control the steepness of the curve, lowers k's will preserve the original form of the data while highers one will transform it into a more square shaped form.
10 k
20 k
Double Exponential SmoothingSingle Exponential Smoothing ( ema ) does not excel in following the data when there is a trend. This situation can be improved by the introduction of a second equation with a second constant gamma .
The gamma constant cant be lower than 0 and cant be greater than 1, higher values of gamma create less lag while preserving smoothness.Higher values of length must be followed by higher values of gamma in order to keep the lag low.
The first smoothing part consist of a classic ema but we add s-s1 to the previous smoothed value, this will help decrease lag.The second smoothing part then updates the trend, which is expressed as the difference between the last two values.

Sawada Masu Moving AverageThe Sawada Masu Moving Average is a filtering technique invented by the japan engineer Sawada Masu with the help of the french trader Alex pierrefeu. This filter have 2 input, a lenght input, who modify the sensibility of the filter to market movement, and a alpha input who just smooth the filter.
The recommended inputs are : a length of 90 and a alpha of 50 for short period, a length of 140 or 200 and a alpha of 90 or 140 for medium period, and a length of 300 and a alpha of 90 for long terms.But feel free to experiment others configurations.
This moving average can be really interesting using it in collaboration with others indicators such another moving average
Hope you enjoy and have a good trades !
I apologize for orthographics or grammar error,i'm from japan and my english is really limited

Revistochmanic Wave İndicator Revistochmanic Wave is a stock tracking trends indicator & strategy for medium & long term investing.
Stochastic 34 period
smoothK 5 period (ema/red line)
smoothD 13 period (stochastic/black line)

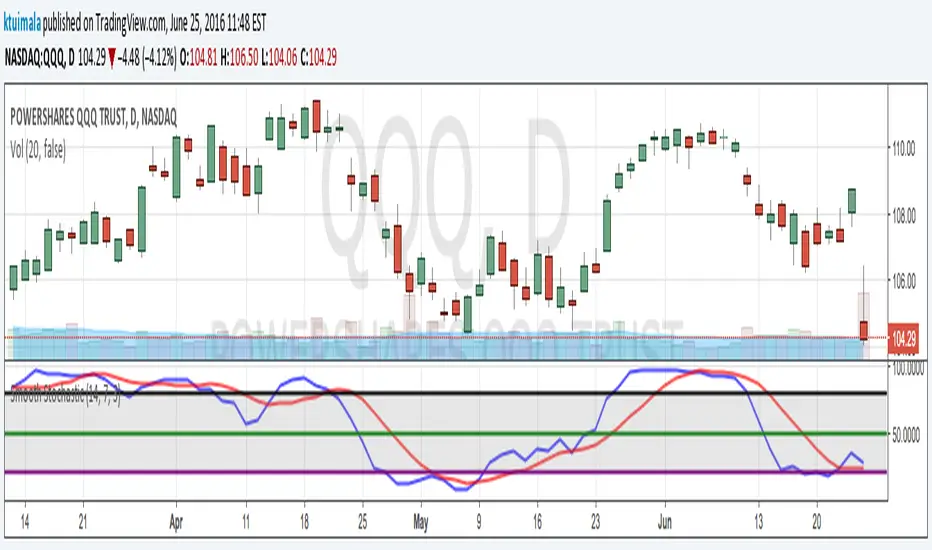
KT_Smooth_StochasticI normally don't publish my indicators. However, I couldn't find a smoothed stochastic on TradingView officially or unofficially. This is a standard implementation of a smoothed Fast Stochastic where %K and %D are calculated and then smoothed by n periods. This helps to reduce chop and gives better extreme signals.
I have defaulted the indicator to use commonly used settings where %K is over 14 periods, %D is over 7 period, and the smoothing factor is 3 periods. I have also defaulted the extreme lines to an upper band of 80, mid band of 50, and lower band of 20. However, my favorite settings are %K = 10, %D = 10, Smooth = 3, upper band = 75, mid band = 50, and lower band = 25.