LSMA - A Fast And Simple Alternative CalculationIntroduction
At the start of 2019 i published my first post "Approximating A Least Square Moving Average In Pine", who aimed to provide alternatives calculation of the least squares moving average (LSMA), a moving average who aim to estimate the underlying trend in the price without excessive lag.
The LSMA has the form of a linear regression ax + b where x is a linear sequence 1.2.3..N and with time varying a and b , the exact formula of the LSMA is as follows :
a = stdev(close,length)/stdev(bar_index,length) * correlation(close,bar_index,length)
b = sma(close,length) - a*sma(bar_index,length)
lsma = a*bar_index + b
Such calculation allow to forecast future values however such forecast is rarely accurate and the LSMA is mostly used as a smoother. In this post an alternative calculation is proposed, such calculation is incredibly simple and allow for an extremely efficient computation of the LSMA.
Rationale
The LSMA is a FIR low-pass filter with the following impulse response :
The impulse response of a FIR filter gives us the weight of the filter, as we can see the weights of the LSMA are a linearly decreasing sequence of values, however unlike the linearly weighted moving average (WMA) the weights of the LSMA take on negative values, this is necessary in order to provide a better fit to the data. Based on such impulse response we know that the WMA can help calculate the LSMA, since both have weights representing a linearly decreasing sequence of values, however the WMA doesn't have negative weights, so the process here is to fit the WMA impulse response to the impulse response of the LSMA.
Based on such negative values we know that we must subtract the impulse response of the WMA by a constant value and multiply the result, such constant value can be given by the impulse response of a simple moving average, we must now make sure that the impulse response of the WMA and SMA cross at a precise point, the point where the impulse response of the LSMA is equal to 0.
We can see that 3WMA and 2SMA are equal at a certain point, and that the impulse response of the LSMA is equal to 0 at that point, if we proceed to subtraction we obtain :
Therefore :
LSMA = 3WMA - 2SMA = WMA + 2(WMA - SMA)
Comparison
On a graph the difference isn't visible, subtracting the proposed calculation with a regular LSMA of the same period gives :
the error is 0.0000000...and certainly go on even further, therefore we can assume that the error is due to rounding errors.
Conclusion
This post provided a different calculation of the LSMA, it is shown that the LSMA can be made from the linear combination of a WMA and a SMA : 3WMA + -2SMA. I encourage peoples to use impulse responses in order to estimate other moving averages, since some are extremely heavy to compute.
Thanks for reading !
Sma

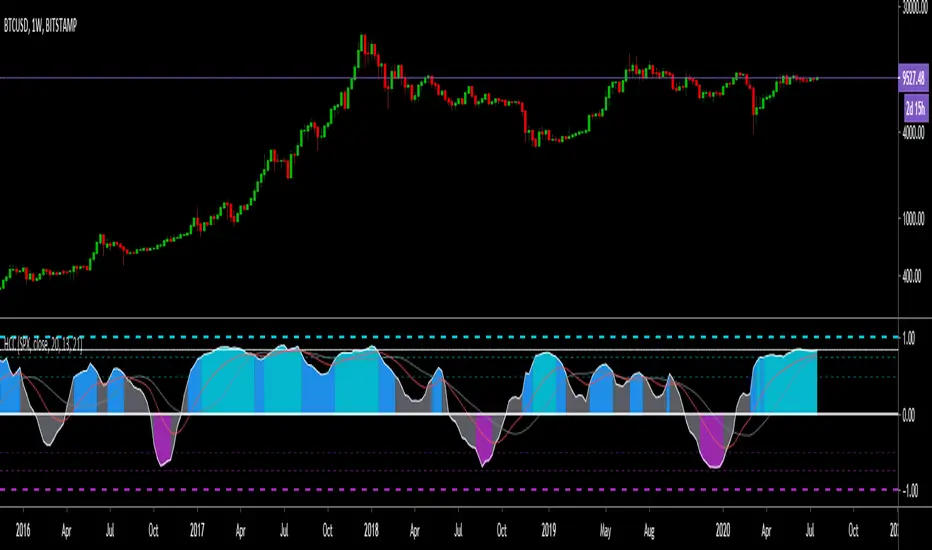
Hashem Correlation CoefficientCorrelation Coefficient
Core Code from: www.tradingview.com
This indicator Show Correlation between the Current Ticker & timeframe and a Customizable Ticker. After adding the indicator you can change the second ticker in the settings.
The Correlation Coeff is between -1 to 1 which 1 means 100% correlation and -1 means -100% correlation ( Inverse Correlation ).
The color of the area changes when:
Blue : CC > 0.5
Aqua : CC > 0.75
Purple : CC < -0.5
Red : CC < -0.75
SMA %The percentage difference from the close to the mean of SMA. Positive when above negative when below.

Fancy Moving Average [BigBitsIO]This script is for a single moving average with as many features as I can possibly fit into a single moving average. If you can think of more, or have questions regarding this script, please message me or contact me via social media.
Features:
- A single moving average (MA).
- Standard MA inputs.
- MA type.
- MA period.
- MA price.
- MA resolution (time frame).
- Visibility toggle.
- Fancy MA inputs.
- Toggle to show only candles included in the MA calculation ("Highlight inclusion") or display entire MA history.
- Toggle to show a ghost trail when Highlight inclusion is toggled on. Displays a shaded version of past MA history before the inclusion period (as seen on snapshot).
- Toggle to show forecast values for the MA.
- Other inputs related to forecasting:
- Forecast bias. (Neutral forecasts MA if the current price remains the same.)
- Forecast period.
- Forecast magnitude.
*** DISCLAIMER: For educational and entertainment purposes only. Nothing in this content should be interpreted as financial advice or a recommendation to buy or sell any sort of security or investment including all types of crypto. DYOR, TYOB. ***

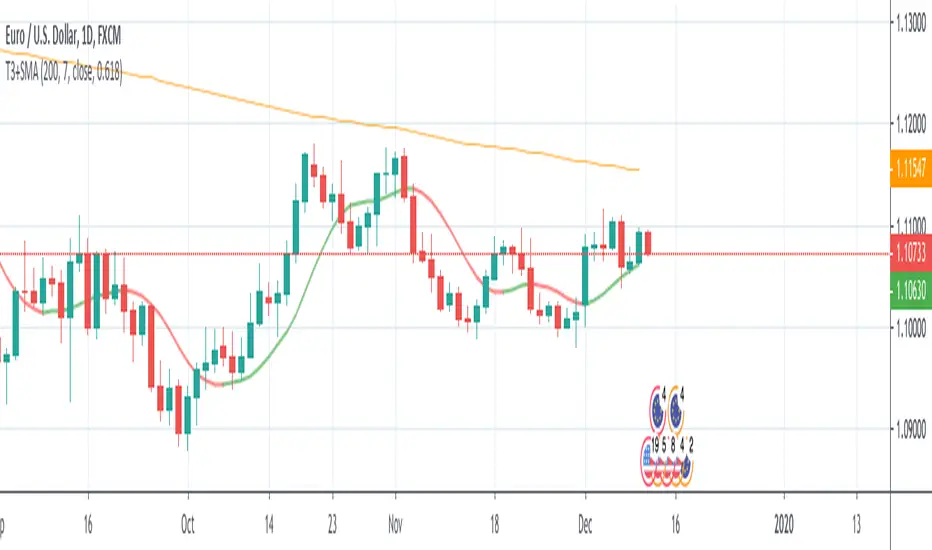
T3+SMA This source code is subject to the terms of the Mozilla Public License 2.0 at mozilla.org
© 03.freeman
This strategy is based only on T3 moving average, but uses sma 200 as filter for enter long or short.
The default settings considers a daily timeframe.
The strategy is very simple: long if T3 increase, short if T3 decrease.
Note that if you set volume factor to 0 you will have an exponential moving average, while if you set to 1 you'll get a DEMA.
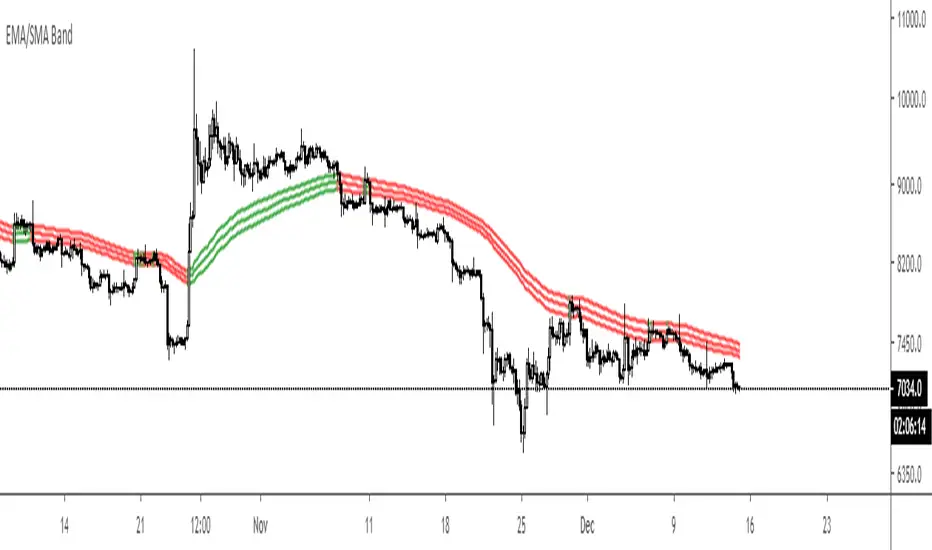
EMA/SMA BandPlot the source high, low and close of any given ema or sma. Support and resistance is defined as an area where price is likely to bounce or get rejected and since MA's are usually just one line, this band is meant to act as an area surrounding the original MA and therefore avoiding fake outs.
$0 Exponential & Simple MAs with HigherTFMultiple Moving Averages (Simple/SMA & Exponential/EMA) in one indicator
Support for a fixed time frame for the MAs
MAs default period length are key ones, provided by experienced traders in crypto, greetings to xpressive
Live update or Non-repainting modes support: with the non-repainting mode the previous candle's close is considered instead of latest/current bar's changing close
Features:
7 EMAs with editable length
4 SMAs with editable length
Choice of the price/data source from a predefined list
Activate or not the usage of an higher TF
Target Higher time frame resolution. Not using the predefined lists for more possibilities, e.g M1="M", H12="720", D3="3D", 5M="5"
Configurable lines' width in one setting. Hide or change the MAs color from the indicator's style settings

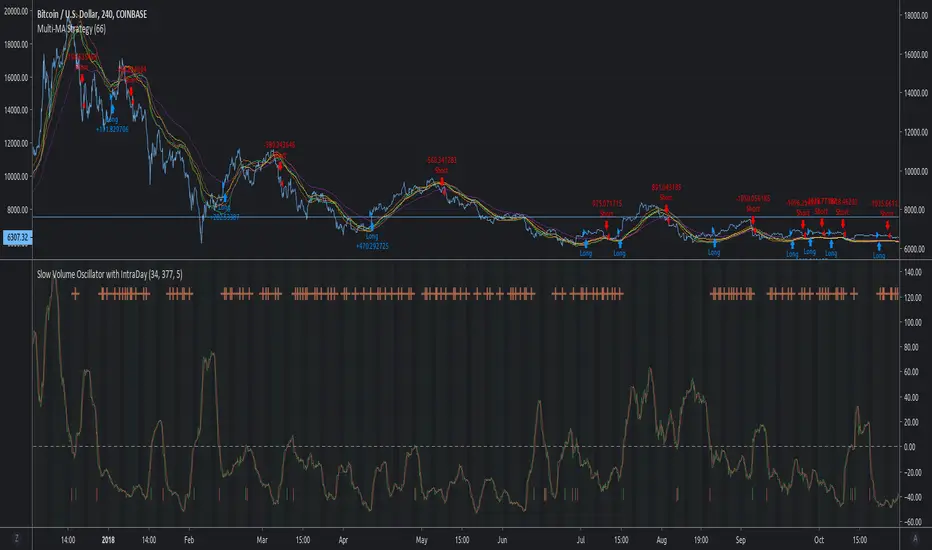
MACD Multi-MA StrategyThis script applies the average of each major MA (SMA, RMA, EMA, WVMA, WMA) to the MACD formula.
The logic is simple. When all 5 MA's are in agreement in direction, then then script will notify users of change.
I posted this as a strategy to help show how logic does in back test. If you use my simple yet effective solution to find take profit locations, you can blow this back testing out of the water!!!
To set alerts simply turn script into study
//@version=2
study(title="MACD Multi-MA Study", overlay=false)
src = close
len1 = input(8, "FAST LOOKBACK")
len2 = input(144, "SLOW LOOKBACK")
/////////////////////////////////////////////
length = len2-len1
ma = vwma(src, length)
plot(ma, title="VWMA", color=lime)
length1 = len2-len1
ma1 = rma(src, length1)
plot(ma1, title="RMA", color=purple)
length2 = len2-len1
ma2 = sma(src, length2)
plot(ma2, title="SMA", color=red)
length3 = len2-len1
ma3 = wma(src, length3)
plot(ma3, title="WMA", color=orange)
length4 = len2-len1
ma4 = ema(src, length4)
plot(ma4, title="EMA", color=yellow)
long = ma > ma and ma1 > ma1 and ma2 > ma2 and ma3 > ma3 and ma4 > ma4
short = ma < ma and ma1 < ma1 and ma2 < ma2 and ma3 < ma3 and ma4 < ma4
alertcondition(long == true, title='MACD LONG SIGNAL', message='MACD LONG!')
alertcondition(short == true, title='MACD SHORT SIGNAL', message='MACD SHORT!')
Multi Timeframe Moving AveragesThis indicator allows you to view a moving average (EMA or SMA) of your choosing on other time frames than what you are currently on.
The reason I wanted to develop this was for use as a filter. Let's say you wanted to make sure the daily time frame was trading above a certain moving average so you could be sure you were playing with the trend. But you wanted to make your entries and exits on a smaller time frame. This Multi-Timeframe Moving Average indicator can then be used to keep an eye on that daily moving average while looking at the shorter term time frames on the same chart.

Hashem OBV+EMA/MAThe On Balance Volume indicator (OBV) is used to measure buying and selling pressure.
It is a cumulative indicator meaning that on days where price went up, that day's volume is added to the cumulative OBV total. If price went down, then that day's volume is subtracted from the OBV total.
The OBV value is then plotted as a line for easy interpretation. OBV is primarily used to confirm or identify overall price Trends or to anticipate price movements after Divergences .
In addition to OBV, EMA and SMA are included. the EMA is used for Support and Resistances for the OBV. and the SMA is used by its Slope (can be S/R as well).

Rhaps SMAEMA Combo v1.1There's many versions of this sort of thing around the Tradingview library, but i guess we all like things to our own specifications.
So this is my take on the SMA and EMA version combined.
Bunch of SMA's & EMA's, with labels, and G&D Cross Labels and Alerts.
These values can of course be changed to any you may prefer.
Rhapsodyy's Combo SMAEMA's v1.1
SMA's with Painted Labels : 10/30/50/80/200
EMA's with Painted Labels : 21/50/89/200/377
50SMA / 200SMA Golden & Death Crosses on Current Timeframe & Alerts
Daily 50SMA / 200SMA Golden & Death Crosses overlayed onto Current Timeframe & Alerts
50EMA / 200EMA Golden & Death Crosses on Current Timeframe & Alerts
Daily 50EMA / 200EMA Golden & Death Crosses overlayed onto Current Timeframe & Alerts

FibMAThis study visually demonstrates Fibonacci moving averages.
The darker the color, the stronger the signal is for either buying or selling.
Buys/Sells only take place when each moving average is above/below the its adjactent fibonacci sequence, i.e 5<8<13<21<34<55<89<144 for buying..
Alerts are provided as BUY ASSET and SELL ASSET.
Multiple moving averages are also provided.

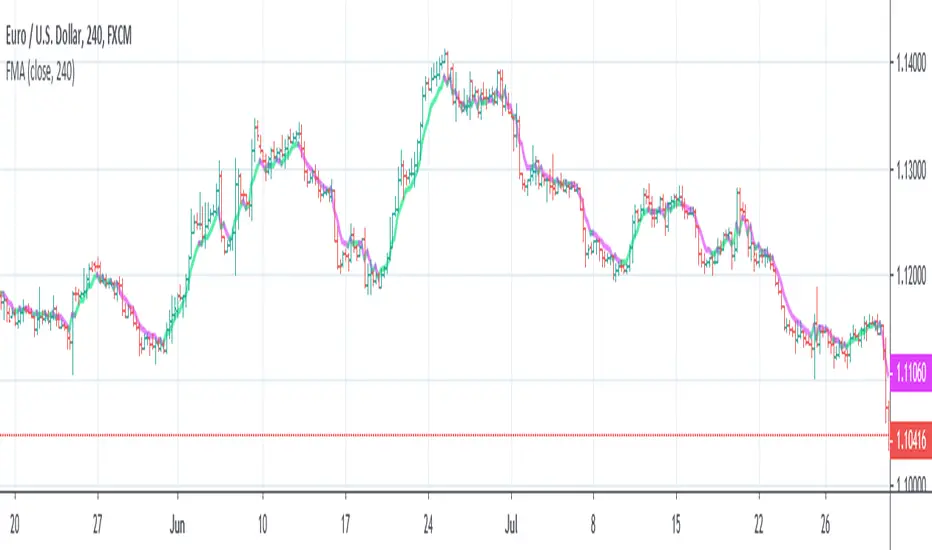
FMA - Fibonacci Moving Average [NXT2017]HI BIG PLAYERS,
I present you a new moving average indicator that relates the values to the lenght of Fibonacci sequence.
Kind regards
NXT2017
MasterMAThis study demonstrates 15 different common moving averages.
SMA, Double SMA, Triple SMA
EMA, Double EMA, Triple EMA
WMA, Double WMA, Triple WMA
VWMA, Double VWMA, Triple VWMA
Hull, Double Hull, Triple Hull
Buy/Sell alerts are given for crossover/under conditions.
Triangles at the bottom, pointing up are buy signals. Triangles at the top, pointing down, are sell signals

Reliability[UO]This is an SMA based indicator. It gives a sense of long term behavior of the asset to make a reliable trade setup
How reliable is your asset to trade without gambling? Is there a reliable trend?
Is this price dip an opportunity to buy?
Is this price spike an opportunity to sell? Or would you avoid buying now and rather wait a bit for prices to fall down to a more reasonable level?
You can recognize all of those points on this indicator. The best to do is to look at the prices and patterns on the indicator to learn about those points.

RSI with Moving Averages[UO]This RSI indicator is one of my favorite indicators. This powerful indicator is implemented by Phi-Deltalytics. I modified the drawing so that it is easier (at least for me) to see the signals and trends (it would not matter if you're doing algorithmic trading).
Trends and signals. For detailed instructions and tutorial see Phi-Deltalytics page

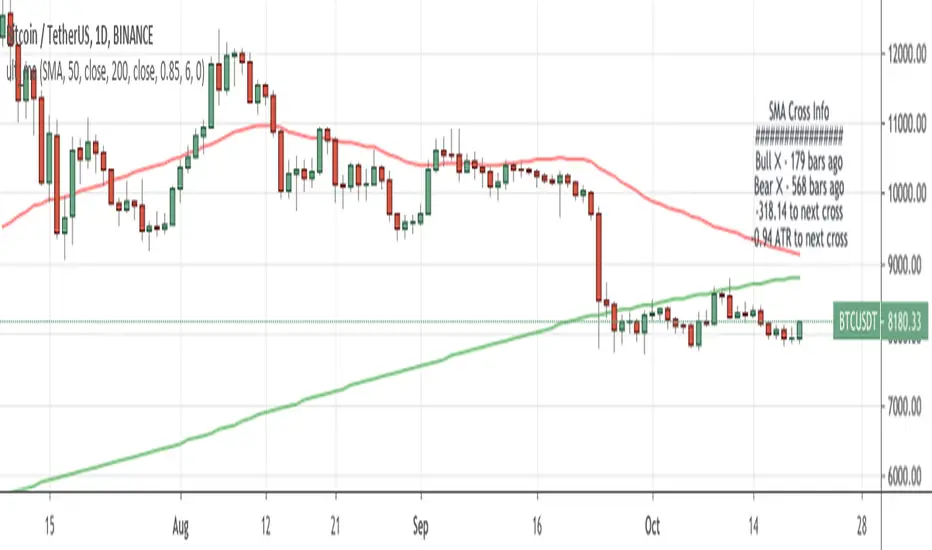
Scripting Tutorial A - TManyMA - StopsThis script is for a triple moving average strategy where the user can select from different types of moving averages, price sources, lookback periods and resolutions.
Features:
- 3 Moving Averages with variable MA types, periods, price sources, resolutions and the ability to disable each individually.
- Crossovers are plotted on the chart with detailed information regarding the crossover (Ex: 50 SMA crossed over 200 SMA )
- Forecasting available for all three MAs. MA values are forecasted 5 values out and plotted as if a continuation to the MA.
- Forecast bias also applies to all forecasting. Bias means we can forecast based on an anticipated bullish, bearish or neutral direction in the market.
- To understand bias, please read the source code, or if you can't read the code just send me a message on here or Twitter. Twitter should be linked to my profile.
- Ribbons added and on by default. Optional setting to disable the ribbons. 5 ribbons between MA1 and MA2 and another 5 between MA2 and MA3.
- Ribbons are alpha-color coded based on their relation to their default MAs.
- Ribbons are only visible between MAs if the MAs being compared share the same Type, Resolution, and Source because there is no way to consolidate those three in a simple manner.
- Ribbon values are calculated based on calculated MA Periods between the MAs.
- Converted the existing study into a strategy.
- Strategy only enters long positions with a market order when MA crossovers occur.
- Strategy exits positions when crossunders occur.
- Trades 100% of the equity with one order/position by default.
- Ability to disable trading certain crosses with input checks.
- Ability to exit trades with a take profit or stop loss.
- User input to allow quick changes to the take profit or stop loss percentages.
This script is meant as an educational script with well-formatted styling, and references for specific functions.
*** PLEASE NOTE - THIS STRATEGY IS MEANT FOR LEARNING PURPOSES. DEPENDING ON IT'S CONFIGURATION IT MAY OR MAY NOT BE USEFUL FOR ACTUAL TRADING. THE STRATEGY IS NOT FINANCIAL ADVICE ***

Golden Ratio Fibonacci Multipliers Top Detector [UO]Fibonacci levels that show the critical top and bottom levels. There is no way to miss the top and bottom. And a top detector.
Also the most important SMA lines (SMA 50, 200), EMA21. Those are the most frequently used lines by traders.
This indicator is based on the work of www.tradingview.com
His work set me thinking. Could I also see the bottom using Fibonacci numbers? Yes, of course.
My favorite timeframes with this indicator are 6H, 1D, 3D.
Intensively used for BTC and BNB. And useful for any other coin.

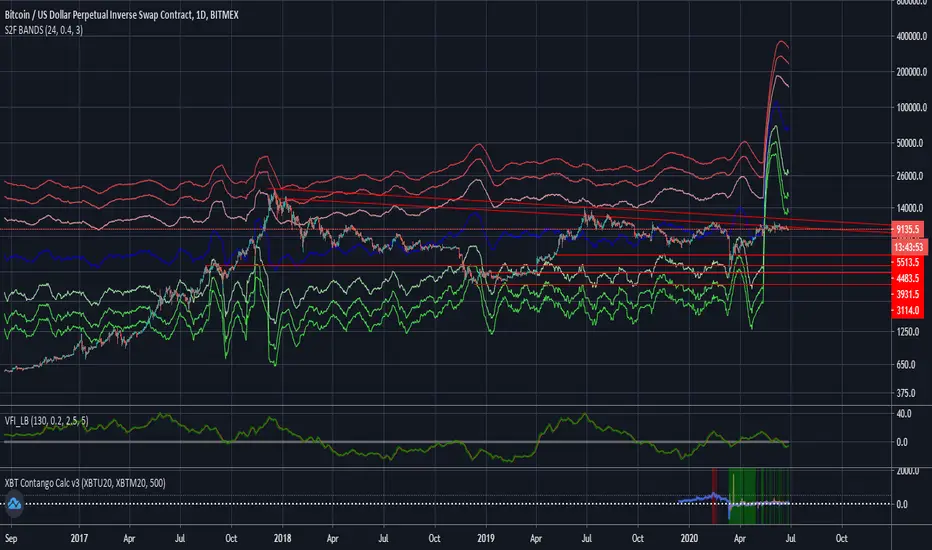
Stock to Flow Model with Standard Deviation BandsThis Study takes the Stock to Flow Model for Bitcoin as presented by 100trillionUSD and smoothes it using an SMA. Then it calculates the close's standard deviation from it and displays the 2-Sigma Bands.
The stock to flow model seems to be one of the best predictions of Bitcoins price.
The standard deviation bands are supposed to show situations in which Bitcoin is significantly over- or under-bought.
Rolling Moving Average, SMA/EMA, for IPO stocksThe script replicates the standard EMA/SMA used by tradingview, but also adds an estimate for the first X periods, where X is the length of the moving average. This allows for an estimate of support resistance in IPO stocks, when fewer date is available

Scripting Tutorial 9 - TManyMA Strategy - Long Market Order OnlyThis script is for a triple moving average strategy where the user can select from different types of moving averages, price sources, lookback periods and resolutions.
Features:
- 3 Moving Averages with variable MA types, periods, price sources, resolutions and the ability to disable each individually
- Crossovers are plotted on the chart with detailed information regarding the crossover (Ex: 50 SMA crossed over 200 SMA )
- Forecasting available for all three MAs. MA values are forecasted 5 values out and plotted as if a continuation to the MA.
- Forecast bias also applies to all forecasting. Bias means we can forecast based on an anticipated bullish, bearish or neutral direction in the market.
- To understand bias, please read the source code, or if you can't read the code just send me a message on here or Twitter. Twitter should be linked to my profile.
- Ribbons added and on by default. Optional setting to disable the ribbons. 5 ribbons between MA1 and MA2 and another 5 between MA2 and MA3.
- Ribbons are alpha-color coded based on their relation to their default MAs.
- Ribbons are only visible between MAs if the MAs being compared share the same Type, Resolution, and Source because there is no way to consolidate those three in a simple manner.
- Ribbon values are calculated based on calculated MA Periods between the MAs.
- Converted the existing study into a strategy
- Strategy only enters long positions with a market order when MA crossovers occur
- Strategy exits positions when crossunders occur
- Trades 100% of the equity with one order/position by default
- Ability to disable trading certain crosses with input checks
This script is meant as an educational script with well-formatted styling, and references for specific functions.
*** PLEASE NOTE - THIS STRATEGY IS MEANT FOR LEARNING PURPOSES. DEPENDING ON IT'S CONFIGURATION IT MAY OR MAY NOT BE USEFUL FOR ACTUAL TRADING. THE STRATEGY IS NOT FINANCIAL ADVICE ***

Ultimate MA Cross IndicatorContinue to experiment with new labels functionality in TradingView. Created ma cross script with 9 different types of MA wit additional information box. In that box, I included the bars passed from the previous bull/bear cross.
Also you cand find there live distance between moving averages in price and ATRs , so you track how close are you from the next close.
Do you think this concept is useful? What information do you want to see in this kind of boxes?
These ma types are included in this indicator:
Simple Moving Average ( SMA )
Exponential Moving Average ( EMA )
Weighted Moving Average ( WMA )
Arnaud Legoux Moving Average ( ALMA )
Hull Moving Average ( HMA )
Volume-weighted Moving Average ( VWMA )
Least Square Moving Average ( LSMA )
Smoothed Moving Average ( SMMA )
Double Exponential Moving Average ( DEMA )
Simple 17 BF 🚀A Simple Moving Average of period 17 based on ohlc4 values. We go long when price closes above it. We go short when price closes below it. No stop loss. No take profit.
This strategy is really to showcase how effective a basic system can be, and that with discipline and patience, trading does not need to be complex to yield good results over time.
You can change the Moving Average type, source and period in the settings as well as the backtesting range. I found 17 period SMA with ohlc4 to be a good fit for XBT/USD on Daily timeframe but for other pairs, the type, source and period will likely differ.
INSTRUCTIONS
Red turns to Green = Long Entry/Short Exit
Green turns to Red = Short Entry/Long Exit
The entries are based on when price crosses the MA and this is what the backtest is based on. We exit the current trade when we get an opposing signal and enter the new trade.
