Multi Type RSI [Misu]█ This Indicator is based on RSI ( Relative Strength Index ) & multiple type of MA (Moving Average) to show different variations of RSI.
The relative strength index (RSI) is a momentum indicator used in technical analysis to evaluate overvalued or undervalued conditions in the price of that security.
█ Usages:
The purpose of this indicator is to obtain the RSI calculated with different MAs modes instead of the classic RMA.
The red and green zones indicate the oversold and overbought zones.
Buy or sell signals are marked by the green and red circles
We have 2 different signal modes : when the different size RSIs cross and when the fast RSI crosses the extreme bands.
Alerts are setup.
█ Parameters:
Lenght RSI: The lenght of the RSI. (14 by default)
RSI MA Type: The type of MA with which the rsi will be calculated. ("SMA", "EMA", "SMMA (RMA)", "WMA", "VWMA")
Fast Lenght MA: The fast lenght smoothing MA.
Slow Lenght MA: The Slow lenght smoothing MA.
Lower Band: The lenght of the lower band. (25 by default)
Upper Band: The lenght of the upper band. (75 by default)
Signal Type: The mode with which buy and sell signals are triggered. ("Cross 2 Mas", "Cross Ma/Bands")
Signal

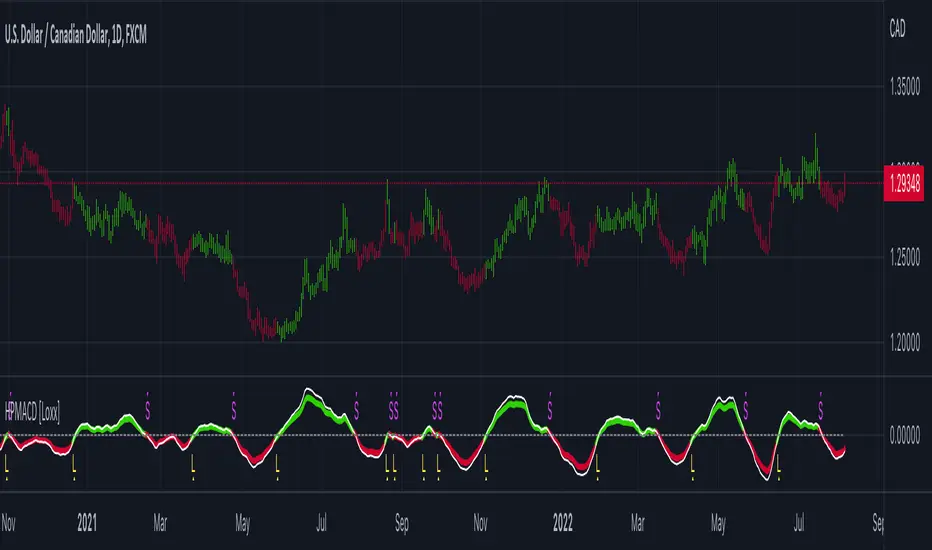
Hodrick-Prescott MACD [Loxx]Hodrick-Prescott MACD is a MACD indicator using a Hodrick-Prescott Filter.
What is Hodrick–Prescott filter?
The Hodrick–Prescott filter (also known as Hodrick–Prescott decomposition) is a mathematical tool used in macroeconomics, especially in real business cycle theory, to remove the cyclical component of a time series from raw data. It is used to obtain a smoothed-curve representation of a time series, one that is more sensitive to long-term than to short-term fluctuations. The adjustment of the sensitivity of the trend to short-term fluctuations is achieved by modifying a multiplier Lambda.
The filter was popularized in the field of economics in the 1990s by economists Robert J. Hodrick and Nobel Memorial Prize winner Edward C. Prescott, though it was first proposed much earlier by E. T. Whittaker in 1923.
There are some drawbacks to use the HP filter than you can read here: en.wikipedia.org
Included
Bar coloring
3 types of signals
Alerts
Loxx's Expanded Source Types
MACD + RSI with Trade SignalsThis indicator by default comes with the MACD shown but can be switched to show the RSI instead. Settings for each indicator can also be customized as well as Buy/Sell signals given based on pull back crossovers that follow the 200 EMA of the price Chart. There's an above/below middle fill option you can use but I tend not to but I know some traders like to see when an oscillator is above/below the middle and use it as a trend diretion. By the way, the fourth setting for the MACD (which is 2 by default) is the size of the histogram.
Buy Signal = Price is above the 200 EMA. Current or previous MACD or RSI line is/was below middle line and now crossed above the signal line.
Sell Signal = Price is below the 200 EMA. Current or previous MACD or RSI line is/was above middle line and now crossed below the signal line.
There are alerts for each signal as well (MACD and RSI, both buy and sell).
Feel free to leave a comment regarding issues or suggestions for this indicator or ideas for the next one I should do :)

Adaptive ATR Keltner Channels [Loxx]Adaptive ATR Channels are adaptive Keltner channels. ATR is calculated using a rolling signal-to-noise ratio making this indicator flex more to changes in price volatility than the fixed Keltner Channels.
What is Average True Range (ATR)?
The average true range (ATR) is a technical analysis indicator, introduced by market technician J. Welles Wilder Jr. in his book New Concepts in Technical Trading Systems, that measures market volatility by decomposing the entire range of an asset price for that period.1
The true range is taken as the greatest of the following: current high less the current low; the absolute value of the current high less the previous close; and the absolute value of the current low less the previous close. The ATR is then a moving average, generally using 14 days, of the true ranges.
What are Keltner Channel (ATR)?
Keltner Channels are volatility-based bands that are placed on either side of an asset's price and can aid in determining the direction of a trend.
The Keltner channel uses the average-true range (ATR) or volatility, with breaks above or below the top and bottom barriers signaling a continuation.

No-lose trading targets (Based on MFI) By Mustafa ÖZVERThis code shows expected reaction target prices after sudden moving based on MFI . Red area means the price is on overbought area, green area means the price is on oversold area. If you see red area under price, you can make short option to next to the horizontal beginning price of red area. If you see green area over price, you can make long option to next to the horizontal beginning price of green area.
When this code works
- The green area starts where mfi value is on oversold
- The red area starts where mfi value is on overbought
Of course, this code may be failed, do not forget the target may never come. But hopefully price will cross over the target.
And you (as developers) can develop this code by using anything instead of mfi to get up-down target prices.
But only this values can not guarantee good results for trading. BE CAREFUL

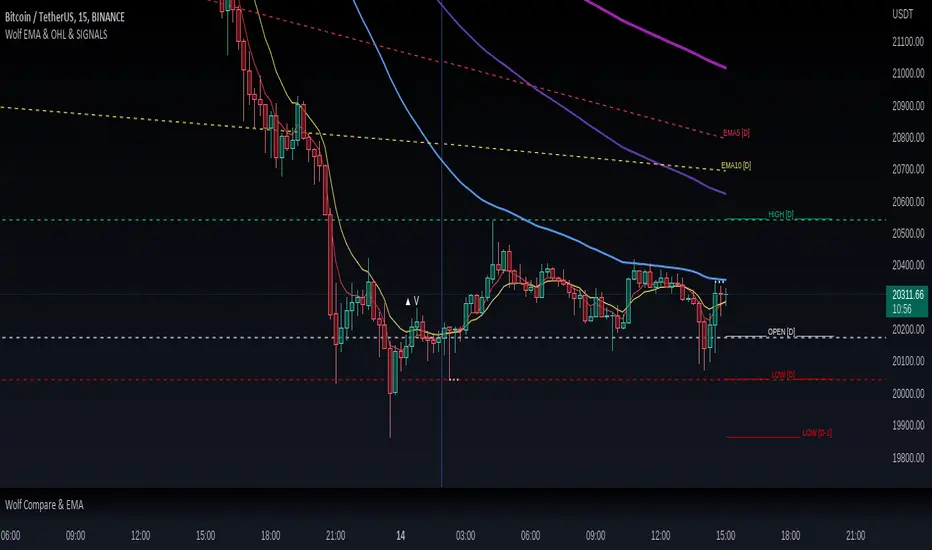
Wolf EMA & OHL & SIGNALSWolf EMA & OHL & SIGNALS
this indicator is mainly used for fast trading techniques (scalping). provides various tools for comprehensive trend analysis.
5 EMAs are used to have possible market entry or exit signals.
EMA
Thanks to the combination of the EMAs of different timeframes,
you can immediately get an idea of the resistances or supports
of the higher timeframes.
HOL
Lines are drawn on the right side indicating the maximum, minimum and opening
of the day, past day, week and past week respectively.
These levels are excellent as price acceleration points.
SIGNALS
There are three types of signals that are monitored by this indicator:
- Shimano
This signal is generated if the price remains compressed between two EMAs, more precisely between the third and the fifth, at the point where the price breaks one of these EMAs there can be a strong price movement.
- Viagra
This signal is generated if the price remains below the second EMA for a long time without ever closing above / below, at the point where it closes by climbing over the EMA there may be a change in trend.
-Bud
This signal is generated if a positive candle is formed and subsequently at least two that close within the high and low of the positive candle. Where the price breaks through the high of the positive candle is a great entry point.
Trend IdentifierTrend Identifier for 1D BTC.USD
It smoothens a closely following moving average into a polynomial like plot.
And assumes 4 stage cycles based on the first and second derivatives.
Green: Bull / Exponential Rise
Yellow: Distribution
Red: Bear / Exponential Drop
Blue: Accumulation
Red --> Blue --> Green: indicates the start of a bull market
Green --> Yellow --> Red: indicates the start of a bear market
Green --> Yellow: Start of a distribution phase, take profits
Red --> Blue: Start of a accumulation phase, DCA

TUE ADX/MACD Confluence V1.0The ADX and MACD confluence can be a powerful predictor in stock movements. This script will help you find those confluences in an easy to understand visual manner.
It includes Buy and Sell signals for detected confluences, and will show colored candles to help you determine when to exit a trade. When the candles turn to white that means the detected confluence is no longer in play and you may want to consider a trailing stop loss.
The Buy and Sell signals will display on the first occurrence of each confluence.
It's important to understand that both of these are lagging indicators, but with a careful attention to your stoploss you can easily generate a positive profit factor.
This code is provided open source and you're free to use it for any purpose other than resale.

ENVELOPE RSI - Buy Sell SignalsThis indicator is mainly based on Overbought and Oversold . Indicator for short-term trading. This way you can get small but acceptable signals.
The main basis of the indicator is as follows:
To buy, the indicator is waiting for the instrument to be oversold from the RSI point of view. Then, if the chart crosses the bottom line of the Envelope indicator from the bottom to the top, a buy signal is issued.
For sell, the indicator waits for the instrument to be overbought from the RSI perspective. Then, if the chart crosses the top line of the Envelope indicator from top to bottom, a sell signal is issued.
The general basis is the consonance of the price and the RSI indicator .
The best settings I came up with myself:
Time frame: 15 minutes
Overbought: 80
Oversell: 25
RSI Length: 8
It can be done on different instruments. But always set your profit and loss limits.
(Profit to loss ratio in this indicator can be 1: 1.)
Disclaimer : This information and trading indicators and tools provided neither is, nor should be construed, as an offer, or a solicitation of an offer, to buy or sell securities. You shall be fully responsible for any investment decision you make, and such decisions will be based solely on your evaluation of your financial circumstances, investment objectives, risk tolerance, and liquidity needs.
I am not liable for any profit, financial improvement, losses or damages, monetary or other that may result from the application of information contained within this indicator. Individual traders must use their own due diligence in analyzing featured trading indicators, other trading tools, webinars and other educational materials to determine if they represent suitable and useable features and capabilities for the individual trader.

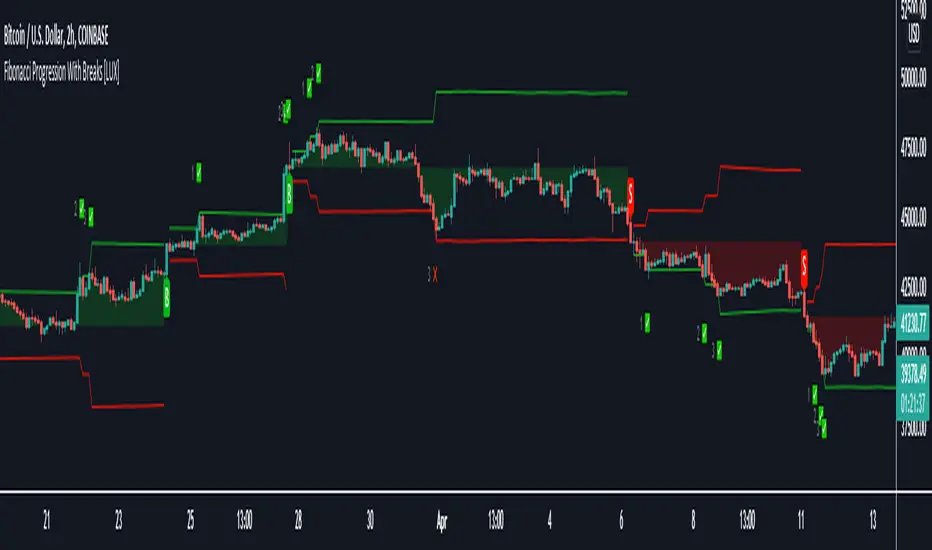
Fibonacci Progression with Breaks [LuxAlgo]This indicator highlights points where price significantly deviates from a central level. This deviation distance is determined by a user-set value or using a multiple of a period 200 Atr and is multiplied by successive values of the Fibonacci sequence.
Settings
Method: Distance method, options include "Manual" or "Atr"
Size: Distance in points if the selected method is "Manual" or Atr multiplier if the selected method is "Atr"
Sequence Length: Determines the maximum number of significant deviations allowed.
Usage
The indicator allows highlighting potential reversal points, but it can also determine trends using the central level, with an uptrend detected if the central level is higher than its previous value and vice versa for a downtrend.
When an uptrend is detected, and the price deviates significantly upward from it a first checkmark will be highlighted alongside the Fibonacci sequence used as a multiplier, if the price deviates downward, a cross will be shown instead, then the distance threshold will be multiplied by the next value in the Fibonacci sequence.
If the price deviates from the central level such that the length of the sequence is greater than the user set Sequence Length , a break label will be shown alongside a new central level with a value determined by the current closing price, while the Fibonacci multiplier will be reset to 1.
Upper and lower extremities made from the central level and threshold distance are highlighted and can be used as support and resistances.
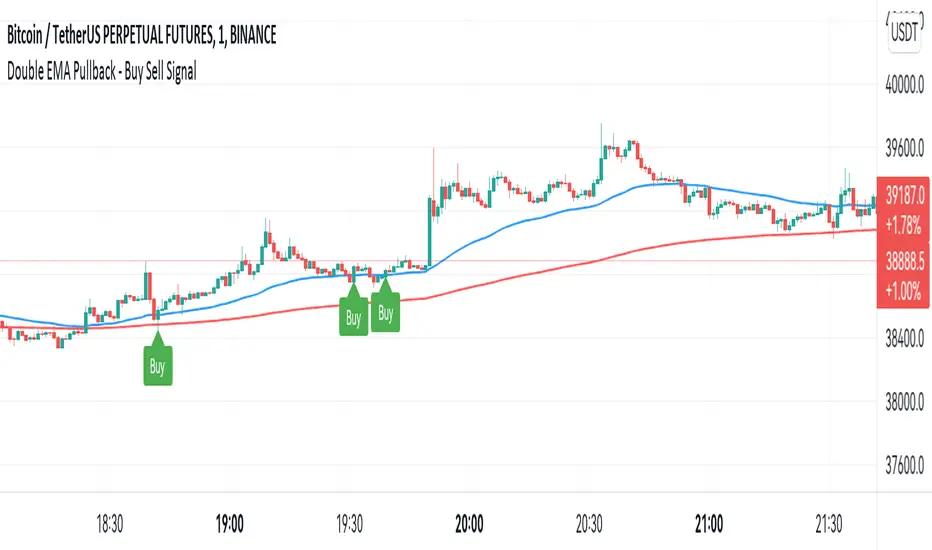
Double EMA WIth Pullback Buy Sell Signal - Smarter AlgoBuilt with love "Double EMA With Pullback Buy Sell Signal "
This indiator will help you to find a Double EMA Pullback Signal
You can combine with your own strategy, or use this purely
DISCLAIMER :
Measure the risk first before use it in real market
Backtest The Strategy was very important, so you know the probability
Fundamentally Logical :
Pullback (Some Previous candle is Red for Bull Pullback vice versa)
the Entry candle must be a Candlestick Pattern
Features :
1. Double EMA
2. Pullback Signal
How to use it :
1. Adjust the Pullback Backstep
2. Adjust the EMA Period
3. Adjust the Style to your preferences
Regards,
Hanabil
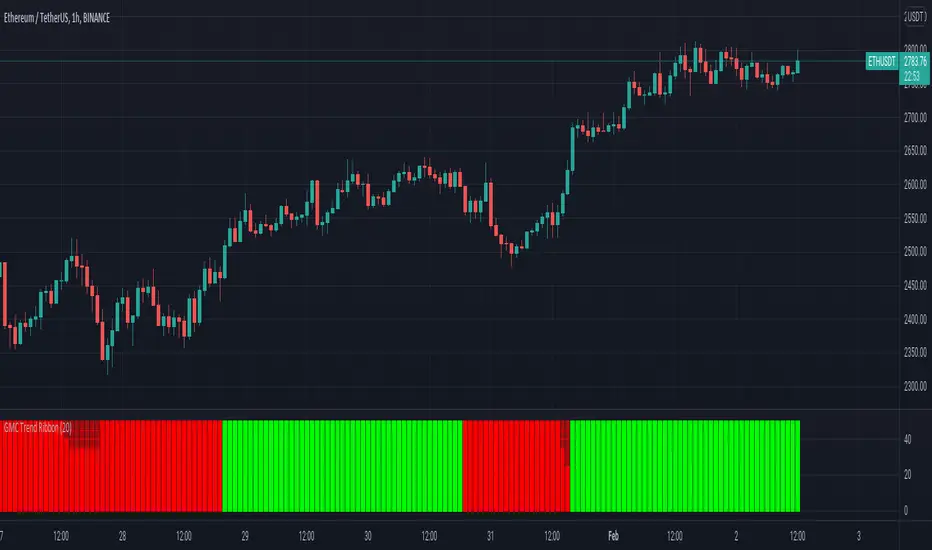
GMC Trend FilterAvoid Fake Signals, and identify the trend.
How it works ?
- it calculates main trend direction by using the length that is user-defined. so you can change it as you wish
- then it calculates trend direction for each 9 lower lengths. if you set the length = 20 then the lengths are 19, 18,...11
- and it checks if the trend directions that came from lower lengths is same or not with main trend direction.
- it changes the trend color of the ribbon.
P-Signal GravityP-Signal Gravity will help you choose a trading strategy, taking into account volatility and exchange commissions. The white circles indicate the probabilistic position of the virtual center of gravity. The reliability parameter determines the probability of finding such a center of gravity. The table shows the latest price and the expected P/L, taking into account the exchange commission, which is also a parameter. Due to the overlay type of indicator, the table also contains p-signal values and its increment.

NazhoThis is a simple scalping strategy that works for all time frames... I have only tested it on FOREX
It works by checking if the price is currently in an uptrend and if it crosses the 20 EMA .
If it crosses the 20 EMA and its in and uptrend it will post a BUY SIGNAL.
If it crosses the 20 EMA and its in and down it will post a SELL SIGNAL.
The red line is the highest close of the previous 8 bars --- This is resistance
The green line is the lowest close of the previous 8 bars -- This is support
+SuperTrend

Trendlines with Breaks [LuxAlgo]The trendlines with breaks indicator return pivot point based trendlines with highlighted breakouts. Users can control the steepness of the trendlines as well as their slope calculation method.
Trendline breakouts occur in real-time and are not subject to backpainting. Trendlines can however be subject to repainting unless turned off from the user settings.
The indicator includes integrated alerts for trendline breakouts.
🔶 USAGE
Any valid trendlines methodology can be used with the indicator, users can identify breakouts in order to infer future price movements.
The calculation method of the slope greatly affects the trendline's behaviors. By default, an average true range is used, returning a more constant slope amongst trendlines. Other methods might return trendlines with significantly different slopes.
Stdev makes use of the standard deviation for the slope calculation, while Linreg makes use of the slope of a linear regression.
The above chart shows the indicator using "Stdev" as a slope calculation method. The chart below makes use of the "Linreg" method.
By default trendlines are subject to backpainting, and as such are offset by length bars in the past. Disabling backpainting will not offset the trendlines.
🔶 SETTINGS
Length: Pivot points period
Slope: Slope steepness, values greater than 1 return a steeper slope. Using a slope of 0 would be equivalent to obtaining levels.
Slope Calculation Method: Determines how the slope is calculated.
Backpaint: Determine whether trendlines are backpainted, that is offset to past.

IDEAL BB with MA (With Alerts)It gives well combination of Moving average and Bollinger bands with signals

Roberts Pi Cycle Top and Bottom Indicator BTCIndicator Overview
The Pi Cycle Top Indicator has historically been effective in picking out the timing of market cycle highs to within 3 days.
It uses the 111 day moving average (111DMA) and a newly created multiple of the 350 day moving average, the 350DMA x 2.
This updated indicator is based on the original x2 Daily Simple Moving Average Pi Cycle Top Indicator for BTCUSD but with the addition of a 3rd 350 SMA
Standard Pi Cycle SMA = 350*2 SMA + 111 SMA
Updated Pi Cycle SMA = 350*2 SMA + 111 SMA + 350 SMA
How It Can Be Used / How to Read:
Chart should be used on BTCUSD only
Chart should be set to Daily Timeframe only
Buy signal RED SMA crosses up over WHITE SMA
Sell Signal RED SMA crosses up over GREEN SMA (a vetical yellow line will indicate the cycle top)

Multiple Stoch.+RSI+Stoch. RSI A.Multiple TA, it is a combination of RSI, Stochastic RSI and Stochastic indicators with many setting options. An additional RSI can be displayed showing the RSI values of the previous candle. This has an impact on the buy and sell signal.
It offers an alert condition for the buy signal that is available in the Create Alert dialog box. Please note that the indicator does NOT create an alarm, it only offers additional options in the "Create alarm" dialog box.
This is not a purchase advice tool or does not ask for any other guarantee, so use this indicator only at your own risk.
German:
Multiple TA, es handelt sich um eine Kombination der RSI, Stochastik RSI und Stochastik Indikatoren mit viele Einstellungsmöglichkeiten. Es kann eine zusätzliche RSI angezeigt werden, der die RSI Werte von vorherige Candle anzeigt. Diese hat ein Einfluss auf den Kauf und Verkauf Signal.
Es bietet eine Alarmbedingung für die Kaufsignal an, die im Dialogfeld "Alarm erstellen" verfügbar ist. Bitte beachten Sie, dass der Indikator KEINEN Alarm erstellt, sondern nur weitere Optionen im Dialogfeld "Alarm erstellen" bietet.
Das ist keine Kaufberatungstools oder bittet keine sonstige Garantie, daher nutzen Sie diesen Indikator nur auf eigene Gefahr.

[pp] Signal GeneratorResearch and Development Tool.
For anyone who is familiar with working with digital signals (audio/electrical engineers) you might appreciate this Signal Generator.
You can select and vary 4 different types of signals.
Logistic Map
If you're not familiar with the logistic map, then go watch a youtube video. By default the equation is meant to represent chaos and is a good alternative for random number generation.
Random
This uses the built-in random number generator. I'm not sure if it's better to use this or the logmap default settings. Either way, you have a choice.
Unit Impulse
Good for creating a transient impulse.
Step Impulse
Similar to the unit impulse. Except constant and not a transient.
Synthesizer
It comes with 4 wave functions (Sine, Triangle, Square, Saw) that can be combined for additive synthesis. Each wave function contains its own respective phase and amplitude control.
Credits
Many of these functions were taken from www.pinecoders.com with the exception of the logistic map. I simply aggregated them all into this toolkit for ease of use.
How to use
This is not a trading indicator. This is meant to be used for research and development. You could use it to test strategies, by generating white noise with the logmap and creating trading signals. Or you could use it for teaching and learning. Using the constant data as a dependable, repeatable resource.

ATR Start & Stop BotThis script is using Average True Range (ATR) and works very well on the Bitcoin 4 hour timeframe to determine when to stop and start your bots.
It has a very similar visual to the EMA RSI Indicator found here:
This 'ATR Start & Stop Bot' is better because it has less confusion during sideways market movement.
As an example - You are using 3commas and have a Composite bot setup with several alt coins, you can use this indicator with the ' Stop bot ' alert to disable your composite bot from taking trades at times when the market is on a trend that looks in the red.
Alternatively you can use the ' Start bot ' alert to turn your bot back on during the green uptrends.
Using this indicator with these alerts on the Bitcoin 4-Hour chart add a great layer of automation to your already existing bots.
Credits:
Original 'ATR Stops' indicator belong to the user failathon and that script is found here:
Also credits to Dradian for the alert additions.

vol_signalNote: This description is copied from the script comments. Please refer to the comments and release notes for updated information, as I am unable to edit and update this description.
----------
USAGE
This script gives signals based on a volatility forecast, e.g. for a stop
loss. It is a simplified version of my other script "trend_vol_forecast", which incorporates a trend following system and measures performance. The "X" labels indicate when the price touches (exceeds) a forecast. The signal occurs when price crosses "fcst_up" or "fcst_down".
There are only three parameters:
- volatility window: this is the number of periods (bars) used in the
historical volatility calculation. smaller number = reacts more
quickly to changes, but is a "noisier" signal.
- forecast periods: the number of periods for projecting a volatility
forecast. for example, "21" on a daily chart means the plots will
show the forecast from 21 days ago.
- forecast stdev: the number of standard deviations in the forecast.
for example, "2" means that price is expected to remain within
the forecast plot ~95% of the time. A higher number produces a
wider forecast.
The output table shows:
- realized vol: the volatility over the previous N periods, where N =
"volatility window".
- forecast vol: the realized volatility from N periods ago, where N =
"forecast periods"
- up/down fcst (level): the price level of the forecast for the next
N bars, where N = "forecast periods".
- up/down fcst (%): the difference between the current and forecast
price, expressed as a whole number percentage.
The plots show:
- blue/red plot: the upper/lower forecast from "forecast periods" ago.
- blue/red line: the upper/lower forecast for the next
"forecast periods".
- red/blue labels: an "X" where the price touched the forecast from
"forecast periods" ago.
+ NOTE: pinescript only draws a limited number of labels.
They will not appear very far into the past.

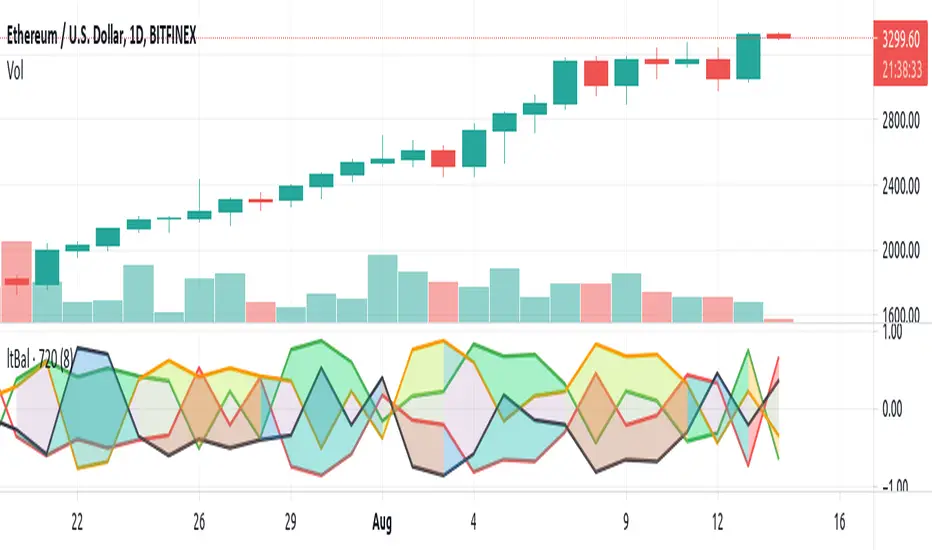
Light BalanceThe script is simple, going for a color scheme logic which tenderly avoids rigorous signals processing.
For the script to remain simple, logical derivatives are also out; as such, there are no secondary relations built off of primary ones. And it also ignores (unless you do this yourself) the logic in a varying order of lines.
Coloring has been done according to a limited set of relations between the four (4) plotted lines.
Quite a bit of information is capture, as you'll see when looking at line order, crossings, and transparency transitions and their patterns.
The approach makes the relations ones which can be learned over time; you become the algorithm to sort out signals. Ha ha. I know that sounds like a cop out doesn't it. Did I mention it's a simple script?
One thing you might want to play with right away are fills having red and green, and lime and fuchsia. It would be cool to reduce it all down to two (2) colors, but all the boolean relations might have to be listed, and it also may not be possible to cumulatively combine transparency overlays of the same value. Visually, that approach may not result to awaken a useful feature anyway. Also, fill() has its limitations in that it cannot be in a local scope; this includes function wrapped calls to fill(), or calls made using branching logic statements if/elseif, iff(), and var = (cond) ? t_val/exp : f_val/exp. So, to my knowledge, a fill() can not be made to be logically on/off.
Please, enjoy getting some use out of it.
Price Volume Trend + Signal and HistogramThis is a script based on PVT + Signal Line, which can be EMA or SMA. It then plots a histogram which is equal to PVT - Signal. This makes it easier to spot divergences.
To better match up the scales, we decided to add a multiplication factor to the histogram. Each asset and even timeframe requires a different multiplication factor, so please experiment to find what suits you.
Credits and special thanks are listed on the source code.
