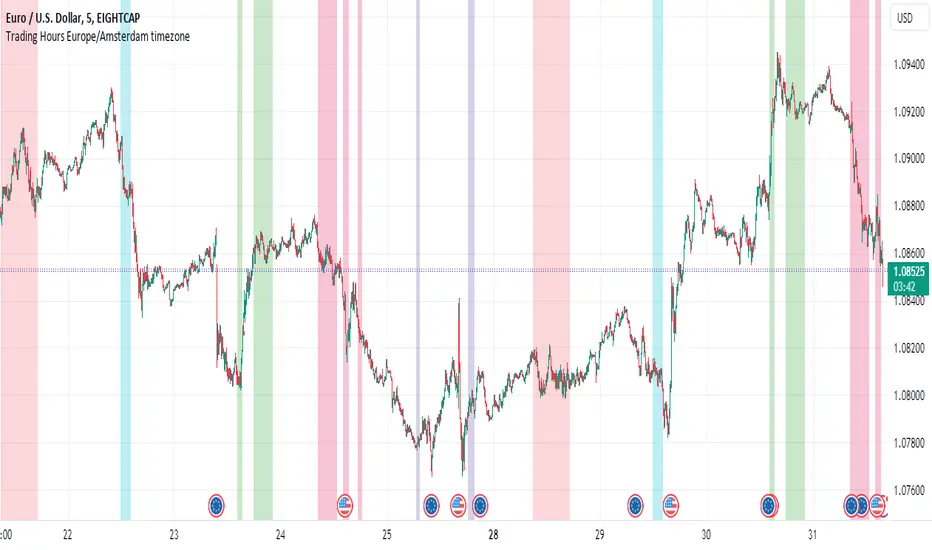
Personal Trading Hours (timezone Europe/Amsterdam)This Personal Trading Hours indicator is intended to specify the times you can trade and make them visible on the chart. Multiple sessions can be specified per specific day of the week and you can give each day its own color if you want.
This can be used perfectly if you are backtesting your strategy manually. You can indicate exactly when you have time to look at the charts and therefore only perform your backtest at those times. Making mistakes that you open en close trades during your sleeptime or worktime in your backtest are gone.
But this indicator is also suitable for live trading.
Filter out the times when you don't want to trade, for example during lunchtime, during opening hours of the exchanges or when you know that big news events will take place during your tradingweek. All the timesessions you do want to trade you can make visible on you chart.
The timezone that is used for this indicator is the timezone: Europe/Amsterdam and therefor only usable for traders in this timezone.
You can use this indicator for timeframes lower then the Daily timeframe with the normal settings. If you want to use this indicator on the Daily timeframe, all the settings in the upper part of the settingsmenu must be unchecked and only the part at the bottom of the settingsmenu can then be used.
This indicator doesn't work on timeframes higher than the Daily timeframe.
If you do not use all the tradingsessions on each day, you have to make sure that all the boxes are filled. So unused session boxes must have the same timeperiodes as the used boxes, otherwise the whole day will be highlighted on the chart.
Sessions
Quarterly Cycles [Daye's Theory]This is entirely based on quarters theory by Daye (@traderdaye in Twitter). I'm merely the creator of the indicator and full credits for the underlying concept goes to Daye.
The idea is to split year, month, week and day into quarters at specific times which lead to PO3 (Accumulation-Manipulation-Distribution) cycles within those quarters.
They present in one of these two forms:
Q1. (A)ccumulation - Consolidation
Q2. (M)anipulation - Judas Swing
Q3. (D)istribution - Low Resistance Liquidity Run
Q4. (X) - Continuation/Reversal of previous quarter
(OR)
Q1. (X) - Continuation/Reversal of previous quarter
Q2. (A)ccumulation - Consolidation
Q3. (M)anipulation - Judas Swing
Q4. (D)istribution - Low Resistance Liquidity Run
As of now, the indicator assumes everything as AMDX, but if some clever idea comes in the future, I'll try to implement XAMD as well.
Similar to True Day Opens, there are True Monthly Opens, True Weekly Opens and True Session Opens, all of which form during the second quarters of those periods, all of which are marked by the indicator. For timeframes in H1 and below, the indicator shows weekly, daily and session quarter cycle phases. For higher timeframes, it shows yearly, monthly and weekly cycle phases.

Max/Min Custom Sessions and Day Before - MarposIt takes the maximum and minimum session prices according to the entered time ranges and display them on the screen. When those values are reached, it marks them as taken.
Additionally, it displays the values and how much they moved in PIPs during those sessions in a table in the top left corner using the difference between max and min values.
Also, mark the background of the sessions on the chart according to the entered time ranges.
Furthermore, draw the D-1 highs and lows for each day to see the previous day's possible liquidity levels. It doesnt mark them as Taken when that happens because i couldnt realize how to do it, yet :).
Any questions or suggestions, feel free to contact me and ill do my best.

ICT Kill Zones [dR-Algo]ICT Kill Zones Indicator by dR-Algo
Introducing the dR-Algo's ICT Kill Zones Indicator – a tool meticulously crafted to blend with the elegance of the ICT Concept of Kill Zones. Built for traders who seek clarity and focus, this unique indicator is tailored to highlight the essential time frames while ensuring minimal distraction from the core price action.
Key Features:
Three Kill Zones:
London Kill Zone: Kickstart your trading day with the London Kill Zone, highlighting the critical period between 03:00 to 04:00 (UTC-4). The London session, known for its volatility due to the overlapping of the Asian session, is captured precisely for your benefit.
NY AM Session: As the European markets gear towards close and the US markets come alive, our indicator emphasizes the activity from 10:00 to 11:00 (UTC-4). It’s a window where significant market moves often originate.
NY PM Session: Capture the late-day trading action between 14:00 to 15:00 (UTC-4). As markets prepare to close, this time frame can offer last-minute opportunities.
Subtle Yet Effective Visualization: Unlike many other indicators that bombard traders with an array of colors, our ICT Kill Zones Indicator is intentionally designed to be subtle. It provides just the right amount of visual emphasis without overwhelming the chart. The primary goal is to let traders focus on what truly matters: the price action.
User-Friendly Customization: The indicator's settings can be easily tailored to align with individual trading styles, allowing traders to adjust and tweak as per their preference.
Seamless Integration with Trading View: Smoothly integrates with your TradingView charts ensuring optimal performance and real-time responsiveness.
Why Choose Our ICT Kill Zones Indicator?
The market is flooded with indicators, each promising to be the 'next big thing.' What sets dR-Algo's ICT Kill Zones Indicator apart is its dedication to simplicity and effectiveness. It's not just about adding an indicator to your chart; it's about adding value to your trading experience. By seamlessly merging vital time frames without overshadowing the price action, we ensure traders get the best of both worlds.
Join the trading revolution with dR-Algo and embrace a focused approach to the markets.

Market Sessions and TPO (+Forecast)This indicator "Market Sessions and TPO (+Forecast)" shows various market sessions alongside a TPO profile (presented as the traditional lettering system or as bars) and price forecast for the duration of the session.
Additionally, numerous statistics for the session are shown.
Features
Session open and close times presented in boxes
Session pre market and post market shown
TPO profile generated for each session (normal market hours only)
A forecast for the remained of the session is projected forward
Forecast can be augmented by ATR
Naked POCs remain on the chart until violated
Volume delta for the session shown
OI Change for the session shown (Binance sourced)
Total volume for the session shown
Price range for the session shown
The image above shows processes of the indicator.
Volume delta, OI change, total volume and session range are calculated and presented for each session.
Additionally, a TPO profile for the most recent session is shown, and a forecast for the remainder of the active session is shown.
The image above shows an alternative display method for the session forecast and TPO profile!
Additionally, the pre-market and post-market times are denoted by dashed boxes.
The image above exemplifies additional capabilities.
That's all for now; further updates to come and thank you for checking this out!
And a special thank you to @TradingView of course, for making all of this possible!

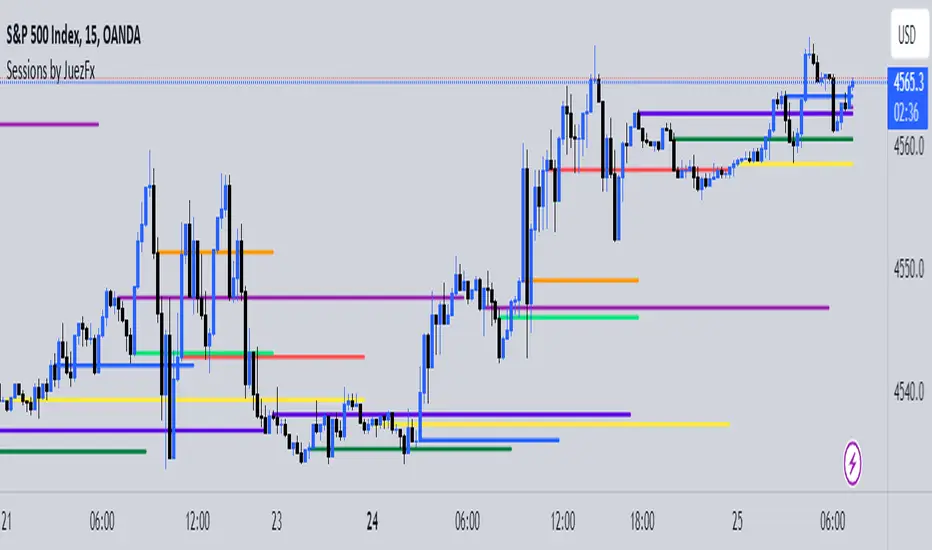
Sessions by JuezFxLines Plotted at the opening price of London, New York, New York Stock Exchange, and Asia. It could also plot lines of the closing price of the session.
The script is just plotting a line at those levels to give us a visual indicator of those specific levels as they could be very beneficial for your trading. Opening and closing of the session hold the most liquidity, attracting the market towards it.
I hope this script will help you in your trading and you can use those levels along with other confluences in order to identify key levels that the market could react from!
There are some similar scripts but this one have more lines to plot at could be identified by different color and line thickness!
Indian Market Sessions for BacktestingThis indicator is designed to increase the quality of your backtesting in the Indian Market.
NSE & BSE run from 9:15 am IST to 3:30 pm IST.
Naturally different times have different kinds of volatility.
On your chart you will find premarked -
Saffron - 9:15 am to 10:30 am - Opening Session - High Volatility Observed Historically
White - 10:35 am to 2:25 pm - Middle Session - Lower Volatility Observed Historically
Green - 2:30 pm to 3:30 pm - Closing Session - Medium to High Volatility Observed Historically
You will also find the start of each session marked with an arrow.
Feel free to change the times from the input settings and the color and visibility from the style settings.
_______________
Usage:
When you backtest any strategies, say moving average crossovers, also mark the sessions in your sheet which will help you further increase accuracy.
Feel free to drop your doubts in the comments.

ICT Silver Bullet [LuxAlgo]The ICT Silver Bullet indicator is inspired from the lectures of "The Inner Circle Trader" (ICT) and highlights the Silver Bullet (SB) window which is a specific 1-hour interval where a Fair Value Gap (FVG) pattern can be formed.
When a FVG is formed during the Silver Bullet window, Support & Resistance lines will be drawn at the end of the SB session.
There are 3 different Silver Bullet windows (New York local time):
The London Open Silver Bullet (3 AM — 4 AM ~ 03:00 — 04:00)
The AM Session Silver Bullet (10 AM — 11 AM ~ 10:00 — 11:00)
The PM Session Silver Bullet (2 PM — 3 PM ~ 14:00 — 15:00)
🔶 USAGE
The ICT Silver Bullet indicator aims to provide users a comprehensive display as similar as possible to how anyone would manually draw the concept on their charts.
It's important to use anything below the 15-minute timeframe to ensure proper setups can display. In this section, we are purely using the 3-minute timeframe.
In the image below, we can see a bullish setup whereas a FVG was successfully retested during the Silver Bullet session. This was then followed by a move upwards to liquidity as our target.
Alternatively, you can also see below a bearish setup utilizing the ICT Silver Bullet indicator outlined.
At this moment, the indicator has removed all other FVGs within the Silver Bullet session & has confirmed this FVG as the retested one.
There is also a support level marked below to be used as a liquidity target as per the ICT Silver Bullet concept suggests.
In the below chart we can see 4 separate consecutive examples of bullish & bearish setups on the 3-minute chart.
🔶 CONCEPTS
This technique can visualize potential support/resistance lines, which can be used as targets.
The script contains 2 main components:
• forming of a Fair Value Gap (FVG)
• drawing support/resistance (S/R) lines
🔹 Forming of FVG
1 basic principle: when a FVG at the end of the SB session is not retraced, it will be made invisible.
Dependable on the settings, different FVG's will be shown.
• 'All FVG': all FVG's are shown, regardless the trend
• 'Only FVG's in the same direction of trend': Only FVG's are shown that are similar to the trend at that moment (trend can be visualized by enabling ' Show ' -> ' Trend ')
-> only bearish FVG when the trend is bearish vs. bullish FVG when trend is bullish
• 'strict': Besides being similar to the trend, only FVG's are shown when the closing price at the end of the SB session is:
– below the top of the FVG box (bearish FVG)
– above bottom of the FVG box (bullish FVG)
• 'super-strict': Besides being similar to the trend, only FVG's are shown when the FVG box is NOT broken
in the opposite direction AND the closing price at the end of the SB session is:
– below bottom of the FVG box (bearish FVG)
– above the top of the FVG box (bullish FVG)
' Super-Strict ' mode resembles ICT lectures the most.
🔹 Drawing support/resistance lines
When the SB session has ended, the script draws potential support/resistance lines, again, dependable on the settings.
• Previous session (any): S/R lines are fetched between current and previous session.
For example, when current session is ' AM SB Session (10 AM — 11 AM) ', then previous session is
' London Open SB (3 AM — 4 AM) ', S/R lines between these 2 sessions alone will be included.
• Previous session (similar): S/R lines are fetched between current and previous - similar - session.
For example, when current session is ' London Open SB (3 AM — 4 AM)' , only S/R lines between
current session and previous ' London Open SB (3 AM — 4 AM) ' session are included.
When a new session starts, S/R lines will be removed, except when enabling ' Keep lines (only in strict mode) '
This is not possible in ' All FVG ' or ' Only FVG's in the same direction of trend ' mode, since the chart would be cluttered.
Note that in ' All FVG ' or ' Only FVG's in the same direction of trend ' mode, both, Support/Resistance lines will be shown,
while in Strict/Super-Strict mode:
• only Support lines will be shown if a bearish FVG appears
• only Resistance lines if a bullish FVG is shown
The lines will still be drawn the the end of the SB session, when a valid FVG appears,
but the S/R lines will remain visible and keep being updated until price reaches that line.
This publication contains a "Minimum Trade Framework (mTFW)", which represents the best-case expected price delivery, this is not your actual trade entry - exit range.
• 40 ticks for index futures or indices
• 15 pips for Forex pairs.
When on ' Strict/Super-Strict ' mode, only S/R lines will be shown which are:
• higher than the lowest FVG bottom + mTFW, in a bullish scenario
• lower than the highest FVG bottom - mTFW, in a bearish scenario
When on ' All FVG/Only FVG's in the same direction of trend ' mode, or on non-Forex/Futures/Indices symbols, S/R needs to be higher/lower than SB session high/low.
🔶 SETTINGS
(Check CONCEPTS for deeper insights and explanation)
🔹 Swing settings (left): Sets the length, which will set the lookback period/sensitivity of the Zigzag patterns (which directs the trend)
🔹 Silver Bullet Session; Show SB session: show lines and labels of SB session
Labels can be disabled separately in the ' Style ' section, color is set at the ' Inputs ' section.
🔹 FVG
– Mode
• All FVG
• Only FVG's in the same direction of trend
• Strict
• Super-Strict
– Colors
– Extend: extend till last bar of SB session
🔹 Targets – support/resistance lines
– Previous session (any): S/R lines fetched between current and previous SB session
– Previous session (similar): S/R lines fetched between current and previous similar SB session
– Colors
– Keep lines (only in strict mode)
🔹 Show
– MSS ~ Session: Show Market Structure Shift , only when this happens during a SB session
– Trend: Show trend (Zigzag, colored ~ trend)

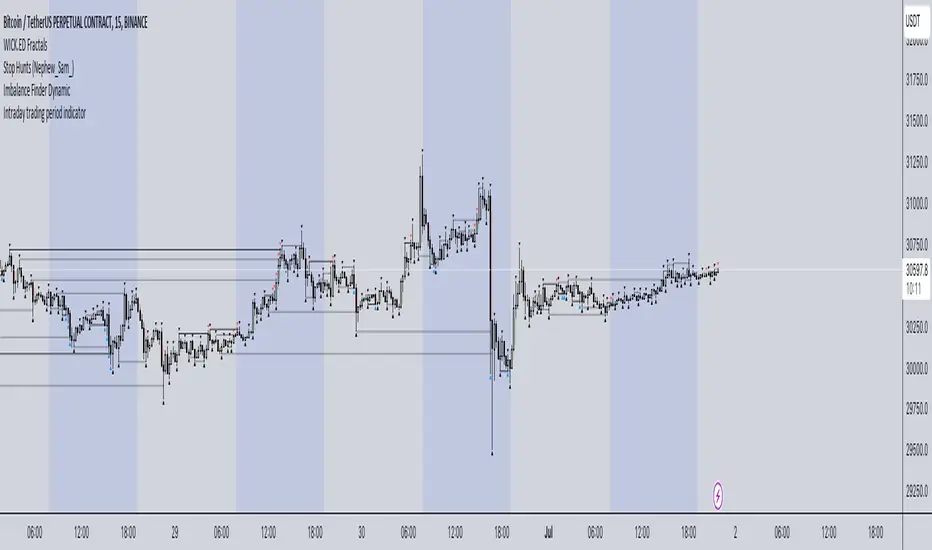
Intraday trading period indicatorI have created this indicator because I was in a need of simple indication of personal session time for my backtesting while practicing intraday Futures trading.
How it works:
1. Define your timezone.
2. Set Trading session start/end time.
3. Choose the colour you want to see your intraday session in.
Actual result: Your selected session is displayed with selected colour and within selected time period. Your are good to go.
It is not perfect for sure but it does what it needs to do and I think it is awesome.
Hope it will be useful for you and let the Profit be with you!
ICT Killzones + Pivots [TFO]Designed with the help of TTrades and with inspiration from the ICT Everything indicator by coldbrewrosh, the purpose of this script is to identify ICT Killzones while also storing their highs and lows for future reference, until traded through.
There are 5 Killzones / sessions whose times and labels can all be changed to one's liking. Some prefer slight alterations to traditional ICT Killzones, or use different time windows altogether. Either way, the sessions are fully customizable. The sessions will auto fit to keep track of the highs and lows made during their respective times, and these pivots will be extended until they are invalidated.
There are also 4 optional Open Price lines and 4 vertical Timestamps, where the user can change the time and style of each one as well.
To help maintain a clean chart, we can implement a Cutoff Time where all drawings will stop extending past a certain point. The indicator will apply this logic by default, as it can get messy with multiple drawings starting and stopping throughout the day at different times.
Given the amount of interest I've received about this indicator, I intend to leave it open to suggestions for further improvements. Let me know what you think & what you want to see added!

FX Sessions w/ Watermark
This my own implementation of the session ranges using Pinescript V5. This indicator allows you to define 3 different sessions, namely Asian, London, and New York.
The first setting on Top is the Timezone. By default it is set to GMT +4 which is the timezone for NY.
Next is a customizable Watermark and sub watermark to allow you to input a meaningful text. It has also an option to show or hide the currency/symbol info.
Features
Define session based on customizable timezone.
Add big watermark text and customize its size, color, and position
Add sub watermark text and customize its size, color, and position
Add option to show symbol info and adjust its size, color, and position
Option to add True New York Midnight Divider
Option to define the Asian, London, and New York opening and closing session.

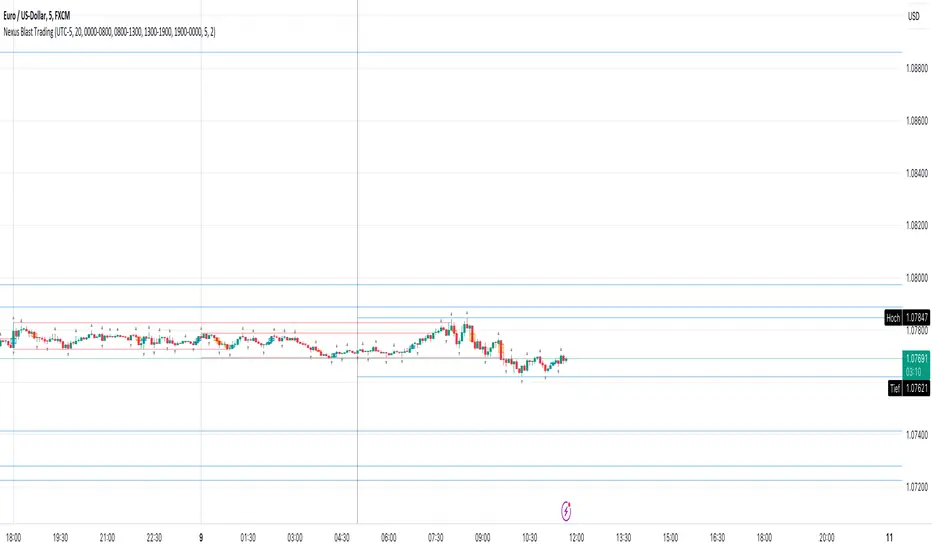
Nexus Blast Trading Strategy [Kaspricci]Nexus Blast Trading Strategy - Kaspricci
This indicator shows the different sessions during the day (London session, New York AM session, New York PM session and Asian session) by adding vertical lines and draws horizontal lines for the high and low during each session. Furthermore those lines turn red once the price has taken this high or low. Blue lines indicate liquidity not yet taken.
On top the indicator draws boxes of different color to indicate bullish and bearish Fair Value Gaps (FVG).
Happy to receive your feedback. Please leave a comment for bugs as well as ideas for improvement.
General Settings
Time Zone - used for marking sessions and end of day.
Sessions
Sessions - start and end time for each session based on set time zone
Number of Days back - for how many days in the past the startegy will draw strategy highs and lows. Theres is a maximum of 50 days defined.
FVG Settings
Threshold in Ticks - you can hide very small FVGs by increasing this threshold
FVG Colors - colors used for the bearish and bullish FVG box
This script is for educational purposes only! It is not meant to be a financial advice.
PS: The former strategy script was removed by TV, as it would violate several rules according to them.
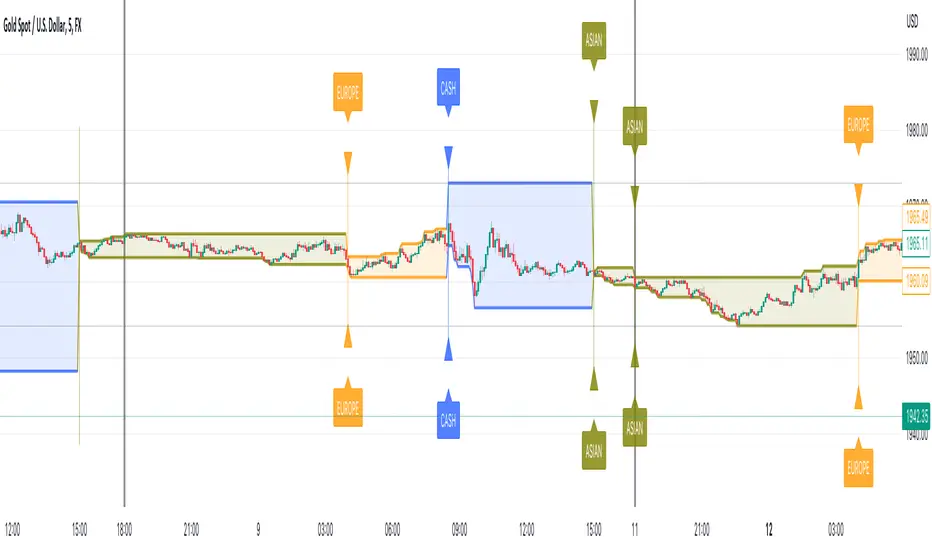
Session Tick-BoxThe "Session Tick-Box" is designed to display session-related information on the chart (HIGH/LOW box). Here's a breakdown of its features and functionalities:
Session Settings:
You can specify different sessions such as the Cash Session, Asian Session, European Session, and Offset Session using the input.session() function.
The sat.session_tick() function is used to calculate the low, high, fill color, open bar status, and session open status for each session.
Display Settings:
You have the option to show a new daily session using the separateDays input. The background color for the new session can be customized using the Day_Bg input.
The colorDays input allows you to enable or disable coloring the background based on different days of the week.
You can customize the colors for the Cash, Asian, European, and Offset sessions using the respective color inputs.
Other Features:
The indicator calculates the percentage change between the low and high of each session using the sat.AbsPercentChange() function.
Labels are added to mark the high and low points of the sessions.
A vertical line is drawn between the low and high points of each session using the line.new() function.
The fill() function is used to create a shaded area between the low and high lines of each session.
Overall, the "Session Tick-Box" indicator provides visual representation and analysis of different sessions on the chart, including their respective ranges and percentage changes.
Session Bar Color (US Time)This script is designed to change the color of bars on a trading chart based on different trading sessions in Eastern Time (ET). It is different from currently published scripts in that it specifically focuses on US time sessions and provides a customizable approach to defining and coloring each session.
To use this script, you can apply it to a chart by selecting it from the list of available indicators or overlays.
The script is meant for traders who are interested in visualizing different trading sessions on their charts. By coloring the bars based on session boundaries, it can help traders quickly identify session changes and potentially adjust their trading strategies accordingly. Mostly it's used to draw the high and low zones of each session.
The markets this script is suitable for are those that operate within the US time zones, as it specifically focuses on Eastern Time (ET) sessions. It can be used for various types of markets, including stocks, futures, and forex.
The conditions for each session are defined using the input. session function, which allows you to specify the start and end times for each session. The script includes four sessions: Asian, London, USA, and New York. By modifying the defval parameter for each session input, you can customize the session times to fit your specific trading preferences or time zone.
The script uses the time function to check if the current bar falls within a particular session. If the condition is met, it sets the color of the bar using the bar color function. Each session is assigned a different color: black for the Asian session, teal for the London session, a custom RGB color (dark red) for the USA session, and red for the New York session.
It's important to note that this script assumes the time zone of the trading platform is set to "Etc/GMT+4" to align with Eastern Time (ET). If your platform uses a different time zone, you may need to adjust the time function calls to match your desired time zone.

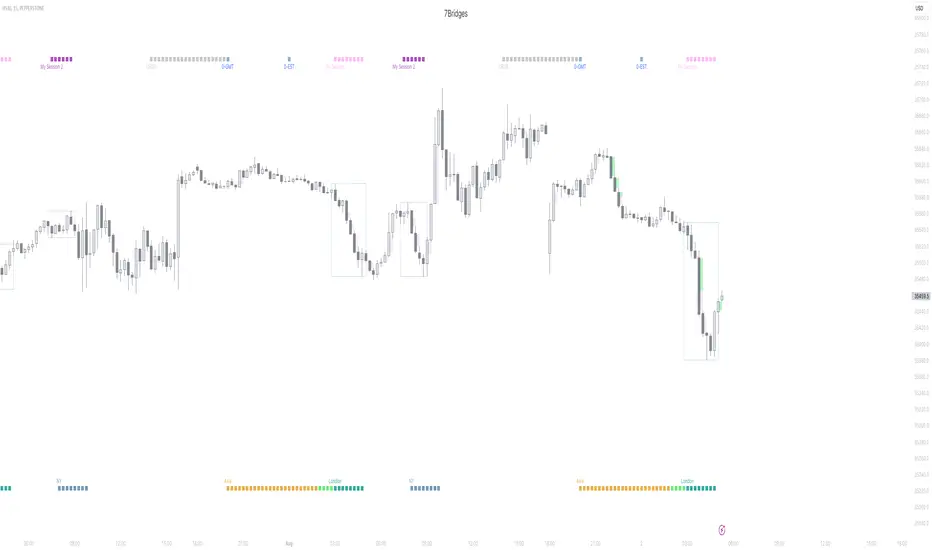
Session KillZones [7Bridges]Session Killzones by 7Bridges indicator display the killzones of asian, LND and NY sessions. There is also a custom session of your choice.
The times of each killzone are GMT time and you can adjust it in the settings.
You have also the beginning of the day, GMT and EST timezones.
By default the killzones are set like that on the GMT/UTC timezone :
-> Asia : 00:00 - 06:00
-> Pre London : 06:00 - 07:00
-> London : 07:00 - 10:00
-> New York : 12:00 - 15:00
-> Custom session : choose your own time
What makes the indicator very different is that the session is not overlapping the price but you have bars below and above the price.
Settings:
-> you can chose to display the Killzones (Asia, pre LND, LND and NY)
-> you can manages the time of the sessions
-> you can chose to display the start of the day (GMT/UTC and EST )
The indicator is displayed by default only for all the timeframes below 60min.
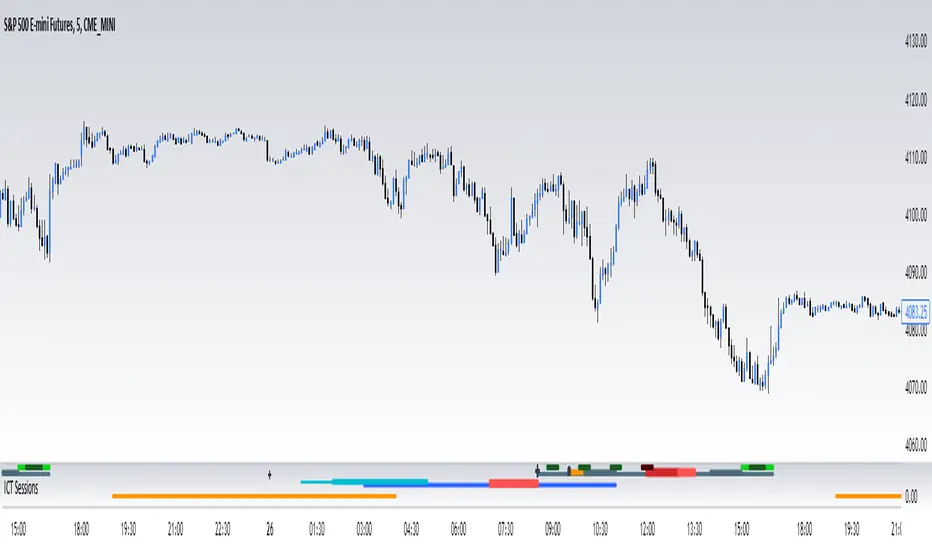
ICT SessionsThis script plots the timewindows of the ICT killzones (for forex) and trading session + makros below the chart. Individual components can be switched of to your liking
FVG Sessions [LuxAlgo]The FVG Sessions indicator highlights the first fair value gap of the trading session as well as the session range. Detected fair value gaps extend to the end of the trading session.
Alerts are included on the formation of a session fair value gap, price being within a session fair value gap, mitigations, and price crossing session fair value gaps average.
🔶 USAGE
Trader ICT states that the first fair value gap of the trading session can attract the most significant reaction. Having only one FVG per session allows users to further focus on that precise imbalance as well as external elements.
The mitigation of a fair value gap is clearly indicated on the chart with a more transparent color allowing users to see inverse FVGs.
Extending the fair value gaps allows the imbalance area to provide potential support and resistance.
Do note that this script should be used on intraday charts.
🔶 ALERTS
The script includes the following alerts:
🔹 Bullish/Bearish FVG
Alerts on the formation of the first bullish or bearish FVG of the session.
🔹 Bullish/Bearish FVG Mitigation
Alerts when the first bullish or bearish FVG of the session is mitigated.
🔹 Price Within FVG
Alerts when price is within the first bullish or bearish FVG area of the session.
🔹 Price Cross FVG Average
Alerts when price cross the average level of the first bullish or bearish FVG of the session.

Sessions - AlgoLabA script in UTC for London, New York, Tokyo, & Sydney sessions.
Recommended on any timeframe < 1H.
---
Using this script, a box is plotted on the opening candle of each session; this can show us valuable areas on each chart where price may mediate to show a standing move.
You may also select each of the session boxes, in the settings; this will show you a box of the opening, low, high, and close of each selected sessions.
Each and all boxes are closed at the end of each session.
-The script produces a time table that will show you when each session occurs, and if the current time is within one of those sessions.
---
On this chart you can see boxes formed on the opening candles of the sessions,
London is red, New York is blue, Sydney is green, Tokyo is yellow.
-A key point to notice, before using this script, is how price may mediate around each box, before causing a move.
-Some boxes may be larger / smaller than others, due to the size of the opening candle.
---
Lots of updates to come, any recommendations? Feel free to leave a comment.
Hope it helps, enjoy!

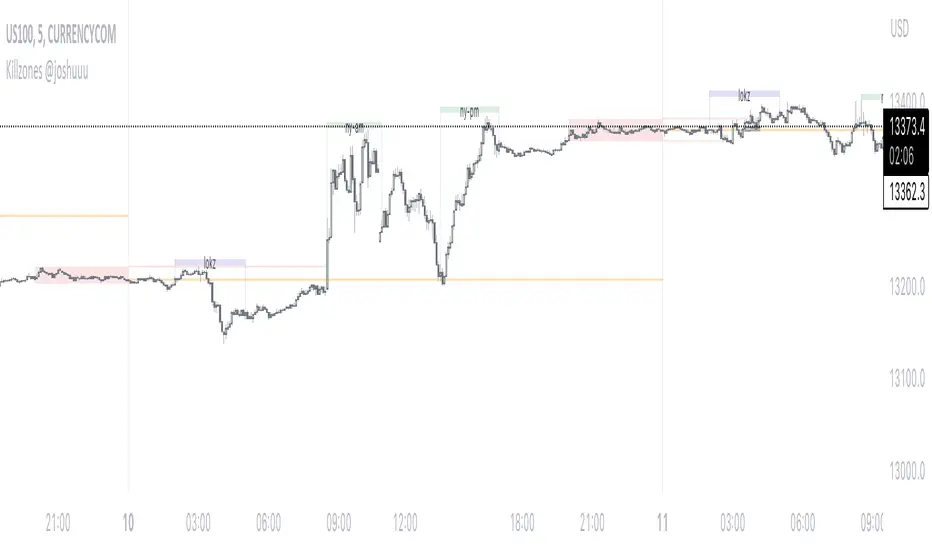
Killzones @joshuuuThis Indicator is based on "ICT Killzones" - sessions in which price moves the "cleanest" and usually has the most volume.
The script is able to either display Killzones as a Label above current bars, or in form of lines on top or bottom of the charts.
Also, the user is able to choose between Forex Killzones and Indices Killzones.
times for killzones:
Forex
-London 0200-0500
-NY 0700-1000
Indices
-London 0200-0500
-NY AM 0830-1100
-NY PM 1330-1600
⚠️ Open Source ⚠️
Coders and TV users are authorized to copy this code base, but a paid distribution is prohibited. A mention to the original author is expected, and appreciated.
⚠️ Terms and Conditions ⚠️
This financial tool is for educational purposes only and not financial advice. Users assume responsibility for decisions made based on the tool's information. Past performance doesn't guarantee future results. By using this tool, users agree to these terms.
ICT Opening Lines [MK]Plots horizontal lines for the following opening times:
00:00 open
08:30 open
09:30 open
13:30 open
Opening lines can be used to monitor for power of 3/judas swings as per ICT teachings. The script allows the user to set a maximum timeframe for displaying the lines to keep HTF charts clean. Also an option is available to hide the lines after the market closes. If the hide option is used, the lines will be removed at 23:00.
Removing the lines after market closes ensures that the charts are clean when the market opens.
Labels can be displayed, colors and line styles can be customised.
Sessions Indicator [CodeDNL]A sessions indicator that doesn't cover the whole trading screen, and continues into the future.
Made to be easier on the eyes than existing solutions.

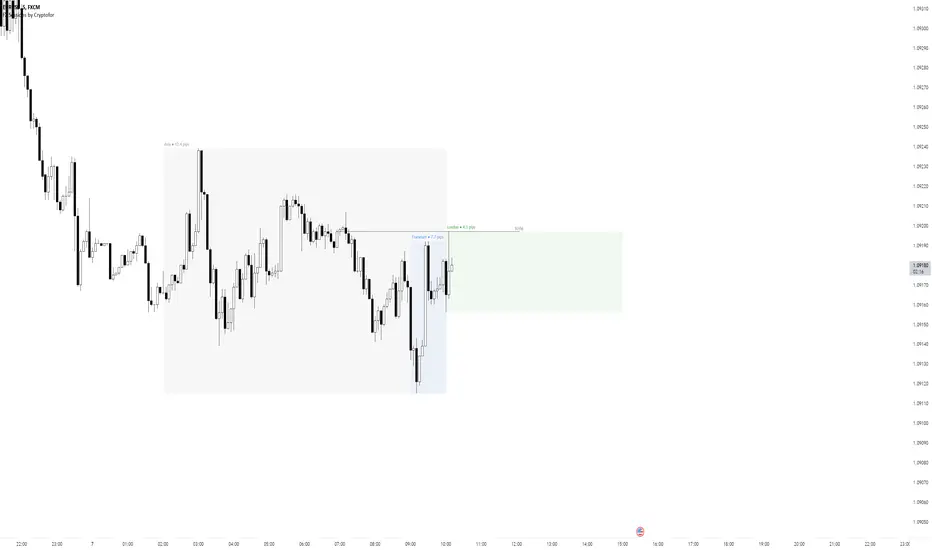
Forex Sessions by CryptoforForex Sessions Boxes
Killzones are the period of greatest volatility, and volatility is one of the main factors for finding the optimal trade time (OTT/Optimal Trade Time). That is, in a period of high volatility, we as traders have the most chances to open a good position, and at the same time not to sit on the charts for too long waiting for its closing.
Sessions:
1. Asian Session:
2. Frankfurt Session:
3. London Session:
3. New York Session:
Features:
Time zone change
Session time change
Show/hide Historical Data
Show/hide Pips
Show/hide Previous Day High/Low
Show/hide New York Midnight/True Daily Open
Text size and align customization
Borders style
Line and border sizes
Full customization of colors: borders, price lines, text, background
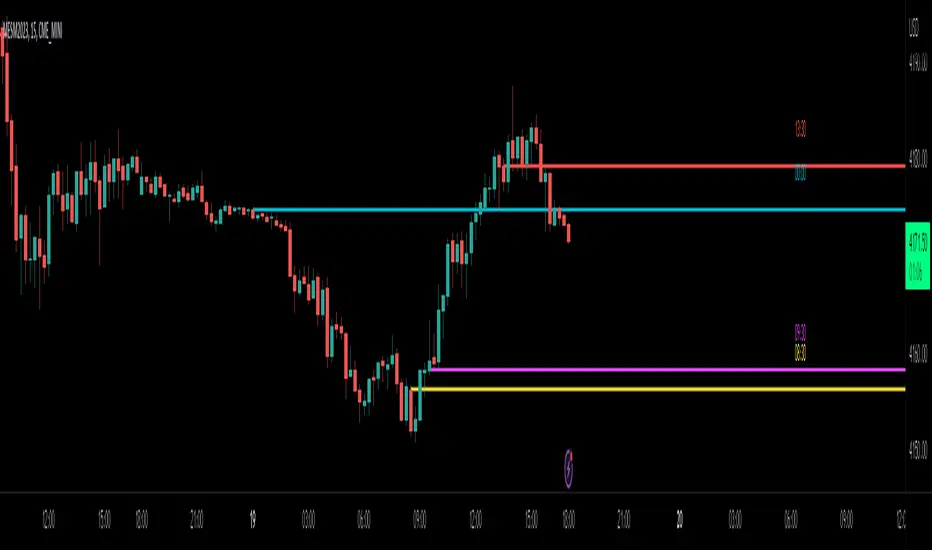
ICT Macros by CryptoforICT Macros by Cryptofor
Time periods in which the price is most volatile. At this time, the algorithm is programmed to attack liquidity or fill a significant FVG from which the OF can continue.
Plots of macros:
1. London Macros:
02:33 - 03:00
04:03 - 04:30
2. New York AM Macros:
08:50 - 09:10
09:50 - 10:10
10:50 - 11:10
3. New York Lunch + PM Macros:
11:50 - 12:10
13:10 - 13:40
15:15 - 15:45
Features:
Flexible line settings
Flexible text settings
Display data for all time or for the last 24 hours
Switch for each type of macro
Macro background color settings
