[blackcat] L2 Barbara Star Supertrend IndicatorLevel 2
Background
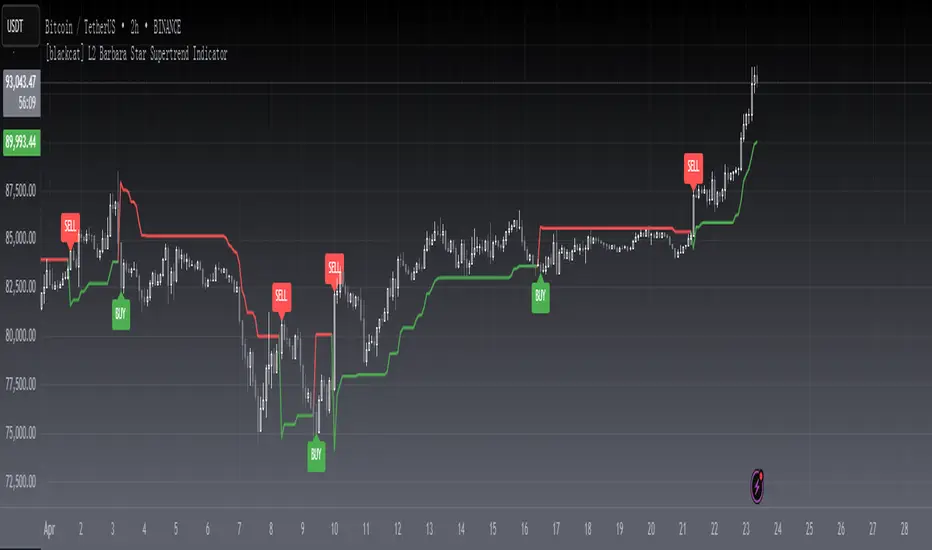
Barbara Star’s article on July 2023, “Stay On Track With The Supertrend Indicator”, I rewrote it as pine script for your information.
Function
A supertrend indicator is displayed either above or below the closing price to signal a buy or sell. The indicator changes color depending on whether you should buy or not. When the Supertrend indicator falls below the closing price, the indicator turns green, signaling one or more entry points to buy.
Author Barbara Star describes the Supertrend indicator and how it can be used as a means for traders to stay in sync with the larger trend. She explains how J. Welles Wilder's Average True Range (ATR) forms a basis for supertrend calculations. ATR does not measure price direction, but rather provides a measure of volatility over a period of time. The Supertrend indicator, on the other hand, provides a more comprehensive view of trend direction. In addition, the indicator provides price levels at which a trend reversal would occur.
Green color stands for up trend;
Red color stands for down trend.
Remarks
Feedbacks are appreciated.
"黄金价格+2023年1月1日+财经网站" için komut dosyalarını ara
Discrete Fourier Transformed Money Flow IndexThe Discrete Fourier Transform Money Flow Index indicator integrates the Money Flow Index (MFI) with Discrete Fourier Transform (credit to author wbburgin - May 26 2023 ) smoothing to offer a refined and smoothed depiction of the MFI's underlying trend. The MFI is calculated using the formula: MFI = 100 - (100 / (1 + MR)), where a high MFI value indicates robust buying pressure (signaling an overbought condition), and a low MFI value indicates substantial selling pressure (signaling an oversold condition).
Why is the DFT and MFI combined?
The aim of this combination between DFT and MFI is to effectively filter out short-term fluctuations and noise, enabling a clearer assessment of the overall trend. This smoothing process enhances the reliability of the MFI by emphasizing dominant and sustained buying or selling pressures. This script executes a full DFT but only uses filtering from one frequency component. The choice to focus on the magnitude at index 0 is significant as it captures the dominant or fundamental frequency in the data. By analyzing this primary cyclic behavior, we can identify recurring patterns and potential turning points more easily. This streamlined approach simplifies interpretation and enhances efficiency by reducing complexity associated with multiple frequency components. Overall, focusing on the dominant frequency and applying it to the MFI provides a concise and actionable assessment of the underlying data.
Note: The FMFI indicator provides both smoothed and non-smoothed versions of the MFI, with the option to toggle the original non-smoothed MFI on or off in the settings.
Application
FMFI functions as a trend-following indicator. Bullish trends are denoted by the color white, while bearish trends are represented by the color purple. Circles plotted on the FMFI indicate regular bull and bear signals. Additionally, red arrows indicate a strong negative trend, while green arrows indicate a strong positive trend. These arrows are calculated based on the presence of regular bull and bear signals within overbought and oversold zones. To enhance its effectiveness, it is recommended to combine this indicator with other complementary technical analysis tools and integrate it into a comprehensive trading strategy. Traders are encouraged to explore a wide range of settings and timeframes to align the indicator with their unique trading preferences and adapt it to the current market conditions. By doing so, traders can optimize the indicator's performance and increase their potential for successful trading outcomes.
Utility
Traders and investors can employ this indicator to enhance their trend-following strategies. The white-colored components of the FMFI can help identify potential buying zones, while the purple-colored components can assist in identifying potential selling points. The red and green arrows can be used to pinpoint moments of strong bull or bear momentum, allowing traders to position themselves advantageously in their trading activities. Please note that future performance of any trading strategy is fundamentally unknowable, and past results do not guarantee future performance.

CalendarCadLibrary "CalendarCad"
This library provides date and time data of the important events on CAD. Data source is csv exported from www.fxstreet.com and transformed into perfered format by C# script.
HighImpactNews2015To2023()
CAD high impact news date and time from 2015 to 2023

CalendarEurLibrary "CalendarEur"
This library provides date and time data of the important events on EUR. Data source is csv exported from www.fxstreet.com and transformed into perfered format by C# script.
HighImpactNews2015To2019()
EUR high impact news date and time from 2015 to 2019
HighImpactNews2020To2023()
EUR high impact news date and time from 2020 to 2023
CalendarGbpLibrary "CalendarGbp"
This library provides date and time data of the important events on GBP. Data source is csv exported from www.fxstreet.com and transformed into perfered format by C# script.
HighImpactNews2015To2019()
GBP high impact news date and time from 2015 to 2019
HighImpactNews2020To2023()
GBP high impact news date and time from 2020 to 2023

CalendarJpyLibrary "CalendarJpy"
This library provides date and time data of the important events on JPY. Data source is csv exported from www.fxstreet.com and transformed into perfered format by C# script.
HighImpactNews2015To2023()
JPY high impact news date and time from 2015 to 2023
CalendarUsdLibrary "CalendarUsd"
This library provides date and time data of the important events on USD. Data source is csv exported from www.fxstreet.com and transformed into perfered format by C# script.
HighImpactNews2015To2019()
USD high impact news date and time from 2015 to 2019
HighImpactNews2020To2023()
USD high impact news date and time from 2020 to 2023

NewsEventsGbpLibrary "NewsEventsGbp"
This library provides date and time data of the high imact news events on GBP. Data source is csv exported from www.fxstreet.com and transformed into perfered format by C# script.
gbpNews2015To2019()
GBP high imact news date and time from 2015 to 2019
gbpNews2020To2023()
GBP high imact news date and time from 2020 to 2023

NewsEventsEurLibrary "NewsEventsEur"
This library provides date and time data of the high imact news events on EUR. Data source is csv exported from www.fxstreet.com and transformed into perfered format by C# script.
eurNews2015To2019()
EUR high imact news date and time from 2015 to 2019
eurNews2020To2023()
EUR high imact news date and time from 2020 to 2023

NewsEventsJpyLibrary "NewsEventsJpy"
This library provides date and time data of the high imact news events on JPY. Data source is csv exported from www.fxstreet.com and transformed into perfered format by C# script.
jpyNews2015To2023()
JPY high imact news date and time from 2015 to 2023

NewsEventsCadLibrary "NewsEventsCad"
This library provides date and time data of the high imact news events on CAD. Data source is csv exported from www.fxstreet.com and transformed into perfered format by C# script.
cadNews2015To2023()
CAD high imact news date and time from 2015 to 2023
NewsEventsUsdLibrary "NewsEventsUsd"
This library provides date and time data of the high imact news events on USD. Data source is csv exported from www.fxstreet.com and transformed into perfered format by C# script.
usdNews2015To2019()
USD high imact news date and time from 2015 to 2019
usdNews2020To2023()
USD high imact news date and time from 2020 to 2023
Futures All List / Sell SignalAs of May 2023, there are more than 180 usdt perpetual coins on the binance futures exchange. These coins are included in the indicator in lists of 40. They are sorted instantly in the table from largest to smallest. The sorting style can be changed in the indicator settings. This indicator collects RSI and TSI values at desired values. The result has a maximum value of 600. A value of 600 signals that the price will decrease or remain stable for a certain period of time. Generally, a short can be expected from the closest point to 600. If 3 separate lists are selected by using 3 of these indicators, 120 coins can be analyzed at the same time. Available in all time zones. Examine it in a 3-minute timeframe. The line inside the indicator draws the instantaneous values of the relevant coin.

Visible Range Linear Regression Channel [vnhilton](OVERVIEW)
This indicator calculates the linear regression channel for the visible bars shown on the chart instead of the traditional fixed length linear regression channel TradingView provides (and is more accurate I believe). Inspired by TradingView's Linear Regression Channel and Visible Average Price indicator, and the DAS Trader linear regression indicator.
(FEATURES)
- Ability to extend lines to the right
- Show/hide individual lines
- Adjust standard deviation of bands
- Adjust line style and width of basis and band lines
- Change individual line colours and plot fills between the lines
(DIFFERENCES)
If you compare this indicator to TradingView's Linear Regression Channel, you will notice some differences (as of 11th June, 2023). Differences and reasons are:
1) The intercept is wrong. The formula TradingView uses to calculate the intercept includes the addition of the gradient, which I believe is incorrect. Difference #2 is also why the intercept is wrong. This indicator omits that addition. This was verified by comparing the gradient calculated in this indicator with the gradient determined by Excel with the same data.
2) The gradient is "wrong". In quotations as essentially TradingView's code attempts to find the line of best fit, with the y-axis on the most recent bar instead of the oldest bar. This leads to the gradient being the opposite to the gradient found in this indicator, which isn't wrong, but the later formula used to calculate the intercept doesn't take this into account, resulting in an incorrect intercept value. The gradient and intercept values in this indicator matches those found in Excel.
3) Standard deviation bands of both indicators. I believe the code TradingView uses to calculate standard deviation is incorrect (basing this just through visuals). This indicator uses the array.stdev function to find the correct value (verified with Excel numbers).

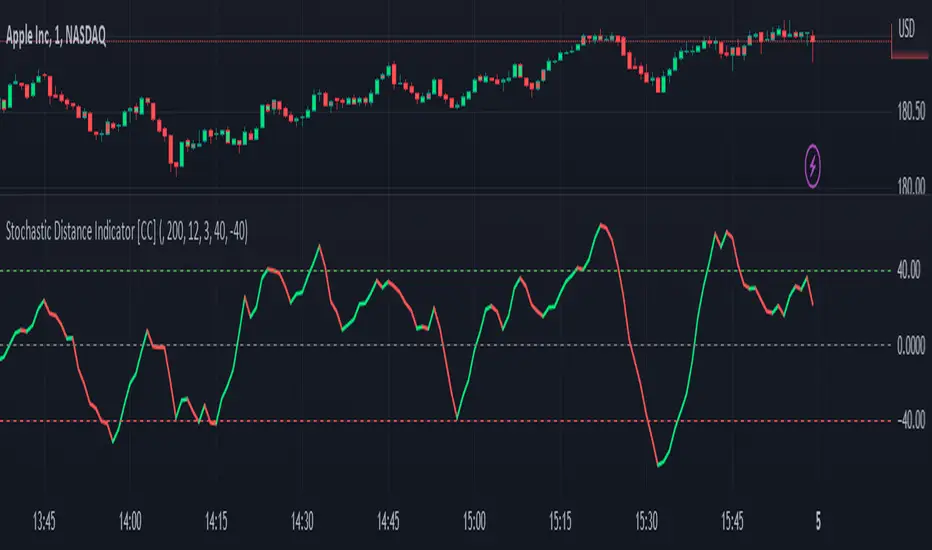
Stochastic Distance Indicator [CC]The Stochastic Distance Indicator was created by Vitali Apirine (Stocks and Commodities Jun 2023 pgs 16-21), and this is a new method that measures the absolute distance between a price and its highest and lowest values over a long period. It uses the stochastic formula to create an oscillator using this distance value and smooths the value. Obviously, there is a lag in signals due to the lookback periods, but it does a good job of staying above the midline when the stock is in a strong uptrend and vice versa. Of course, I'm open to suggestions, but I'm deciding to create buy and sell signals based on comparing the unsmoothed and smoothed values. Buy when the line turns green and sell when it turns red.
Let me know if there are any other indicators you would like to see me publish!
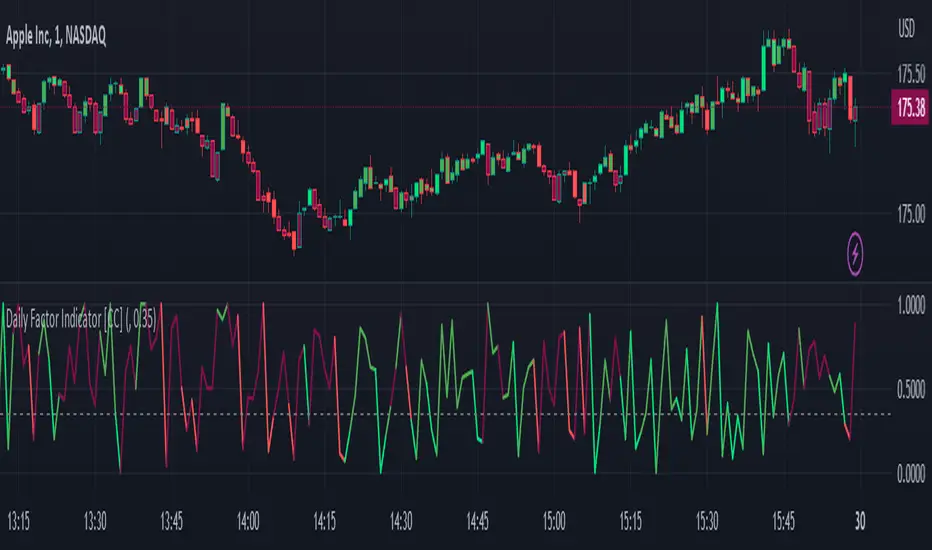
Daily Factor Indicator [CC]The Daily Factor Indicator was created by Andrea Unger (Stocks and Commodities Jun 2023 pgs 26-31), and this is a new volatility indicator that compares the body, which is the absolute difference between the previous open and previous close, and the range which is the difference between the previous high and previous low. The indicator is calculated by dividing the body and range to determine the volatility for the previous bar. This indicator will range between 0 and 1. Values closer to 1 mean very high volatility, and values closer to 0 mean very low volatility. I have introduced a simple moving average strategy to decide buy or sell signals and colors. Darker colors mean the indicator is above the threshold level, and lighter colors mean the indicator is below the threshold level. Colors are shades of green when the price is above the moving average and shades of red when the price is below the moving average. Feel free to try out your own threshold level and general buy and sell signals.
Let me know if there are any other indicators you would like me to publish!
Textmate Language for Pine Script v5 2023-05Updated Syntax Colouring to include UDT and methods and libraries, and a few other extras.
Remember to Update when new built in language features are introduced.
This will not be Maintained frequently, it's an update to present times

Non Adaptive Moving Average - Quan DaoThis Non-Adaptive Moving Average (NAMA) is my origin work. It came from the issues that I always face when using existing famous MA like EMA or RMA:
- What length should I choose for the MA for this security?
- Is there a length that works for multiple timeframes?
- Is there a length that works for multiple securities in multiple markets?
Choosing the right length for an MA is a tedious and boring work and is very subjective. One day in early 2023, I decided to create a new MA that will not be dependant a lot (non-adaptive) on the length of it, to make my life a little bit easier. The idea came from the formula of EMA and RMA:
ma = alpha * src + (1 - alpha) * ma
in which,
alpha = 1 / length for RMA
alpha = 2 / (length + 1) for EMA
I decided to use a constant alpha for the formula, which happened to be: 1.618 / 100 (i.e., golden ratio / 100)
This NAMA is using the length in the start only, after running for a while the MA value will be the same for every value of its length, which resolves good my 3 questions above.
The application of this NAMA is wide, I think.
- It can be used like a normal MA but you don't have to choose its length anymore.
- It can be used like EMA in DEMA, TEMA (I called it DNAMA, TNAMA)
- It can be used in calculating some famous indicators (RSI, TR, ...) so that these indicators will not be dependant on the length as well
In this example script, I included an EMA (in blue color) as well so that you can see how the EMA changes and NAMA stays the same when changing the value of its Length.

Slight Swing Momentum Strategy.Introduction:
The Swing Momentum Strategy is a quantitative trading strategy designed to capture mid-term opportunities in the financial markets by combining swing trading principles with momentum indicators. It utilizes a combination of technical indicators, including moving averages, crossover signals, and volume analysis, to generate buy and sell signals. The strategy aims to identify market trends and capitalize on price momentum for profit generation.
Highlights:
The strategy offers several key highlights that make it unique and potentially attractive to traders:
Swing Trading with Momentum: The strategy combines the principles of swing trading, which aim to capture short-to-medium-term price swings, with momentum indicators that help identify strong price trends and potential breakout opportunities.
Technical Indicator Optimization: The strategy utilizes a selection of optimized technical indicators, including moving averages and crossover signals, to filter out the noise and focus on high-probability trading setups. This optimization enhances the strategy's ability to identify favourable entry and exit points.
Risk Management: The strategy incorporates risk management techniques, such as position sizing based on equity and dynamic stop loss levels, to manage risk exposure and protect capital. This helps to minimize drawdowns and preserve profits.
Buy Condition:
The buy condition in the strategy is determined by a combination of factors, including A1, A2, A3, XG, and weeklySlope. Let's break it down:
A1 Condition: The A1 condition checks for specific price relationships. It verifies that the ratio of the highest price to the closing price is less than 1.03, the ratio of the opening price to the lowest price is less than 1.03, and the ratio of the highest price to the previous day's closing price is greater than 1.06. This condition looks for a specific pattern indicating potential bullish momentum.
A2 Condition: The A2 condition checks for price relationships related to the closing price. It verifies that the ratio of the closing price to the opening price is greater than 1.05 or that the ratio of the closing price to the previous day's closing price is greater than 1.05. This condition looks for signs of upward price movement and momentum.
A3 Condition: The A3 condition focuses on volume. It checks if the current volume crosses above the highest volume over the last 60 periods. This condition aims to identify increased buying interest and potentially confirms the strength of the potential upward price movement.
XG Condition: The XG condition combines the A1 and A2 conditions and checks if they are true for both the current and previous bars. It also verifies that the ratio of the closing price to the 5-period EMA crosses above the 9-period SMA of the same ratio. This condition helps identify potential buy signals when multiple factors align, indicating a strong bullish momentum and potential entry point.
Weekly Trend Factor: The weekly slope condition calculates the slope of the 50-period SMA over a weekly timeframe. It checks if the slope is positive, indicating an overall upward trend on a weekly basis. This condition provides additional confirmation that the stock is in an upward trend.
When all of these conditions align, the buy condition is triggered, indicating a favourable time to enter a long position.
Sell Condition:
The sell condition is relatively straightforward in the strategy:
Sell Signal: The sell condition simply checks if the closing price crosses below the 10-period EMA. When this condition is met, it indicates a potential reversal or weakening of the upward price momentum, and a sell signal is generated.
Backtest Outcome:
The strategy was backtested over the period from January 22nd, 1999 to May 3rd, 2023, using daily candlestick charts for the NASDAQ: NVDA. The strategy used an initial capital of 1,000,000 USD, The order quantity is defined as 10% of the equity. The strategy allows for pyramiding with 1 order, and the transaction fee is set at 0.03% per trade. Here are the key outcomes of the backtest:
Net Profit: 539,595.84 USD, representing a return of 53.96%.
Percent Profitable: 48.82%
Total Closed Trades: 127
Profit Factor: 2.331
Max Drawdown: 68,422.70 USD
Average Trade: 4,248.79 USD
Average Number of Bars in Trades: 11, indicating the average duration of the trades.
Conclusion:
In conclusion, the Swing Momentum Strategy is a quantitative trading approach that combines swing trading principles with momentum indicators to identify and capture mid term trading opportunities. The strategy has demonstrated promising results during backtesting, including a significant net profit and a favourable profit factor.

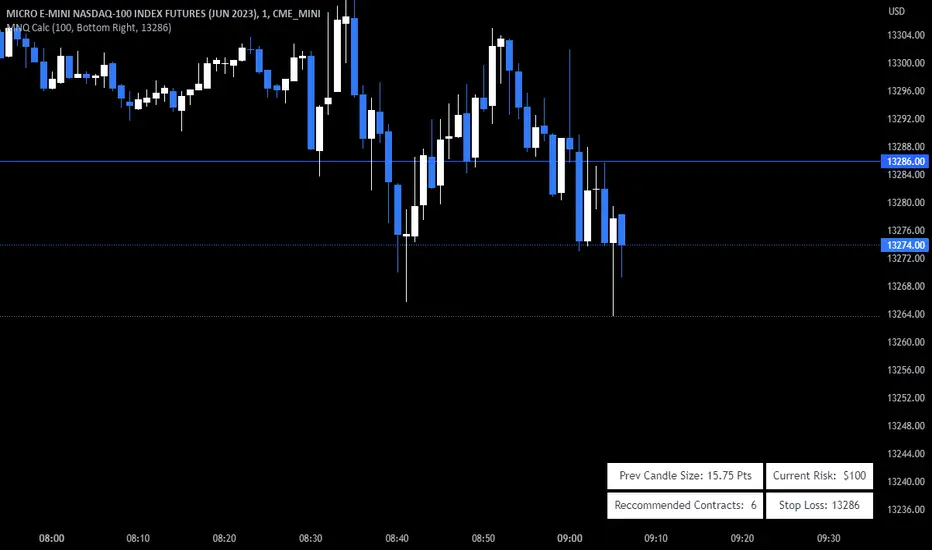
[5-2-2023] MNQ CALCMNQ Calcultor that takes your stop loss and the prev candles close and shows you how much contracts you can enter for the amount that you're risking.
Optimized Zhaocaijinbao strategyIntroduction:
The Optimized Zhaocaijinbao strategy is a mid and long-term quantitative trading strategy that combines momentum and trend factors. It generates buy and sell signals by using a combination of exponential moving averages, moving averages, volume and slope indicators. It generates buy signals when the stock is above the 35-day moving average, the trading volume is higher than the 20-day moving average, and the stock is in an upward trend on a weekly timeframe."招财进宝" is a Chinese phrase that can be translated to "Attract Wealth and Bring in Treasure" in English. It is a common expression used to wish for good luck and prosperity in various contexts, such as in business or personal finances.
Highlights:
The strategy has several special optimizations that make it unique.
Firstly, the strategy is optimized for T+1 trading in the Chinese stock market and is only suitable for long positions. The optimizations are also applicable to international stock markets.
Secondly, the trend strategy is optimized to only show indicators on the right side and oscillations. This helps to prevent false signals in choppy markets.
Thirdly, the strategy uses a risk factor for dynamic position sizing to ensure position sizes are adjusted according to the current net asset value and risk preferences. This helps to lower drawdown risks.
The strategy has good resilience even without using stop loss modules in backtesting, making it suitable for trading hourly, 2-hourly, and daily K-line charts (depending on the stock being traded). We recommend experimenting with backtesting using SSE 1-hour or 2-hour or daily Kline charts.
Backtesting outcomes:
The strategy was backtested over the period from October 13th, 2005 to April 14th, 2023, using daily candlestick charts for the commodity code SSE:600763, with a currency of CNY and tick size of 0.01. The strategy used an initial capital of 1,000,000 CNY, with order sizes set to 10% equity and a pyramid of 1 order. The strategy also had a Max Position Size of 0.01 and a Risk Factor of 2.
Here is a summary of the performance of the trading strategy:
Total net profit: 288,577.32 CNY, representing a return of 128.86%
Total number of closed trades: 61
Winning trades: 37, representing a win rate of 60.66%
Profit factor: 2.415
Largest losing trade: 222,021.46 CNY, representing a loss of 14.08%
Average trade: 21,124.22 CNY, representing a return of 3.1%
Average holding period for all trades: 12 days
Conclusion:
In conclusion, the Optimized Zhaocaijinbao strategy is a mid and long-term quantitative trading strategy that combines momentum and trend factors. It is suitable for both Chinese stocks and global stocks. While the Optimized Zhaocaijinbao strategy has performed well in backtesting, it is important to note that past performance is not a guarantee of future results. Traders should conduct their own research and analysis and exercise caution when using any trading strategy.

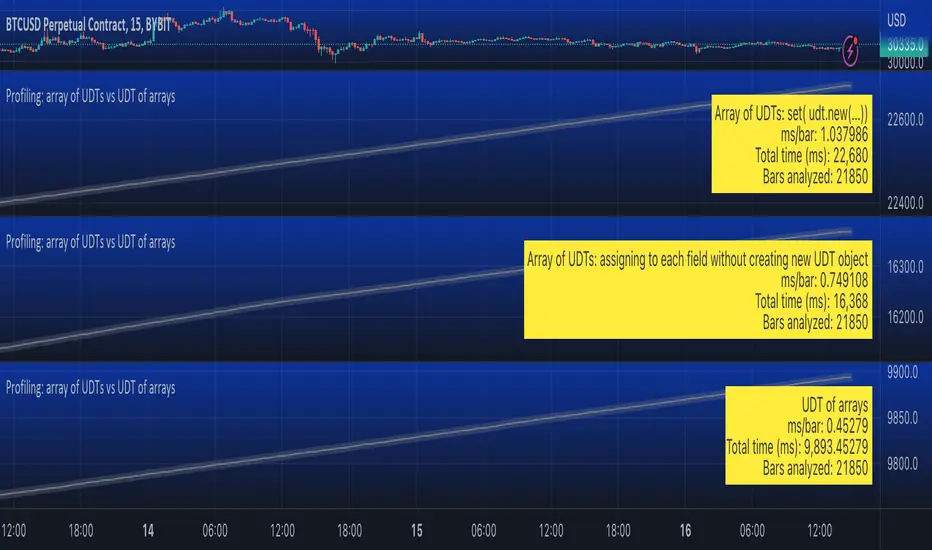
Profiling: array of UDTs vs UDT of arraysUsing Stopwatch Library by PineCoders, I am trying to test which is faster, an array of user-defined type (UDT) objects vs an object with many child arrays.
The task is to store and manipulate array of objects having total 9 values: 4 floats, 4 strings and 1 int.
Option 1: create a UDT with 9 fields and store an array of such UDT objects.
Option 2: create a UDT with 9 arrays individually for each value.
The test task is of three stages:
Populate array(s) with some (timenow) values - in the options you can choose how many values to push into the array/arrays. Note that max size of array(s) is set independently, so you can push 1000 of elements into an array capped at 100 max size and as new elements will be pushed (added to the end) the old exceeding elements will be shifted (removed from the beginning)
Write - write to random elements of the array. Two options for writing to a UDT object: (1) assign to each field independently, (2) create a UDT object and use array.set() function.
Read - read from random elements of the array.
In the options you can how many times per bar to run each of the steps (same number for each step).
I tested by adding three indicators to the chart and choosing different options for each:
1. Array of UDT's where writing is done by creating a new UDT from the values and then using set(udt)
2. Array of UDT's where writing is done by assigning the value of each of the properties of the UDT individually (saving time on creating of a new object).
3. UDT of arrays.
As of 16 Arpil 2023 the UDT of arrays seems about 20-30% faster than the array of UDT's with setting each property without creating new UDT object.
Lorentzian Classification Strategy Based in the model of Machine learning: Lorentzian Classification by @jdehorty, you will be able to get into trending moves and get interesting entries in the market with this strategy. I also put some new features for better backtesting results!
Backtesting context: 2022-07-19 to 2023-04-14 of US500 1H by PEPPERSTONE. Commissions: 0.03% for each entry, 0.03% for each exit. Risk per trade: 2.5% of the total account
For this strategy, 3 indicators are used:
Machine learning: Lorentzian Classification by @jdehorty
One Ema of 200 periods for identifying the trend
Supertrend indicator as a filter for some exits
Atr stop loss from Gatherio
Trade conditions:
For longs:
Close price is above 200 Ema
Lorentzian Classification indicates a buying signal
This gives us our long signal. Stop loss will be determined by atr stop loss (white point), break even(blue point) by a risk/reward ratio of 1:1 and take profit of 3:1 where half position will be closed. This will be showed as buy.
The other half will be closed when the model indicates a selling signal or Supertrend indicator gives a bearish signal. This will be showed as cl buy.
For shorts:
Close price is under 200 Ema
Lorentzian Classification indicates a selling signal
This gives us our short signal. Stop loss will be determined by atr stop loss (white point), break even(blue point) by a risk/reward ratio of 1:1 and take profit of 3:1 where half position will be closed. This will be showed as sell.
The other half will be closed when the model indicates a buying signal or Supertrend indicator gives a bullish signal. This will be showed as cl sell.
Risk management
To calculate the amount of the position you will use just a small percent of your initial capital for the strategy and you will use the atr stop loss or last swing for this.
Example: You have 1000 usd and you just want to risk 2,5% of your account, there is a buy signal at price of 4,000 usd. The stop loss price from atr stop loss or last swing is 3,900. You calculate the distance in percent between 4,000 and 3,900. In this case, that distance would be of 2.50%. Then, you calculate your position by this way: (initial or current capital * risk per trade of your account) / (stop loss distance).
Using these values on the formula: (1000*2,5%)/(2,5%) = 1000usd. It means, you have to use 1000 usd for risking 2.5% of your account.
We will use this risk management for applying compound interest.
> In settings, with position amount calculator, you can enter the amount in usd of your account and the amount in percentage for risking per trade of the account. You will see this value in green color in the upper left corner that shows the amount in usd to use for risking the specific percentage of your account.
> You can also choose a fixed amount, so you will have to activate fixed amount in risk management for trades and set the fixed amount for backtesting.
Script functions
Inside of settings, you will find some utilities for display atr stop loss, break evens, positions, signals, indicators, a table of some stats from backtesting, etc.
You will find the settings for risk management at the end of the script if you want to change something or trying new values for other assets for backtesting.
If you want to change the initial capital for backtest the strategy, go to properties, and also enter the commisions of your exchange and slippage for more realistic results.
In risk managment you can find an option called "Use leverage ?", activate this if you want to backtest using leverage, which means that in case of not having enough money for risking the % determined by you of your account using your initial capital, you will use leverage for using the enough amount for risking that % of your acount in a buy position. Otherwise, the amount will be limited by your initial/current capital
I also added a function for backtesting if you had added or withdrawn money frequently:
Adding money: You can choose how often you want to add money (Monthly, yearly, daily or weekly). Then a fixed amount of money and activate or deactivate this function
Withdraw money: You can choose if you want to withdraw a fixed amount or a percentage of earnings. Then you can choose a fixed amount of money, the period of time and activate or deactivate this function. Also, the percentage of earnings if you choosed this option.
Some other assets where strategy has worked
BTCUSD 4H, 1D
ETHUSD 4H, 1D
BNBUSD 4H
SPX 1D
BANKNIFTY 4H, 15 min
Some things to consider
USE UNDER YOUR OWN RISK. PAST RESULTS DO NOT REPRESENT THE FUTURE.
DEPENDING OF % ACCOUNT RISK PER TRADE, YOU COULD REQUIRE LEVERAGE FOR OPEN SOME POSITIONS, SO PLEASE, BE CAREFULL AND USE CORRECTLY THE RISK MANAGEMENT
Do not forget to change commissions and other parameters related with back testing results!. If you have problems loading the script reduce max bars back number in general settings
Strategies for trending markets use to have more looses than wins and it takes a long time to get profits, so do not forget to be patient and consistent !
Please, visit the post from @jdehorty called Machine Learning: Lorentzian Classification for a better understanding of his script!
Any support and boosts will be well received. If you have any question, do not doubt to ask!
