10MAs + BB10 MAs riboon + Bollinger Bands
I used two basic Multiple MA ribbons. so I just merge them to one indicaotor
"弘历投教boll指标代码分析" için komut dosyalarını ara

FlowSpike ES — BB • RSI • VWAP + AVWAP + News MuteThis indicator is purpose-built for E-mini S&P 500 (ES) futures traders, combining volatility bands, momentum filters, and session-anchored levels into a streamlined tool for intraday execution.
Key Features:
• ES-Tuned Presets
Automatically optimized settings for scalping (1–2m), daytrading (5m), and swing trading (15–60m) timeframes.
• Bollinger Band & RSI Signals
Entry signals trigger only at statistically significant extremes, with RSI filters to reduce false moves.
• VWAP & Anchored VWAPs
Session VWAP plus anchored VWAPs (RTH open, weekly, monthly, and custom) provide high-confidence reference levels used by professional order-flow traders.
• Volatility Filter (ATR in ticks)
Ensures signals are only shown when the ES is moving enough to offer tradable edges.
• News-Time Mute
Suppresses signals around scheduled economic releases (customizable windows in ET), helping traders avoid whipsaw conditions.
• Clean Alerts
Long/short alerts are generated only when all conditions align, with optional bar-close confirmation.
Why It’s Tailored for ES Futures:
• Designed around ES tick size (0.25) and volatility structure.
• Session settings respect RTH hours (09:30–16:00 ET), the period where most liquidity and institutional flows concentrate.
• ATR thresholds and RSI bands are pre-tuned for ES market behavior, reducing the need for manual optimization.
⸻
This is not a generic indicator—it’s a futures-focused tool created to align with the way ES trades day after day. Whether you scalp the open, manage intraday swings, or align to weekly/monthly anchored flows, FlowSpike ES gives you a clear, rules-based signal framework.

EMA Envelope + SMA + Purple DotThis indicator combines three tools into one:
📈 EMA Envelope with wedge and range contraction signals to highlight volatility squeezes.
🔵 SMA with optional smoothing (SMA/EMA/WMA/SMMA/VWMA) and optional Bollinger Bands.
🟣 Purple Dot “PowerBars” that mark strong momentum bars when price ROC (%) and volume exceed user-defined thresholds.
It also includes:
Background highlighting of contraction zones (bullish/bearish/neutral colors).
A summary table showing PowerBar count and return (%) over custom lookback periods.
Flexible display settings (table position, dark/light theme, highlight toggle).
Designed for traders who want to track momentum bursts, volatility contraction, and trend strength all in one tool.

Faytterro Bands Breakout📌 Faytterro Bands Breakout 📌
This indicator was created as a strategy showcase for another script: Faytterro Bands
It’s meant to demonstrate a simple breakout strategy based on Faytterro Bands logic and includes performance tracking.
❓ What Is It?
This script is a visual breakout strategy based on a custom moving average and dynamic deviation bands, similar in concept to Bollinger Bands but with unique smoothing (centered regression) and performance features.
🔍 What Does It Do?
Detects breakouts above or below the Faytterro Band.
Plots visual trade entries and exits.
Labels each trade with percentage return.
Draws profit/loss lines for every trade.
Shows cumulative performance (compounded return).
Displays key metrics in the top-right corner:
Total Return
Win Rate
Total Trades
Number of Wins / Losses
🛠 How Does It Work?
Bullish Breakout: When price crosses above the upper band and stays above the midline.
Bearish Breakout: When price crosses below the lower band and stays below the midline.
Each trade is held until breakout invalidation, not a fixed TP/SL.
Trades are compounded, i.e., profits stack up realistically over time.
📈 Best Use Cases:
For traders who want to experiment with breakout strategies.
For visual learners who want to study past breakouts with performance metrics.
As a template to develop your own logic on top of Faytterro Bands.
⚠ Notes:
This is a strategy-like visual indicator, not an automated backtest.
It doesn't use strategy.* commands, so you can still use alerts and visuals.
You can tweak the logic to create your own backtest-ready strategy.
Unlike the original Faytterro Bands, this script does not repaint and is fully stable on closed candles.

VWAP %BVWAP %B - Volume Weighted Average Price Percent B
The VWAP %B indicator combines the reliability of VWAP (Volume Weighted Average Price) with the analytical power of %B oscillators, similar to Bollinger Bands %B but using volume-weighted statistics.
## How It Works
This indicator calculates where the current price sits relative to VWAP-based standard deviation bands, expressed as a percentage from 0 to 1:
• **VWAP Calculation**: Uses volume-weighted average price as the center line
• **Standard Deviation Bands**: Creates upper and lower bands using standard deviation around VWAP
• **%B Formula**: %B = (Price - Lower Band) / (Upper Band - Lower Band)
## Key Levels & Interpretation
• **Above 1.0**: Price is trading above the upper VWAP band (strong bullish momentum)
• **0.8 - 1.0**: Overbought territory, potential resistance
• **0.5**: Price exactly at VWAP (equilibrium)
• **0.2 - 0.0**: Oversold territory, potential support
• **Below 0.0**: Price is trading below the lower VWAP band (strong bearish momentum)
## Trading Applications
**Trend Following**: During strong trends, breaks above 1.0 or below 0.0 often signal continuation rather than reversal.
**Mean Reversion**: In ranging markets, extreme readings (>0.8 or <0.2) may indicate potential reversal points.
**Volume Context**: Unlike traditional %B, this incorporates volume weighting, making it more reliable during high-volume periods.
## Parameters
• **Length (20)**: Period for standard deviation calculation
• **Standard Deviation Multiplier (2.0)**: Controls band width
• **Source (close)**: Price input for calculations
## Visual Features
• Reference lines at key levels (0, 0.2, 0.5, 0.8, 1.0)
• Background highlighting for extreme breaks
• Real-time values table
• Clean oscillator format below price chart
Perfect for intraday traders and swing traders who want to combine volume analysis with momentum oscillators.

5EMA_BB_ScalpingWhat?
In this forum we have earlier published a public scanner called 5EMA BollingerBand Nifty Stock Scanner , which is getting appreciated by the community. That works on top-40 stocks of NSE as a scanner.
Whereas this time, we have come up with the similar concept as a stand-alone indicator which can be applied for any chart, for any timeframe to reap the benifit of reversal trading.
How it works?
This is essentially a reversal/divergence trading strategy, based on a widely used strategy of Power-of-Stocks 5EMA.
To know the divergence from 5-EMA we just check if the high of the candle (on closing) is below the 5-EMA. Then we check if the closing is inside the Bollinger Band (BB). That's a Buy signal. SL: low of the candle, T: middle and higher BB.
Just opposite for selling. 5-EMA low should be above 5-EMA and closing should be inside BB (lesser than BB higher level). That's a Sell signal. SL: high of the candle, T: middle and lower BB.
Along with we compare the current bar's volume with the last-20 bar VWMA (volume weighted moving average) to determine if the volume is high or low.
Present bar's volume is compared with the previous bar's volume to know if it's rising or falling.
VWAP is also determined using `ta.vwap` built-in support of TradingView.
The Bolling Band width is also notified, along with whether it is rising or falling (comparing with previous candle).
What's special?
We love this reversal trading, as it offers many benifits over trend following strategies:
Risk to Reward (RR) is superior.
It _Does Hit_ stop losses, but the stop losses are tiny.
Means, althrough the Profit Factor looks Nahh , however due to superior RR, end of day it ended up in green.
When the day is sideways, it's difficult to trade in trending strategies. This sort of volatility, reversal strategies works better.
It's always tempting to go agaist the wind. Whole world is in Put/PE and you went opposite and enter a Call/CE. And turns out profitable! That's an amazing feeling, as a trader :)
How to trade using this?
* Put any chart
* Apply this screener from Indicators (shortcut to launch indicators is just type / in your keyboard).
* It will show you the Green up arrow when buy alert comes or red down arrow when sell comes. * Also on the top right it will show the latest signal with entry, SL and target.
Disclaimer
* This piece of software does not come up with any warrantee or any rights of not changing it over the future course of time.
* We are not responsible for any trading/investment decision you are taking out of the outcome of this indicator.

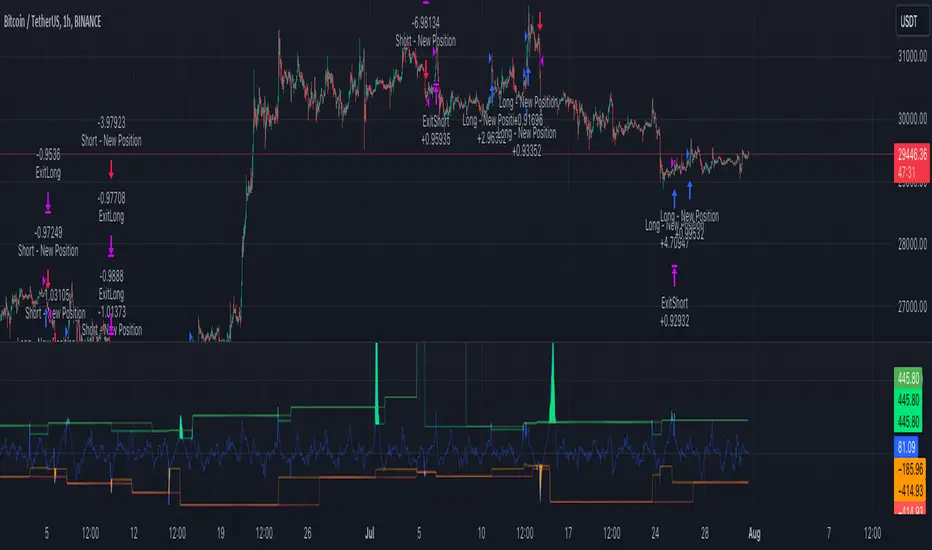
External Signals Strategy Tester v5External Signals Strategy Tester v5 – User Guide (English)
1. Purpose
This Pine Script strategy is a universal back‑tester that lets you plug in any external buy/sell series (for example, another indicator, webhook feed, or higher‑time‑frame condition) and evaluate a rich set of money‑management rules around it – with a single click on/off workflow for every module.
2. Core Workflow
Feed signals
Buy Signal / Sell Signal inputs accept any series (price, boolean, output of request.security(), etc.).
A crossover above 0 is treated as “signal fired”.
Date filter
Start Date / End Date restricts the test window so you can exclude unwanted history.
Trade engine
Optional Long / Short enable toggles.
Choose whether opposite signals simply close the trade or reverse it (flip direction in one transaction).
Risk modules – all opt‑in via check‑boxes
Classic % block – fixed % Take‑Profit / Stop‑Loss / Break‑Even.
Fibonacci Bollinger Bands (FBB) module
Draws dynamic VWMA/HMA/SMA/EMA/DEMA/TEMA mid‑line with ATR‑scaled Fibonacci envelopes.
Every line can be used for stops, trailing, or multi‑target exits.
Separate LONG and SHORT sub‑modules
Each has its own SL plus three Take‑Profits (TP1‑TP3).
Per TP you set line, position‑percentage to close, and an optional trailing flag.
Executed TP/SLs deactivate themselves so they cannot refire.
Trailing behaviour
If Trail is checked, the selected line is re‑evaluated once per bar; the order is amended via strategy.exit().
3. Inputs Overview
Group Parameter Notes
Trade Settings Enable Long / Enable Short Master switches
Close on Opposite / Reverse Position How to react to a counter‑signal
Risk % Use TP / SL / BE + their % Traditional fixed‑distance management
Fibo Bands FIBO LEVELS ENABLE + visual style/length Turn indicator overlay on/off
FBB LONG SL / TP1‑TP3 Enable, Line, %, Trail Rules applied only while a long is open
FBB SHORT SL / TP1‑TP3 Enable, Line, %, Trail Rules applied only while a short is open
Line choices: Basis, 0.236, 0.382, 0.5, 0.618, 0.764, 1.0 – long rules use lower bands, short rules use upper bands automatically.
4. Algorithm Details
Position open
On the very first bar after entry, the script checks the direction and activates the corresponding LONG or SHORT module, deactivating the other.
Order management loop (every bar)
FBB Stop‑Loss: placed/updated at chosen band; if trailing, follows the new value.
TP1‑TP3: each active target updates its limit price to the selected band (or holds static if trailing is off).
The classic % block runs in parallel; its exits have priority because they call strategy.close_all().
Exit handling
When any strategy.exit() fires, the script reads exit_id and flips the *_Active flag so that order will not be recreated.
A Stop‑Loss (SL) also disables all remaining TPs for that leg.
5. Typical Use Cases
Scenario Suggested Setup
Scalping longs into VWAP‐reversion Enable LONG TP1 @ 0.382 (30 %), TP2 @ 0.618 (40 %), SL @ 0.236 + trailing
Fade shorts during news spikes Enable SHORT SL @ 1.0 (no trail) and SHORT TP1,2,3 on consecutive lowers with small size‑outs
Classic trend‑follow Use only classic % TP/SL block and disable FBB modules
6. Hints & Tips
Signal quality matters – this script manages exits, it does not generate entries.
Keep TV time zone in mind when picking start/end dates.
For portfolio‑style testing allocate smaller default_qty_value than 100 % or use strategy.percent_of_equity sizing.
You can combine FBB exits with fixed‑% ones for layered management.
7. Limitations / Safety
No pyramiding; the script holds max one position at a time.
All calculations are bar‑close; intra‑bar touches may differ from real‑time execution.
The indicator overlay is optional, so you can run visual‑clean tests by unchecking FIBO LEVELS ENABLE.

Visualisation tendancesThis script allows you to visualize the current trend of a financial asset.
It has two colors:
- Green for bullish phases
- Red for bearish phases
This allows you to instantly position yourself in the direction of the trend.
It also integrates Bollinger Bands, a volatility indicator.
This allows you to display two different indicators in a single indicator.

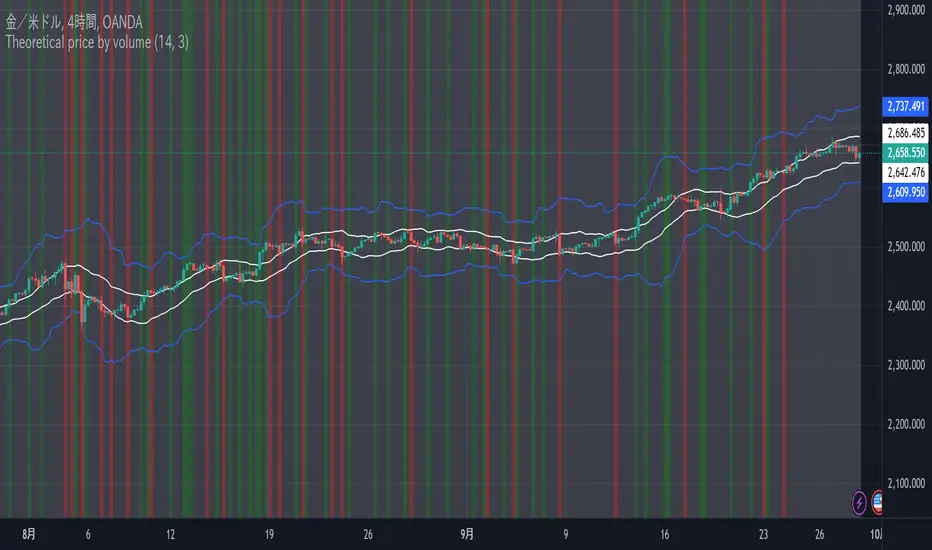
Theoretical price by volumeThis code is used to calculate a theoretical price range based on volume and price change and display it on the chart. Specifically, it calculates the “theoretical price volatility” based on price changes and volume, from which the upper and lower price limits are derived.
The price volatility is calculated by dividing the price change by the volume as the change unit volume.
Based on this volatility, we calculate the theoretical variation relative to the current price (“Theoretical Variance Difference”).
Based on the results, **Theoretical High Price (p_price) and Theoretical Low Price (m_price)** are calculated.
The chart displays the upper and lower bounds of these theoretical prices in color, and also calculates their mean and standard deviation (in the form of a Bollinger band) and plots them.
The background color on the chart indicates whether the price is within the theoretical price range, and at the same time, the mean and standard deviation of the theoretical prices are used to visualize price movements in more detail.
This indicator helps traders understand the impact of volume on price movements and helps them determine if prices are staying within the theoretical range or if there are unusual movements.
BB + Volume Based Coloured BarsVolume Based Coloured Bars:
Most of the time traders are confused about if the price movements were supported by VOLUME .
This indicator colors the bars into volume weighted signals...
When prices go down bars are red and contraversely when up, bars are green. Additionally we have two more colors for each
situation:
PRICE BARS ARE:
DARK RED when prices go down and VOLUME is bigger than 150% of its (default 21 day) average, that indicates us price action is supported by a strong BEARISH VOLUME
RED when prices go down and VOLUME is BETWEEN 50% AND 150% of its (default 21 day) average, at this situation we can think that volume is neither strong nor weak
ORANGE when prices go down and VOLUME is just less than 50% of its (default 21 day) average, so the volume is weak and doesn't support the price action much
DARK GREEN when prices go UP and VOLUME bigger than 150% of its (default 21 day) average, that indicates us price action is supported by a strong BULLISH VOLUME
GREEN when prices go UP and VOLUME is BETWEEN 50% AND 150% of its (default 21 day) average, at this situation we can think that volume is neither strong nor weak
LIGHT GREEN when prices go UP and VOLUME is just less than 50% of its (default 21 day) average, so the volume is weak and doesn't support the price action much
21 day Simple Moving Average used as default value which can be changed in the settings menu,
21 day is considered as a month for STOCK Markets, it would be more accurate to set the value to 30 for CRYPTO CURRENCIES
And Bollinger bands
By Kıvanc Özbilgic thank you

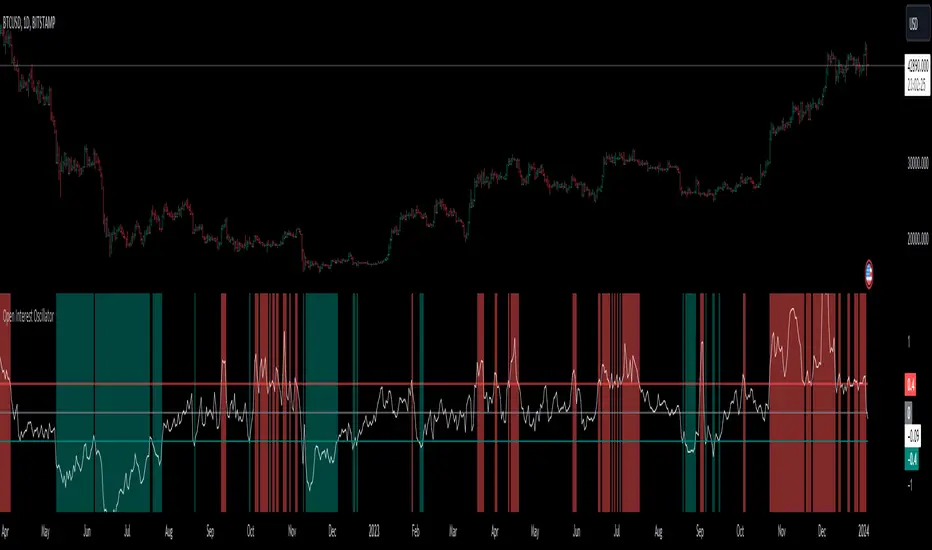
Open Interest OscillatorIn the middle of a bustling cryptocurrency market, with Bitcoin navigating a critical phase and the community hype over potential ETF approvals, current funding rates, and market leverage, the timing is optimal to harness the capabilities of sophisticated trading tools.
Meet the Open Interest Oscillator – special indicator tailored for the volatile arena of cryptocurrency trading. This powerful instrument is adept at consolidating open interest data from a multitude of exchanges, delivering an in-depth snapshot of market sentiment across all timeframes, be it a 1-minute sprint or a weekly timeframe.
This versatile indicator is compatible with nearly all cryptocurrency pairs, offering an expansive lens through which traders can gauge the market's pulse.
Key Features:
-- Multi-exchange Data Aggregation: This feature taps into the heart of the crypto market by aggregating open interest data from premier exchanges such as BINANCE, BITMEX, BITFINEX, and KRAKEN. It goes a step further by integrating data from various pairs and stablecoins, thus providing traders with a rich, multi-dimensional view of market activities.
-- Open Interest Bars: Witness the flow of market dynamics through bars that depict the volume of positions being opened or closed, offering a clear visual cue of trading behavior. In this mode, If bars are going into negative zone, then traders are closing their positions. If they go into positive territory - leveraged positions are being opened.
-- Bollinger Band Integration: Incorporate a layer of statistical analysis with standard deviation calculations, which frame the open interest changes, giving traders a quantified edge to evaluate the market's volatility and momentum.
-- Oscillator with Customizable Thresholds: Personalize your trading signals by setting thresholds that resonate with your unique trading tactics. This customization brings the power of tailored analytics to your strategic arsenal.
-- Max OI Ceiling Setting: In the fast-paced crypto environment where data can surge to overwhelming levels, the Max OI Ceiling ensures you maintain a clear view by capping the open interest data, thus preserving the readability and interpretability of information, even when market activity reaches feverish heights.
Universal Volatility IndexThe Universal Volatility Index (UVI) is a robust indicator designed to gauge market volatility across various asset classes. By synthesizing multiple volatility measures, the UVI offers traders a nuanced understanding of market dynamics, aiding in the assessment of risk and the decision-making process.
How It Works:
The UVI incorporates three key components to calculate a composite volatility score:
Average True Range (ATR): This represents the average volatility over the specified period, giving a base measure of market movement.
Bollinger Bands Width: Highlights the expansion or contraction of price ranges, offering insights into market volatility relative to recent price action.
Rate of Change (ROC): Captures the momentum or the velocity of price changes, adding a temporal dimension to volatility assessment.
By combining these components, the UVI delivers a singular volatility metric that adapts to changing market conditions, providing a valuable tool for traders in any market.
Usage:
To apply the UVI to your chart, add the indicator from the Pine Script library and adjust the input parameters as desired.
The plot will display a line representing the composite volatility score, with higher values indicating increased market volatility and lower values suggesting calmer market conditions.
Benefits:
The UVI is versatile and can be applied to any market, making it a universal tool for traders.
The indicator helps in identifying periods of high risk where tighter risk management may be warranted.
It assists in pinpointing potential breakouts when volatility is expanding after a period of consolidation.
Compliance with TradingView House Rules:
This script is provided for educational purposes and does not constitute financial advice. It has been created to contribute to the TradingView community by offering a versatile tool that helps traders understand and navigate market volatility.

PercentX Trend Follower [Trendoscope]"Trendoscope" was born from our trading journey, where we first delved into the world of trend-following methods. Over time, we discovered the captivating allure of pattern analysis and the exciting challenges it presented, drawing us into exploring new horizons. However, our dedication to trend-following methodologies remains steadfast and continues to be an integral part of our core philosophy.
Here we are, introducing another effective trend-following methodology, employing straightforward yet powerful techniques.
🎲 Concepts
Introducing the innovative PercentX Oscillator , a representation of Bollinger PercentB and Keltner Percent K. This powerful tool offers users the flexibility to customize their PercentK oscillator, including options for the type of moving average and length.
The Oscillator Range is derived dynamically, utilizing two lengths - inner and outer. The inner length initiates the calculation of the oscillator's highest and lowest range, while the outer length is used for further calculations, involving either a moving average or the opposite side of the highest/lowest range, to obtain the oscillator ranges.
Next, the Oscillator Boundaries are derived by applying another round of high/low or moving average calculations on the oscillator range values.
Breakouts occur when the close price crosses above the upper boundary or below the lower boundary, signaling potential trading opportunities.
🎲 How to trade a breakout?
To reduce false signals, we employ a simple yet effective approach. Instead of executing market trades, we use stop orders on both sides at a certain distance from the current close price.
In case of an upper side breakout, a long stop order is placed at 1XATR above the close, and a short stop order is placed at 2XATR below the close. Conversely, for a lower side breakout, a short stop order is placed at 1XATR below the close, and a long stop order is placed at 2XATR above the ATR. As a trend following method, our first inclination is to trade on the side of breakout and not to find the reversals. Hence, higher multiplier is used for the direction opposite to the breakout.
The script provides users with the option to specify ATR multipliers for both sides.
Once a trade is initiated, the opposite side of the trade is converted into a stop-loss order. In the event of a breakout, the script will either place new long and short stop orders (if no existing trade is present) or update the stop-loss orders if a trade is currently running.
As a trend-following strategy, this script does not rely on specific targets or target levels. The objective is to run the trade as long as possible to generate profits. The trade is only stopped when the stop-loss is triggered, which is updated with every breakout to secure potential gains and minimize risks.
🎲 Default trade parameters
Script uses 10% equity per trade and up to 4 pyramid orders. Hence, the maximum invested amount at a time is 40% of the equity. Due to this, the comparison between buy and hold does not show a clear picture for the trade.
Feel free to explore and optimize the parameters further for your favorite symbols.
🎲 Visual representation
The blue line represents the PercentX Oscillator, orange and lime colored lines represent oscillator ranges. And red/green lines represent oscillator boundaries. Oscillator spikes upon breakout are highlighted with color fills.
Trend IndicatorThis indicator has different features:
1. Ichimoku = this indicator can plot Ichimoku calculated both in the common formula and with the volume average, you can choose the calculator method for each line.
2. Channel and Bands = this mode allows the user to choose from channel and band, "channel" shows the Keltner channel, and "band" shows the Bollinger bands. Both the indicators are calculated including the volume in the formula of the average midpoint.
3. Color candle = this function allows the user to see two different colors of candles on the chart, the positive color occurs when both the long-term average and the short team average of price calculated using the volume is above the two averages calculated without the volume. This function is great to analyze the volume pressure, useful to identify trend continuation and exhaustion.
4. Extreme reversal zones = this is a version of the Keltner channels calculated over a high number of candles and with high deviation, to identify the potential zones of reversal.
Note that in the "Ichimoku" indicator, the backline is the T.R.A.M.A. indicator, created and published open source by Lux Algo, which I thank for the script.

Weighted Deviation Bands [Loxx]What are Weighted Deviation Bands?
Variation of the Bollinger bands but it uses linear weighted average and weighted deviation via Mladen Rakic.
What is Weighted Deviation?
This weighted deviation is a sort of all linear weighted deviation. It uses linear weighting in all the steps calculated (which makes it different from the built in deviation in a case when linear weighted ma is used in the ma method). It is more responsive than the standard deviation
Included
Bar coloring

Fibonacci Bollinger Bands (FBB)The Fibonacci Moving Average (FMA) is an indicator for financial markets that is calculated using the Fibonacci sequence and the metallic mean. The metallic mean is a type of average that is calculated by adding the source and the square root of the sum of the square of the source and 4, and then dividing the result by 2. The FMA is then calculated by using the metallic mean of the source as the weight for each period in the given length, and summing these weighted values. The standard deviation of the metallic mean of the source is also calculated using the FMA over the given length.
Users can input the source data and the length for the FMA calculation, as well as a series of boolean values to determine which levels of the FMA to plot on the chart. The levels include the standard deviation of the metallic mean of the source, as well as various multiples of the Fibonacci ratios between 0 and 2.618. The resulting FMA and standard deviation values can be plotted on the chart to help traders identify trends and potential entry and exit points in the market.

QQE Student's T-Distribution Bollinger Bands Oscillator Credit to all of the developers on this project (aka all of the places I got the code from lol) @eylwithsteph @storma @Fractured @lejmer @AlexGrover @Montyjus @Jiehonglim @StephXAGs @peacefulLizard50262 @gorx1 @above-c-level
This script utilizes @above-c-level 's Student's T-Distribution script to give us a great estimation of volatility. I took this idea and apply it to the QQE filter! That being said I have added a boat load of features as to make this script as useful to as many people as possible. This is the Osc version
Included averages: 'TMA', 'ALMA', 'EMA', 'DEMA', 'TEMA', 'WMA', 'VWMA', 'SMA', 'SMMA', 'HMA', 'LSMA', 'JMA', 'VAMA', 'FRAMA', 'ZLEMA', 'KAMA', 'IDWMA', 'FLMSA', 'PEMA', 'HCF', 'TIF', 'MF', 'ARMA', 'DAF', 'WRMA', 'RMA', 'RAF', 'A2RMA', 'QQE 1', 'QQE 2','Centroid',"Harmonic Mean","Geometric Mean","Quadratic Mean","Median","Trimean","Midhinge","Midrange","VWAP"
Included Features: Smoothing, Additional Moving Average, Log Space, Mean Momentum via Derivative, Normalization, Convergence DIvergence, Candle View
Use this just like macd/rsi but instead this directly reflects the band version! It also shows really valid support and resistance. Use this in combination with the band version for more power.

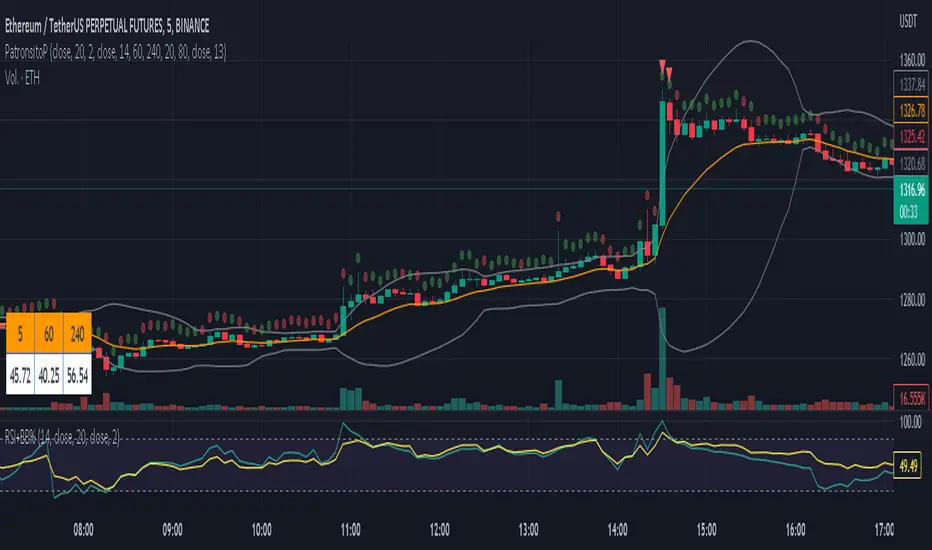
PatronsitoPIndicator for the "Patrón Poderoso" strategy.
This strategy is based on Bollinger Bands and RSI and try to determine overbought or oversold zones where you can trade. Both indicators are combined to provide a stronger signal.
By default, it is considered an overbought zone when price is over BB upper and RSI above 80. That would be a short signal. Price below BB lower and RSI below 20 means an oversold zone and therefore a long signal.
EMA 13 (by default) is included as a guide for exiting the operation.
Alarms for signals in any direction can be used.
Trend #2 - BB+EMAWhat is the Trend #2 - BB+EMA?
This strategy uses a combination of Bollinger Bands and Exponential Moving Averages, and adds the position management skills.
When a position is established, if the price moves in the wrong direction, EMA will move the stop price closer to the opening price, which will reduce losses during the shocks.
If the price moves in the right direction, EMA will be close to the latest price to try to keep the profit.
Once a trend starts to emerge, the strategy is bound to capture the opportunity. I think this is a very smart way to do it.
This strategy performs well in almost all cryptocurrencies, it's mean the strategy has good generalizability.

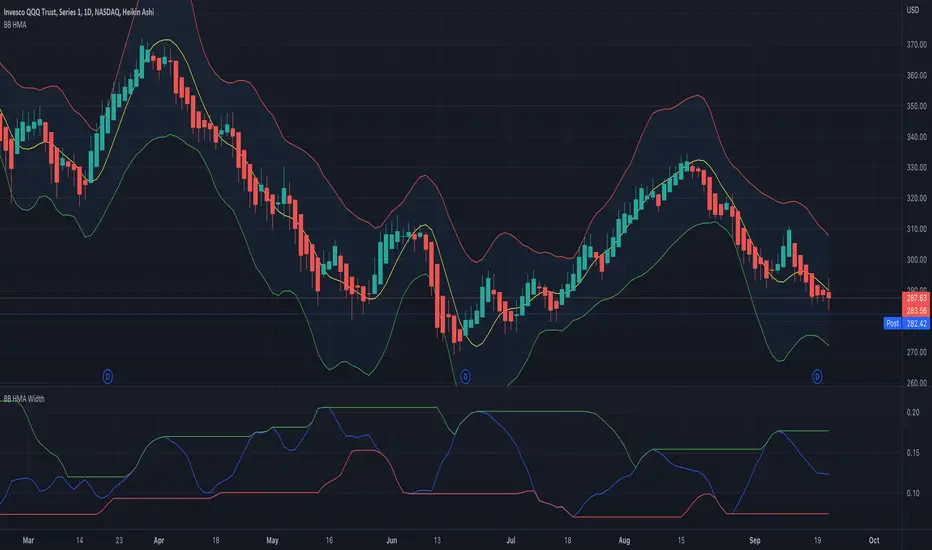
BB HMA WidthThe built-in Bollinger Band Width script modified to use the Hull Moving Average as the basis.
Hull Moving Averages have much less lag than a regular moving average.
Do not assume that regular BB interpretation rules apply to this.
This is an experimental indicator at this time.
IS 200EMABB long buy and sellThis script backtested some stocks, it's giving soft buy and strong buy signals,
I am using Bollinger band and 200 EMA,
Strong Buy :- If price is above 200 ema and cross over 10d ema and sma setup with BB,
Buy :- If price is below 200 ema and cross over 10d ema and sma setup with BB,
Strong Sell :- If price is below 200 ema and cross over ema and sma with input setup for BB
Sell :- If price is above 200 ema and cross over ema and sma with input setup for BB
Don't consider it as buy and sell call, do your own research ,i did it according to my experience and learning.
Thank you

DB KCBB%D Wave SignalsDB KCBB%D Wave Signals
What does the indicator do?
This indicator is a version of my DB KCBB%D indicator updated with signal detection. It results from weeks of analysis of the KCBB%D waves for patterns. I'm releasing it publicly to help those who like the KCBB%D indicator but desire a version with signals built into it.
The indicator plots the percent difference between the low and high prices against a combined Kelpler Channel Bollinger Bands for the current timeframe. The low percent difference and the high percent difference each have their own waves plotted. A mirror mode default allows both waves to be visualized in a mirrored plot that clearly shows when outer bands are present and when they swap. Each percent difference band is displayed with a 1 bar lookback to visualize local tops/bottoms.
The overall trend is displayed using two sets of green/red colors on the percent difference waves so that each wave is recognizable, but the overall price trend is visible. A fast 3 SMA is taken of each percent difference wave to obtain the overall trend and then averaged together. The trend is then calculated based on direction from the previous bar period.
How should this indicator be used?
By default, the indicator will display in a mirror mode which will display both the low and high percent change waves mirrored to allow for the most pattern recognition possible. You will notice the percent difference waves swap from inner to outer, showing the overall market direction for that timeframe. When each percent difference wave interacts with the zero line, it indicates either buys or sells opportunities depending on which band is on the inside. When the inner wave crosses zero, special attention should be paid to the outer wave to know if it's a significant move. Likewise, when the outer wave peaks, it can indicate buy or sell opportunities depending on which wave is on the outside.
A zero line and other lines are displayed from the highest of the high percent difference wave over a long period of time. The lines can measure movement and possible oversold/overbought locations or large volatility . You can also use the lines for crossing points for either wave as alerts to know when to buy or sell zones are happening.
When individual percent difference waves are designed to be reviewed without mirroring, the mirror checkbox can be unchecked in the settings. Doing so will display both the high and low percent difference waves separately. Using this display, you can more cleanly review how each wave interacts with various line levels.
For those who desire to only have half of the mirror or one set of waves inverted against each other, check the "mirrored" and the "mirrored flipped" checkboxes in the settings. Doing so will display the top half of the mirror indicator, which is the low percent difference wave with the high percent difference wave inverted.
The indicator will also change the background color of its own pane to indicate possible buy/sell periods (work in progress).
Does the indicator include any alerts?
Yes, they are a work in progress but starting out with this release, we have:
NOTE: This is an initial release version of this indicator. Please do not use these alerts with bots yet, as they will repaint in real-time.
NOTE: A later release may happen that will delay firing the events until 1/2 of the current bar time has passed.
NOTE: As with any indicator, watch your upper timeframe waves first before zooming into lower.
DB KCBB%D Buy Signal
DB KCBB%D Buy Warning Signal
DB KCBB%D Sell Signal
DB KCBB%D Sell Warning Signal
DB KCBB%D Death Cross Sell Signal
DB KCBB%D Trend Up Alert
DB KCBB%D Trend Down Alert
Use at your own risk and do your own diligence.
Enjoy!

DB KCBB%D WavesDB KCBB%D Waves
What does the indicator do?
The indicator plots the percent difference between the low and high prices against a combined Kelpler Channel Bollinger Bands for the current timeframe. The low percent difference and the high percent difference each have their own waves plotted. A mirror mode default allows both waves to be visualized in a mirrored plot that clearly shows when outer bands are present and when they swap. Each percent difference band is displayed with a 1 bar lookback to visualize local tops/bottoms.
The overall trend is displayed using two sets of green/red colors on the percent difference waves so that each wave is recognizable, but the overall price trend is visible. A fast 3 SMA is taken of each percent difference wave to obtain the overall trend and then averaged together. The trend is then calculated based on direction from the previous bar period.
How should this indicator be used?
By default, the indicator will display in a mirror mode which will display both the low and high percent change waves mirrored to allow for the most pattern recognition possible. You will notice the percent difference waves swap from inner to outer, showing the overall market direction for that timeframe. When each percent difference wave interacts with the zero line, it indicates either buys or sells opportunities depending on which band is on the inside. When the inner wave crosses zero, special attention should be paid to the outer wave to know if it's a significant move. Likewise, when the outer wave peaks, it can indicate buy or sell opportunities depending on which wave is on the outside.
A zero line and other lines are displayed from the highest of the high percent difference wave over a long period of time. The lines can measure movement and possible oversold/overbought locations or large volatility. You can also use the lines for crossing points for either wave as alerts to know when to buy or sell zones are happening.
When individual percent difference waves are designed to be reviewed without mirroring, the mirror checkbox can be unchecked in the settings. Doing so will display both the high and low percent difference waves separately. Using this display, you can more cleanly review how each wave interacts with various line levels.
For those who desire to only have half of the mirror or one set of waves inverted against each other, check the "mirrored" and the "mirrored flipped" checkboxes in the settings. Doing so will display the top half of the mirror indicator, which is the low percent difference wave with the high percent difference wave inverted.
The indicator will also change the background color of its own pane to indicate possible buy/sell periods (work in progress).
Does the indicator include any alerts?
Yes, they are a work in progress but starting out with this release, we have:
NOTE: This is an initial release version of this indicator. Please do not use these alerts with bots yet, as they will repaint in real-time.
NOTE: A later release may happen that will delay firing the events until 1/2 of the current bar time has passed.
NOTE: As with any indicator watch your upper timeframe waves first before zooming into lower.
DB KCBB%D Buy Zone Alert
DB KCBB%D MEDIUM Buy Alert
DB KCBB%D STRONG Buy Alert
DB KCBB%D Sell Alert
DB KCBB%D STRONG Sell Alert
DB KCBB%D Trend Up Alert
DB KCBB%D Trend Down Alert
Use at your own risk and do your own diligence.
Enjoy!
