OPEN-SOURCE SCRIPT
vdubong updated
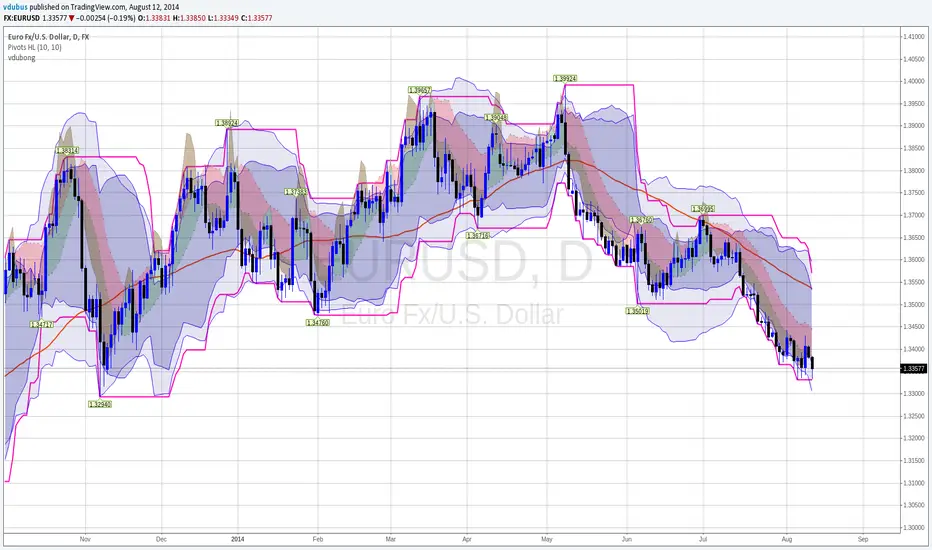
Most the credit for this update has to go to RicardoSantos and his awesome RSIChannel + some fixes to my own which I embedded to my my own script.. I've also embedded the additional Bollinger band 50/2. What can I say it's becoming a thing of beauty :).
RicardoSantos's RSIChannel indicator is also included separately (hidden) should you chose to 'Make it mine'
Made a couple of changes to the script pastebin.com/F5e24Vfu
RicardoSantos's RSIChannel indicator is also included separately (hidden) should you chose to 'Make it mine'
Made a couple of changes to the script pastebin.com/F5e24Vfu
Açık kaynak kodlu komut dosyası
Gerçek TradingView ruhuna uygun olarak, bu komut dosyasının oluşturucusu bunu açık kaynaklı hale getirmiştir, böylece yatırımcılar betiğin işlevselliğini inceleyip doğrulayabilir. Yazara saygı! Ücretsiz olarak kullanabilirsiniz, ancak kodu yeniden yayınlamanın Site Kurallarımıza tabi olduğunu unutmayın.
Feragatname
Bilgiler ve yayınlar, TradingView tarafından sağlanan veya onaylanan finansal, yatırım, işlem veya diğer türden tavsiye veya tavsiyeler anlamına gelmez ve teşkil etmez. Kullanım Şartları'nda daha fazlasını okuyun.