Pulse DPO: Major Cycle Tops and Bottoms█ OVERVIEW
Pulse DPO is an oscillator designed to highlight Major Cycle Tops and Bottoms .
It works on any market driven by cycles. It operates by removing the short-term noise from the price action and focuses on the market's cyclical nature.
This indicator uses a Normalized version of the Detrended Price Oscillator (DPO) on a 0-100 scale, making it easier to identify major tops and bottoms.
Credit: The DPO was first developed by William Blau in 1991.
█ HOW TO READ IT
Pulse DPO oscillates in the range between 0 and 100. A value in the upper section signals an OverBought (OB) condition, while a value in the lower section signals an OverSold (OS) condition.
Generally, the triggering of OB and OS conditions don't necessarily translate into swing tops and bottoms, but rather suggest caution on approaching a market that might be overextended.
Nevertheless, this indicator has been customized to trigger the signal only during remarkable top and bottom events.
I suggest using it on the Daily Time Frame , but you're free to experiment with this indicator on other time frames.
The indicator has Built-in Alerts to signal the crossing of the Thresholds. Please don't act on an isolated signal, but rather integrate it to work in conjunction with the indicators present in your Trading Plan.
█ OB SIGNAL ON: ENTERING OVERBOUGHT CONDITION
When Pulse DPO crosses Above the Top Threshold it Triggers ON the OB signal. At this point the oscillator line shifts to OB color.
When Pulse DPO enters the OB Zone, please beware! In this Area the Major Players usually become Active Sellers to the Public. While the OB signal is On, it might be wise to Consider Selling a portion or the whole Long Position.
Please note that even though this indicator aims to focus on major tops and bottoms, a strong trending market might trigger the OB signal and stay with it for a long time. That's especially true on young markets and on bubble-mode markets.
█ OB SIGNAL OFF: EXITING OVERBOUGHT CONDITION
When Pulse DPO crosses Below the Top Threshold it Triggers OFF the OB signal. At this point the oscillator line shifts to its normal color.
When Pulse DPO exits the OB Zone, please beware because a Major Top might just have occurred. In this Area the Major Players usually become Aggressive Sellers. They might wind up any remaining Long Positions and Open new Short Positions.
This might be a good area to Open Shorts or to Close/Reverse any remaining Long Position. Whatever you choose to do, it's usually best to act quickly because the market is prone to enter into panic mode.
█ OS SIGNAL ON: ENTERING OVERSOLD CONDITION
When Pulse DPO crosses Below the Bottom Threshold it Triggers ON the OS signal. At this point the oscillator line shifts to OS color.
When Pulse DPO enters the OS Zone, please beware because in this Area the Major Players usually become Active Buyers accumulating Long Positions from the desperate Public.
While the OS signal is On, it might be wise to Consider becoming a Buyer or to implement a Dollar-Cost Averaging (DCA) Strategy to build a Long Position towards the next Cycle. In contrast to the tops, the OS state usually takes longer to resolve a major bottom.
█ OS SIGNAL OFF: EXITING OVERSOLD CONDITION
When Pulse DPO crosses Above the Bottom Threshold it Triggers OFF the OS signal. At this point the oscillator line shifts to its normal color.
When Pulse DPO exits the OS Zone, please beware because a Major Bottom might already be in place. In this Area the Major Players become Aggresive Buyers. They might wind up any remaining Short Positions and Open new Long Positions.
This might be a good area to Open Longs or to Close/Reverse any remaining Short Positions.
█ WHY WOULD YOU BE INTERESTED IN THIS INDICATOR?
This indicator is built over a solid foundation capable of signaling Major Cycle Tops and Bottoms across many markets. Let's see some examples:
Early Bitcoin Years: From 0 to 1242
This chart is in logarithmic mode in order to properly display various exponential cycles. Pulse DPO is properly signaling the major early highs from 9-Jun-2011 at 31.50, to the next one on 9-Apr-2013 at 240 and the epic top from 29-Nov-2013 at 1242.
Due to the massive price movements, the OB condition stays pinned during most of the exponential price action. But as you can see, the OB condition quickly vanishes once the Cycle Top has been reached. As the market matures, the OB condition becomes more exceptional and triggers much closer from the Cycle Top.
With regards to Cycle Bottoms, the early bottom of 2 after having peaked at 31.50 doesn’t get captured by the indicator. That is the only cycle bottom that escapes the Pulse DPO when the bottom threshold is set at a value of 5. In that event, the oscillator low reached 6.95.
Bitcoin Adoption Spreading: From 257 to 73k
This chart is in logarithmic mode in order to properly display various exponential cycles. Pulse DPO is properly signaling all the major highs from 17-Dec-2017 at 19k, to the next one on 14-Apr-2021 at 64k and the most recent top from 9-Nov-2021 at 68k.
During the massive run of 2017, the OB condition still stayed triggered for a few weeks on each swing top. But on the next cycles it started to signal only for a few days before each swing top actually happened. The OB condition during the last cycle top triggered only for 3 days. Therefore the signal grows in focus as the market matures.
At the time of publishing this indicator, Bitcoin printed a new All Time High (ATH) on 13-Mar-2024 at 73k. That run didn’t trigger the OB condition. Therefore, if the indicator is correct the Bitcoin market still has some way to grow during the next months.
With regards to Cycle Bottoms, the bottom of 3k after having peaked at19k got captured within the wide OS zone. The bottom of 15k after having peaked at 68k got captured too within the OS accumulation area.
Gold
Pulse DPO behaves surprisingly well on a long standing market such as Gold. Moving back to the 197x years it’s been signaling most Cycle Tops and Bottoms with precision. During the last cycle, it shows topping at 2k and bottoming at 1.6k.
The current price action is signaling OB condition in the range of 2.5k to 2.7k. Looking at past cycles, it tends to trigger on and off at multiple swing tops until reaching the final cycle top. Therefore this might indicate the first wave within a potential gold run.
Oil
On the Oil market, we can see that most of the cycle tops and bottoms since the 80s got signaled. The only exception being the low from 2020 which didn’t trigger.
EURUSD
On Forex markets the Pulse DPO also behaves as expected. Looking back at EURUSD we can see the marketing triggering OB and OS conditions during major cycle tops and bottoms from recent times until the 80s.
S&P 500
On the S&P 500 the Pulse DPO catched the lows from 2016 and 2020. Looking at present price action, the recent ATH didn’t trigger the OB condition. Therefore, the indicator is allowing room for another leg up during the next months.
Amazon
On the Amazon chart the Pulse DPO is mirroring pretty accurately the major swings. Scrolling back to the early 2000s, this chart resembles early exponential swings in the crypto space.
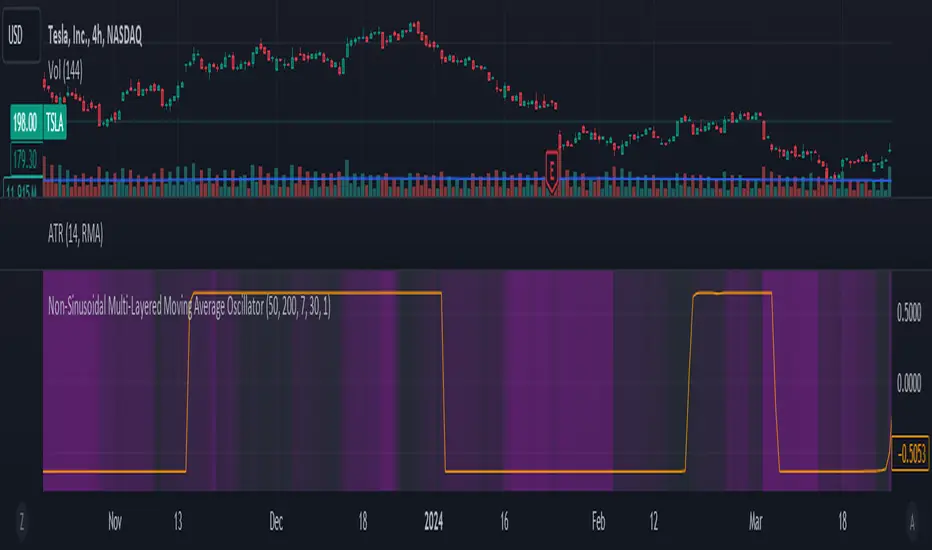
Tesla
Moving onto a younger tech stock, Pulse DPO captures pretty accurately the major tops and bottoms. The chart is shown in logarithmic scale to better display the magnitude of the moves.
█ SETTINGS
This indicator is ideal for identifying major market turning points while filtering out short-term noise. You are free to adjust the parameters to align with your preferred trading style.
Parameters : This section allows you to customize any of the Parameters that shape the Oscillator.
Oscillator Length: Defines the period for calculating the Oscillator.
Offset: Shifts the oscillator calculation by a certain number of periods, which is typically half the Oscillator Length.
Lookback Period: Specifies how many bars to look back to find tops and bottoms for normalization.
Smoothing Length: Determines the length of the moving average used to smooth the oscillator.
Thresholds : This section allows you to customize the Thresholds that trigger the OB and OS conditions.
Top: Defines the value of the Top Threshold.
Bottom: Defines the value of the Bottom Threshold.
"wave" için komut dosyalarını ara

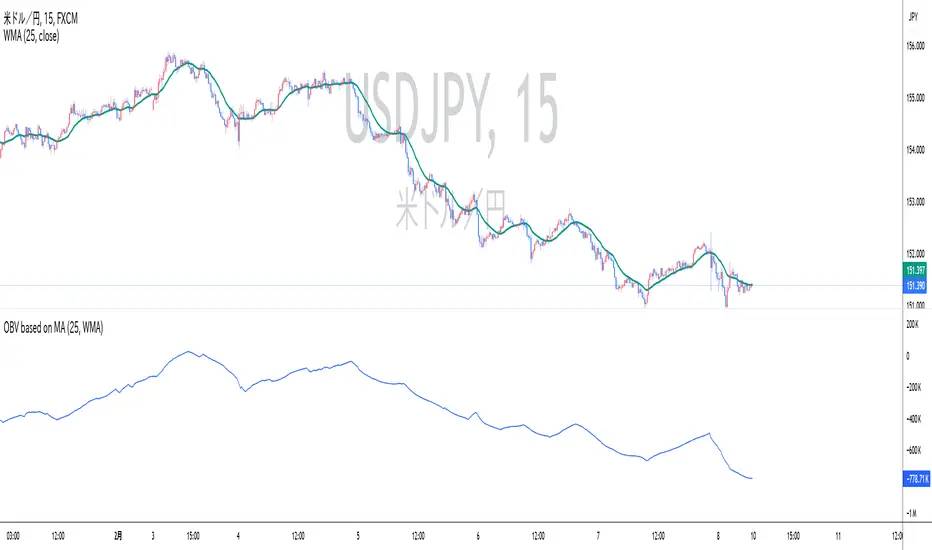
OBV based on MADescription:
This indicator calculates On-Balance Volume (OBV) based on the direction of a Simple Moving Average (SMA). Instead of using price movements, this OBV adds or subtracts volume depending on whether the SMA is rising or falling.
SMA-based OBV: When the SMA rises, the volume is added to the OBV. When the SMA falls, the volume is subtracted from the OBV. This allows traders to observe cumulative volume in relation to the wave patterns created by the SMA.
SMA Period: The period of the SMA can be customized, allowing traders to adjust it according to the wave size they want to observe.
While the cumulative volume indicator already exists, traders who analyze volume patterns can use this indicator to more easily conduct volume analysis across different wave sizes.
Inputs:
SMA Period: Defines the lookback period for calculating the Simple Moving Average (default is 25).
Ideal for:
Traders who want to analyze volume flow relative to moving average trends, rather than price movements. This can help identify underlying strength or weakness in market trends.
説明:
このインジケーターは、単純移動平均(SMA)の方向に基づいてオンバランス・ボリューム(OBV)を計算します。価格の動きではなく、SMAが上昇しているときは出来高を加算し、SMAが下降しているときは出来高を減算します。
SMA基準のOBV: SMAが上昇している場合はOBVに出来高が加算され、SMAが下降している場合は出来高が減算されます。これにより、SMAが作る波形に即した累積出来高を観察することができます。
SMA期間: トレーダーが見たい波のサイズ感に応じて、SMAの期間をカスタマイズできます。
既に累積出来高(Cumulative Volume)というインジケーターは存在しますが、波形を基に出来高を分析しているトレーダーは、このインジケーターを使うことで、様々なサイズの波形に即した出来高分析をより簡単に行うことができます。
入力項目:
SMA期間: 単純移動平均の計算に使用される期間を定義します(デフォルトは25)。
適しているトレーダー:
より波形に即した累積出来高分析を重視するトレーダーに最適です。
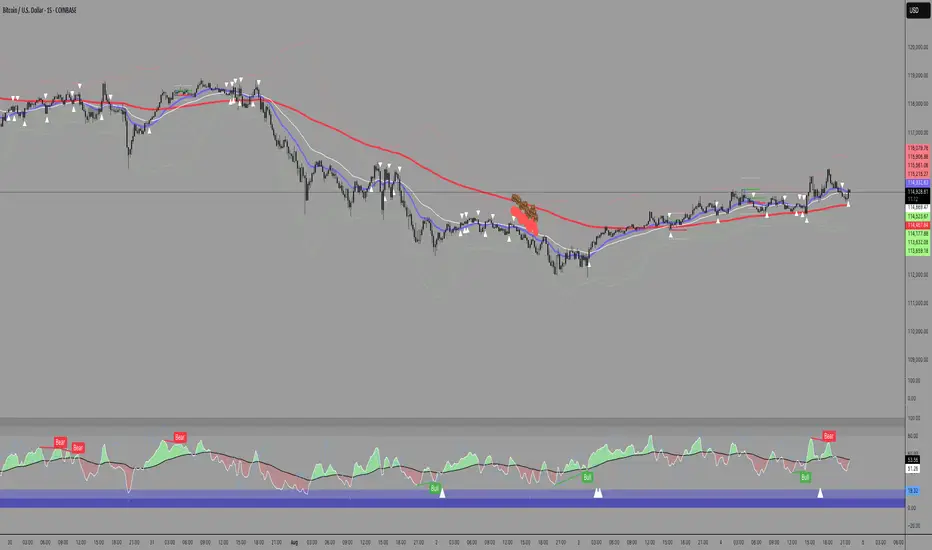
RSI with Swing Trade by Kelvin_VAlgorithm Description: "RSI with Swing Trade by Kelvin_V"
1. Introduction:
This algorithm uses the RSI (Relative Strength Index) and optional Moving Averages (MA) to detect potential uptrends and downtrends in the market. The key feature of this script is that it visually changes the candle colors based on the market conditions, making it easier for users to identify potential trend swings or wave patterns.
The strategy offers flexibility by allowing users to enable or disable the MA condition. When the MA condition is enabled, the strategy will confirm trends using two moving averages. When disabled, the strategy will only use RSI to detect potential market swings.
2. Key Features of the Algorithm:
RSI (Relative Strength Index):
The RSI is used to identify potential market turning points based on overbought and oversold conditions.
When the RSI exceeds a predefined upper threshold (e.g., 60), it suggests a potential uptrend.
When the RSI drops below a lower threshold (e.g., 40), it suggests a potential downtrend.
Moving Averages (MA) - Optional:
Two Moving Averages (Short MA and Long MA) are used to confirm trends.
If the Short MA crosses above the Long MA, it indicates an uptrend.
If the Short MA crosses below the Long MA, it indicates a downtrend.
Users have the option to enable or disable this MA condition.
Visual Candle Coloring:
Green candles represent a potential uptrend, indicating a bullish move based on RSI (and MA if enabled).
Red candles represent a potential downtrend, indicating a bearish move based on RSI (and MA if enabled).
3. How the Algorithm Works:
RSI Levels:
The user can set RSI upper and lower bands to represent potential overbought and oversold levels. For example:
RSI > 60: Indicates a potential uptrend (bullish move).
RSI < 40: Indicates a potential downtrend (bearish move).
Optional MA Condition:
The algorithm also allows the user to apply the MA condition to further confirm the trend:
Short MA > Long MA: Confirms an uptrend, reinforcing a bullish signal.
Short MA < Long MA: Confirms a downtrend, reinforcing a bearish signal.
This condition can be disabled, allowing the user to focus solely on RSI signals if desired.
Swing Trade Logic:
Uptrend: If the RSI exceeds the upper threshold (e.g., 60) and (optionally) the Short MA is above the Long MA, the candles will turn green to signal a potential uptrend.
Downtrend: If the RSI falls below the lower threshold (e.g., 40) and (optionally) the Short MA is below the Long MA, the candles will turn red to signal a potential downtrend.
Visual Representation:
The candle colors change dynamically based on the RSI values and moving average conditions, making it easier for traders to visually identify potential trend swings or wave patterns without relying on complex chart analysis.
4. User Customization:
The algorithm provides multiple customization options:
RSI Length: Users can adjust the period for RSI calculation (default is 4).
RSI Upper Band (Potential Uptrend): Users can customize the upper RSI level (default is 60) to indicate a potential bullish move.
RSI Lower Band (Potential Downtrend): Users can customize the lower RSI level (default is 40) to indicate a potential bearish move.
MA Type: Users can choose between SMA (Simple Moving Average) and EMA (Exponential Moving Average) for moving average calculations.
Enable/Disable MA Condition: Users can toggle the MA condition on or off, depending on whether they want to add moving averages to the trend confirmation process.
5. Benefits of the Algorithm:
Easy Identification of Trends: By changing candle colors based on RSI and MA conditions, the algorithm makes it easy for users to visually detect potential trend reversals and trend swings.
Flexible Conditions: The user has full control over the RSI and MA settings, allowing them to adapt the strategy to different market conditions and timeframes.
Clear Visualization: With the candle color changes, users can quickly recognize when a potential uptrend or downtrend is forming, enabling faster decision-making in their trading.
6. Example Usage:
Day traders: Can apply this strategy on short timeframes such as 5 minutes or 15 minutes to detect quick trends or reversals.
Swing traders: Can use this strategy on longer timeframes like 1 hour or 4 hours to identify and follow larger market swings.

E9 Shark-32 PatternUnderstanding the Shark-32 Pattern and its Trading Applications
The Shark-32 Pattern is a bearish technical trading formation used to predict market reversals or trend continuations. It highlights a downward move followed by a corrective rally, signaling a potential resumption of the downtrend. Here’s a breakdown of how it works:
What is the Shark-32 Pattern?
The Shark-32 pattern is a five-wave structure typically observed in bearish markets:
Wave 0 to X: A significant price decline starts the pattern.
Wave X to A: A correction pushes the price slightly upward.
Wave A to B: The price drops again but doesn’t reach the initial low.
Wave B to C: A final sharp decline concludes the pattern.
Once Wave C is formed, it suggests that the market will continue to move downward, presenting a potential selling or shorting opportunity.
Using the Pattern in Trading
This pattern is valuable for traders seeking high-probability bearish setups. The goal is to capitalize on the continuation of a downtrend following the corrective rally (X to A). Identifying the Shark-32 pattern helps anticipate the next wave of selling pressure.
Trading Setup
Identify a Shark-32 pattern.
If the price closes above the pattern's high, buy at the open the next day.
If the price closes below the pattern's low, short at the open the next day.
Sell/cover when the price moves 7% in the direction of the breakout.
Close the trade for a loss if the price moves 7% in the opposite direction.
For example, in a bull market after an upward breakout from a Shark-32, the net gain was $69.55. The method won 56% of the time with 5,218 winning trades and an average gain of $714.07. Conversely, 44% of trades were losers, with an average loss of $747.33. The average holding period was 26 calendar days.
The gains and losses were closely aligned with the 7% threshold set for this test.
Key Target Levels
To enhance the strategy, use dotted projection lines as target levels:
Upper Target: Drawn above the high of the corrective rally (Wave A). If the price breaks above this line, it may signal further upward movement, indicating a potentially weaker downtrend.
Lower Target: Positioned below the low of Wave C, providing a target for bearish trades.
These lines help determine future price targets and assist in setting take-profit or stop-loss levels.
Trading the Breakout
Look for breakouts once the Shark-32 pattern is identified:
Upward Breakout: If the price closes above the green line (high from two bars ago), it indicates a potential reversal to the upside.
Downward Breakout: If the price breaks below the red line (low from two bars ago), it confirms the bearish continuation.
Breakouts allow traders to adjust their positions based on market shifts.
Trading Tips
Continuation: The Shark-32 pattern acts as a continuation 60% of the time, confirming the ongoing trend.
Breakout Confirmation: Wait for the price to close above or below the pattern’s key levels before entering a trade.
Trade with the Trend: Since the Shark-32 is a continuation pattern, expect the breakout to align with the inbound price trend.
Symmetry: Patterns with symmetry often perform better. For more insights, refer to detailed trading literature.
Half-Staff: The Shark-32 can form midway in a trend, similar to flags and pennants.
Shark-32: Trading Performance
Based on an analysis of 23,369 trades, the following performance metrics were observed:
Bull Market with Upward Breakout: The average net profit was $69.55. This method won 56% of the time, with winning trades averaging $714.07. Losing trades, which constituted 44% of the total, had an average loss of $747.33. The average holding period was 26 calendar days.
Bull Market with Downward Breakout: The average net loss was $(76.36). This method won 43% of the time, with winning trades averaging $753.56. Losing trades, which constituted 57% of the total, had an average loss of $706.32. The average holding period was 23 calendar days.
Bear Market with Upward Breakout: The average net loss was $(89.13). This method won 46% of the time, with winning trades averaging $710.77. Losing trades, which constituted 54% of the total, had an average loss of $756.97. The average holding period was 16 calendar days.
Bear Market with Downward Breakout: The average net profit was $65.17. This method won 52% of the time, with winning trades averaging $781.62. Losing trades, which constituted 48% of the total, had an average loss of $722.41. The average holding period was 13 calendar days.
Sniper Signal- Description
The Sniper Signal is a sophisticated technical indicator designed for traders seeking to maximize accuracy in identifying key turning points within a market. This indicator is built on a dual approach, combining the power of the Wave Trend Momentum Oscillator (WTMO) with the robustness of a long-term Simple Moving Average (SMA), making it an ideal tool for trading in dynamic and trending market environments.
The WTMO is known for its ability to capture momentum and underlying price direction, providing early signals of trend changes. By smoothing price movements using an exponential moving average (EMA), the WTMO accurately identifies when price is overextending in one direction, which may precede a reversal.
The 100-period SMA acts as a critical trend filter, ensuring that trades are only made in the direction of the prevailing market flow. This approach ensures that signals generated by the WTMO align with the long-term trend, filtering out false signals that can appear in sideways or low volatility markets.
The Sniper Signal is not just an indicator that marks entries and exits; it is a complete strategy in itself, designed for traders who understand the importance of trading in the direction of the prevailing trend. Buy signals are generated only when momentum is at its lowest point (WT1 < -5) and the price is supported by a confirmed uptrend (price above the SMA). Conversely, sell signals are only triggered when momentum is at extremely high levels (WT1 > 5) and the market shows clear signs of weakness (price below the SMA).
This combination of momentum and trend analysis creates a balanced approach that allows traders to capture significant moves in the market, while minimizing exposure to unnecessary risk. The Sniper Signal is particularly effective in markets with well-defined trends, where the key to success lies in entering the market at optimal points and exiting before a significant reversal occurs.
In summary, the Sniper Signal is an advanced tool designed for serious traders looking to take advantage of the combination of momentum and trend to execute high probability trades in moving markets.
- How to use the script?
The Sniper Signal indicator code is written in Pine Script, the native programming language of TradingView. To use this indicator, users must copy the code and paste it into the Pine Script editor within the TradingView platform. Once they have done this, they can save and add the script to their chart to begin displaying buy and sell signals directly on their price charts.
When using the Sniper Signal, traders should pay attention to the signals represented by the triangles on the chart: an upward-facing blue triangle indicates a possible buying opportunity, while a downward-facing red triangle suggests a possible selling opportunity. It is crucial that users also watch the 100-period Simple Moving Average (SMA), shown as a gray line on the chart, to ensure that trades align with the overall market trend. This helps filter out less reliable signals and improves the accuracy of trading decisions.
- Open-source reuse
The indicator code is based on common and widely used concepts in technical analysis, such as the Wave Trend Momentum Oscillator (WTMO) and the Simple Moving Average (SMA). These components are not proprietary and are part of the general knowledge in the trading community, which means that many developers can create their own versions based on these same principles.

Magic Linear Regression Channel [MW]Introduction
The Magic Linear Regression Channel indicator provides users with a way to quickly include a linear regression channel ANYWHERE on their chart, in order to find channel breakouts and bounces within any time period. It uses a novel method that allows users to adjust the start and end period of the regression channel in order to quickly make adjustments faster, with fewer steps, and with more precision than with any other linear regression channel tool. It includes Fibonacci bands AND a horizontal mode in order for users to quickly define significant price levels based on the high, low, open, and close prices defined by the start period.
Settings
Start Time: This is initially MANUALLY SELECTED ON THE CHART when the indicator is first loaded.
End time: This is also initially MANUALLY SELECTED ON THE CHART when the indicator is first loaded.
Horizontal Line: This forces the baseline to be horizontal. The band distance is defined by the maximum price distance from the band.
Horizontal Line Type: This snaps the horizontal line to the close, high, low, or open price. Or, it can also use a regression calculation for the selected time period to define the y-position of the line.
Extend Line N Bars: How many bars to the left in which to extend the baseline and bands.
Show Baseline ONLY!!: Removes all lines except the baseline and it’s extension.
Add Half Band: Includes a band that is half the distance between the baseline and the top and bottom bands
Add Outer Fibonacci Band: Includes a band that is 1.618 (phi) times the default band distance
Add Inner Fibonacci Band - Upper: Includes a band that is 0.618 (1/phi) times the default band distance
Add Inner Fibonacci Band - Lower: Includes a band that is 0.382 (1 - 1/phi) times the default band distance
Calculations
This indicator uses the least squares approach for generating a straight regression line, which can be reviewed at Wikipedia’s “Simple Linear Regression” page. It sums all of the x-values, and y-values, as well as the sum of the product of corresponding x and y values, and the sum of the squares of the x-values. These values are used to calculate the slope and intercept using the following equations:
slope = (n * sum_xy - sum_x * sum_y) / (n * sum_xx - sum_x * sum_x)
And
intercept = (sum_y - slope * sum_x) / n
The slope and intercept are then used to generate the baseline and the corresponding bands using the user-selected offsets.
How to Use
When the Magic Linear Regression Channel indicator is first added to the chart, there will be a blue prompt behind the “Indicators, Metrics & Strategies” window. Close the window, then select a START POINT by clicking at a desired location on the chart. Next, you will be prompted to select an END POINT. The end point MUST be placed after the START POINT. At this time a channel will be generated. Once you’ve selected the START POINT and END POINT, you can adjust them by dragging them anywhere on the chart. Each adjustment will generate a new channel making it easier for you to quickly visualize and recognize any channel exits and bounces.
The Magic Linear Regression Channel indicator works great at identifying wave patterns. Place the start line at a top or bottom pivot point. Place the end line at the next respective top or bottom pivot. This will give you a complete wave form to work with. When price reaches a band and rejects, it can be a strong indication that price may move back to one of the bands in the channel. If price exits the channel with volume that supports the exit, it may be an indication of a breakout.
You can also use the horizontal mode to identify key levels, then add Fibonacci bands based on regression calculations for the given time period to provide more meaningful areas of support and resistance.
Other Usage Notes and Limitations
Occasionally, off-by-1 errors appear which makes the extended lines protrude at a slightly incorrect angle. This is a known bug and will be addressed in the next release.
It's important for traders to be aware of the limitations of any indicator and to use them as part of a broader, well-rounded trading strategy that includes risk management, fundamental analysis, and other tools that can help with reducing false signals, determining trend direction, and providing additional confirmation for a trade decision. Diversifying strategies and not relying solely on one type of indicator or analysis can help mitigate some of these risks.

MTF - Quantum Fibonacci ATR/ADR Levels & Targets**Indicator Overview:**
The *Quantum Fibonacci Wave Mechanics* indicator is a powerful tool designed to help traders identify dynamic support, resistance, and target levels based on the Average True Range (ATR) and Average Daily Range (ADR). This indicator leverages Fibonacci ratios to calculate precise entry and target levels, providing a comprehensive approach to market analysis.
**Key Features:**
- **Dynamic ATR/ADR Levels:** Automatically calculate and plot ATR and ADR-based support and resistance levels, offering insight into market volatility and potential reversal zones.
- **Fibonacci-Based Entry Levels:** Calculate Fibonacci entry levels using the 0.618 ratio, helping traders find optimal points to enter trades.
- **Customizable Target Levels:** Set up to three target levels based on Fibonacci ratios (1.618, 2.618, 3.618), allowing for precise trade management.
- **Stop Loss Lines:** Plot stop loss lines derived from ATR and ADR calculations, ensuring risk is managed effectively.
- **EMA Integration:** Optionally plot an Exponential Moving Average (EMA) line for additional trend confirmation.
- **Customizable Color Settings:** Adjust the colors of all levels and signals to fit your charting preferences.
- **Bar Coloring Based on Signals:** Automatically color bars based on the latest buy or sell signal for easier visual identification.
- **Label Display for Key Levels:** Display labels on the chart for important levels such as entry points, target levels, and stop loss lines.
**How Users Can Benefit:**
This indicator is ideal for traders who want to blend the precision of Fibonacci analysis with the robustness of ATR/ADR calculations. Whether you're a day trader looking for short-term entry points or a swing trader seeking reliable support and resistance levels, this indicator offers a versatile toolset for enhancing your trading decisions.
**Customization Instructions:**
The *Quantum Fibonacci Wave Mechanics* indicator is highly customizable to suit different trading styles and preferences. Below is a guide on how to adjust the settings:
1. **General Settings:**
- **ADR Length:** Define the lookback period for calculating the ADR.
- **EMA Length:** Set the period for the Exponential Moving Average (EMA).
- **Timeframe:** Select the timeframe for which the levels will be calculated (e.g., daily, weekly).
2. **Display Settings:**
- **Show ATR Levels:** Toggle the display of ATR-based support and resistance levels.
- **Show ADR Levels:** Toggle the display of ADR-based support and resistance levels.
- **Show EMA Line:** Toggle the display of the EMA line.
- **Show Stop Loss Lines:** Display stop loss levels derived from ATR and ADR.
- **Show Middle Level Line:** Show the middle level between buy and sell stop loss lines.
- **Show Fibonacci Entry Levels:** Enable the display of Fibonacci-based entry levels.
- **Show Entry Signals:** Plot buy and sell signals based on the crossover of the entry levels.
- **Show Target Levels:** Display up to three target levels for both buy and sell signals.
- **Color Bars Based on Last Signal:** Automatically color bars according to the last signal (buy or sell).
3. **Fibonacci Settings:**
- **Entry Ratio (Fibonacci):** Adjust the Fibonacci ratio used for calculating entry levels (default is 0.618).
- **Target Ratios (Fibonacci):** Set the Fibonacci ratios for up to three target levels (default ratios are 1.618, 2.618, and 3.618).
4. **Color Settings:**
- **Support Levels:** Customize the color of the support lines.
- **Resistance Levels:** Customize the color of the resistance lines.
- **Stop Loss Levels:** Set the color for stop loss lines (default is red).
- **Buy Target Levels:** Set the color for buy target levels (default is white).
- **Sell Target Levels:** Set the color for sell target levels (default is yellow).
5. **Label Display Settings:**
- **Show Labels for The Levels:** Toggle the display of labels for the various levels on the chart.
**Usage Tips:**
- **Combining with Other Indicators:** Use this indicator in conjunction with other technical indicators such as RSI, MACD, or Bollinger Bands to confirm signals.
- **Adjusting to Different Timeframes:** Customize the `timeframeInput` to analyze different market conditions, from intraday to long-term trading.
- **Risk Management:** Utilize the stop loss levels to manage risk effectively, ensuring your trades are protected against adverse market movements.
**Disclaimer:**
*This indicator is provided for educational purposes only and should not be considered financial advice. Trading in financial markets involves risk, and past performance does not guarantee future results. Always conduct your own research and consult with a licensed financial advisor before making any trading decisions. The creator of this indicator is not responsible for any financial losses that may occur from using this tool.*

PubLibPatternLibrary "PubLibPattern"
pattern conditions for indicator and strategy development
bear_5_0(ab_low_tol, ab_up_tol, bc_low_tol, bc_up_tol, cd_low_tol, cd_up_tol)
bearish 5-0 harmonic pattern condition
Parameters:
ab_low_tol (float)
ab_up_tol (float)
bc_low_tol (float)
bc_up_tol (float)
cd_low_tol (float)
cd_up_tol (float)
Returns: bool
bull_5_0(ab_low_tol, ab_up_tol, bc_low_tol, bc_up_tol, cd_low_tol, cd_up_tol)
bullish 5-0 harmonic pattern condition
Parameters:
ab_low_tol (float)
ab_up_tol (float)
bc_low_tol (float)
bc_up_tol (float)
cd_low_tol (float)
cd_up_tol (float)
Returns: bool
bear_abcd(bc_low_tol, bc_up_tol, cd_low_tol, cd_up_tol)
bearish abcd harmonic pattern condition
Parameters:
bc_low_tol (float)
bc_up_tol (float)
cd_low_tol (float)
cd_up_tol (float)
Returns: bool
bull_abcd(bc_low_tol, bc_up_tol, cd_low_tol, cd_up_tol)
bullish abcd harmonic pattern condition
Parameters:
bc_low_tol (float)
bc_up_tol (float)
cd_low_tol (float)
cd_up_tol (float)
Returns: bool
bear_alt_bat(ab_low_tol, ab_up_tol, bc_low_tol, bc_up_tol, cd_low_tol, cd_up_tol, ad_low_tol, ad_up_tol)
bearish alternate bat harmonic pattern condition
Parameters:
ab_low_tol (float)
ab_up_tol (float)
bc_low_tol (float)
bc_up_tol (float)
cd_low_tol (float)
cd_up_tol (float)
ad_low_tol (float)
ad_up_tol (float)
Returns: bool
bull_alt_bat(ab_low_tol, ab_up_tol, bc_low_tol, bc_up_tol, cd_low_tol, cd_up_tol, ad_low_tol, ad_up_tol)
bullish alternate bat harmonic pattern condition
Parameters:
ab_low_tol (float)
ab_up_tol (float)
bc_low_tol (float)
bc_up_tol (float)
cd_low_tol (float)
cd_up_tol (float)
ad_low_tol (float)
ad_up_tol (float)
Returns: bool
bear_bat(ab_low_tol, ab_up_tol, bc_low_tol, bc_up_tol, cd_low_tol, cd_up_tol, ad_low_tol, ad_up_tol)
bearish bat harmonic pattern condition
Parameters:
ab_low_tol (float)
ab_up_tol (float)
bc_low_tol (float)
bc_up_tol (float)
cd_low_tol (float)
cd_up_tol (float)
ad_low_tol (float)
ad_up_tol (float)
Returns: bool
bull_bat(ab_low_tol, ab_up_tol, bc_low_tol, bc_up_tol, cd_low_tol, cd_up_tol, ad_low_tol, ad_up_tol)
bullish bat harmonic pattern condition
Parameters:
ab_low_tol (float)
ab_up_tol (float)
bc_low_tol (float)
bc_up_tol (float)
cd_low_tol (float)
cd_up_tol (float)
ad_low_tol (float)
ad_up_tol (float)
Returns: bool
bear_butterfly(ab_low_tol, ab_up_tol, bc_low_tol, bc_up_tol, cd_low_tol, cd_up_tol, ad_low_tol, ad_up_tol)
bearish butterfly harmonic pattern condition
Parameters:
ab_low_tol (float)
ab_up_tol (float)
bc_low_tol (float)
bc_up_tol (float)
cd_low_tol (float)
cd_up_tol (float)
ad_low_tol (float)
ad_up_tol (float)
Returns: bool
bull_butterfly(ab_low_tol, ab_up_tol, bc_low_tol, bc_up_tol, cd_low_tol, cd_up_tol, ad_low_tol, ad_up_tol)
bullish butterfly harmonic pattern condition
Parameters:
ab_low_tol (float)
ab_up_tol (float)
bc_low_tol (float)
bc_up_tol (float)
cd_low_tol (float)
cd_up_tol (float)
ad_low_tol (float)
ad_up_tol (float)
Returns: bool
bear_cassiopeia_a(ab_low_tol, ab_up_tol, bc_low_tol, bc_up_tol, cd_low_tol, cd_up_tol)
bearish cassiopeia a harmonic pattern condition
Parameters:
ab_low_tol (float)
ab_up_tol (float)
bc_low_tol (float)
bc_up_tol (float)
cd_low_tol (float)
cd_up_tol (float)
Returns: bool
bull_cassiopeia_a(ab_low_tol, ab_up_tol, bc_low_tol, bc_up_tol, cd_low_tol, cd_up_tol)
bullish cassiopeia a harmonic pattern condition
Parameters:
ab_low_tol (float)
ab_up_tol (float)
bc_low_tol (float)
bc_up_tol (float)
cd_low_tol (float)
cd_up_tol (float)
Returns: bool
bear_cassiopeia_b(ab_low_tol, ab_up_tol, bc_low_tol, bc_up_tol, cd_low_tol, cd_up_tol)
bearish cassiopeia b harmonic pattern condition
Parameters:
ab_low_tol (float)
ab_up_tol (float)
bc_low_tol (float)
bc_up_tol (float)
cd_low_tol (float)
cd_up_tol (float)
Returns: bool
bull_cassiopeia_b(ab_low_tol, ab_up_tol, bc_low_tol, bc_up_tol, cd_low_tol, cd_up_tol)
bullish cassiopeia b harmonic pattern condition
Parameters:
ab_low_tol (float)
ab_up_tol (float)
bc_low_tol (float)
bc_up_tol (float)
cd_low_tol (float)
cd_up_tol (float)
Returns: bool
bear_cassiopeia_c(ab_low_tol, ab_up_tol, bc_low_tol, bc_up_tol, cd_low_tol, cd_up_tol)
bearish cassiopeia c harmonic pattern condition
Parameters:
ab_low_tol (float)
ab_up_tol (float)
bc_low_tol (float)
bc_up_tol (float)
cd_low_tol (float)
cd_up_tol (float)
Returns: bool
bull_cassiopeia_c(ab_low_tol, ab_up_tol, bc_low_tol, bc_up_tol, cd_low_tol, cd_up_tol)
bullish cassiopeia c harmonic pattern condition
Parameters:
ab_low_tol (float)
ab_up_tol (float)
bc_low_tol (float)
bc_up_tol (float)
cd_low_tol (float)
cd_up_tol (float)
Returns: bool
bear_crab(ab_low_tol, ab_up_tol, bc_low_tol, bc_up_tol, cd_low_tol, cd_up_tol, ad_low_tol, ad_up_tol)
bearish crab harmonic pattern condition
Parameters:
ab_low_tol (float)
ab_up_tol (float)
bc_low_tol (float)
bc_up_tol (float)
cd_low_tol (float)
cd_up_tol (float)
ad_low_tol (float)
ad_up_tol (float)
Returns: bool
bull_crab(ab_low_tol, ab_up_tol, bc_low_tol, bc_up_tol, cd_low_tol, cd_up_tol, ad_low_tol, ad_up_tol)
bullish crab harmonic pattern condition
Parameters:
ab_low_tol (float)
ab_up_tol (float)
bc_low_tol (float)
bc_up_tol (float)
cd_low_tol (float)
cd_up_tol (float)
ad_low_tol (float)
ad_up_tol (float)
Returns: bool
bear_deep_crab(ab_low_tol, ab_up_tol, bc_low_tol, bc_up_tol, cd_low_tol, cd_up_tol, ad_low_tol, ad_up_tol)
bearish deep crab harmonic pattern condition
Parameters:
ab_low_tol (float)
ab_up_tol (float)
bc_low_tol (float)
bc_up_tol (float)
cd_low_tol (float)
cd_up_tol (float)
ad_low_tol (float)
ad_up_tol (float)
Returns: bool
bull_deep_crab(ab_low_tol, ab_up_tol, bc_low_tol, bc_up_tol, cd_low_tol, cd_up_tol, ad_low_tol, ad_up_tol)
bullish deep crab harmonic pattern condition
Parameters:
ab_low_tol (float)
ab_up_tol (float)
bc_low_tol (float)
bc_up_tol (float)
cd_low_tol (float)
cd_up_tol (float)
ad_low_tol (float)
ad_up_tol (float)
Returns: bool
bear_cypher(ab_low_tol, ab_up_tol, bc_low_tol, bc_up_tol, cd_low_tol, cd_up_tol, xc_low_tol, xc_up_tol)
bearish cypher harmonic pattern condition
Parameters:
ab_low_tol (float)
ab_up_tol (float)
bc_low_tol (float)
bc_up_tol (float)
cd_low_tol (float)
cd_up_tol (float)
xc_low_tol (float)
xc_up_tol (float)
Returns: bool
bull_cypher(ab_low_tol, ab_up_tol, bc_low_tol, bc_up_tol, cd_low_tol, cd_up_tol, xc_low_tol, xc_up_tol)
bullish cypher harmonic pattern condition
Parameters:
ab_low_tol (float)
ab_up_tol (float)
bc_low_tol (float)
bc_up_tol (float)
cd_low_tol (float)
cd_up_tol (float)
xc_low_tol (float)
xc_up_tol (float)
Returns: bool
bear_gartley(ab_low_tol, ab_up_tol, bc_low_tol, bc_up_tol, cd_low_tol, cd_up_tol, ad_low_tol, ad_up_tol)
bearish gartley harmonic pattern condition
Parameters:
ab_low_tol (float)
ab_up_tol (float)
bc_low_tol (float)
bc_up_tol (float)
cd_low_tol (float)
cd_up_tol (float)
ad_low_tol (float)
ad_up_tol (float)
Returns: bool
bull_gartley(ab_low_tol, ab_up_tol, bc_low_tol, bc_up_tol, cd_low_tol, cd_up_tol, ad_low_tol, ad_up_tol)
bullish gartley harmonic pattern condition
Parameters:
ab_low_tol (float)
ab_up_tol (float)
bc_low_tol (float)
bc_up_tol (float)
cd_low_tol (float)
cd_up_tol (float)
ad_low_tol (float)
ad_up_tol (float)
Returns: bool
bear_shark(ab_low_tol, ab_up_tol, bc_low_tol, bc_up_tol, xc_low_tol, xc_up_tol)
bearish shark harmonic pattern condition
Parameters:
ab_low_tol (float)
ab_up_tol (float)
bc_low_tol (float)
bc_up_tol (float)
xc_low_tol (float)
xc_up_tol (float)
Returns: bool
bull_shark(ab_low_tol, ab_up_tol, bc_low_tol, bc_up_tol, xc_low_tol, xc_up_tol)
bullish shark harmonic pattern condition
Parameters:
ab_low_tol (float)
ab_up_tol (float)
bc_low_tol (float)
bc_up_tol (float)
xc_low_tol (float)
xc_up_tol (float)
Returns: bool
bear_three_drive(x1_low_tol, a1_low_tol, a1_up_tol, a2_low_tol, a2_up_tol, b2_low_tol, b2_up_tol, b3_low_tol, b3_upt_tol)
bearish three drive harmonic pattern condition
Parameters:
x1_low_tol (float)
a1_low_tol (float)
a1_up_tol (float)
a2_low_tol (float)
a2_up_tol (float)
b2_low_tol (float)
b2_up_tol (float)
b3_low_tol (float)
b3_upt_tol (float)
Returns: bool
bull_three_drive(x1_low_tol, a1_low_tol, a1_up_tol, a2_low_tol, a2_up_tol, b2_low_tol, b2_up_tol, b3_low_tol, b3_upt_tol)
bullish three drive harmonic pattern condition
Parameters:
x1_low_tol (float)
a1_low_tol (float)
a1_up_tol (float)
a2_low_tol (float)
a2_up_tol (float)
b2_low_tol (float)
b2_up_tol (float)
b3_low_tol (float)
b3_upt_tol (float)
Returns: bool
asc_broadening()
ascending broadening pattern condition
Returns: bool
broadening()
broadening pattern condition
Returns: bool
desc_broadening()
descending broadening pattern condition
Returns: bool
double_bot(low_tol, up_tol)
double bottom pattern condition
Parameters:
low_tol (float)
up_tol (float)
Returns: bool
double_top(low_tol, up_tol)
double top pattern condition
Parameters:
low_tol (float)
up_tol (float)
Returns: bool
triple_bot(low_tol, up_tol)
triple bottom pattern condition
Parameters:
low_tol (float)
up_tol (float)
Returns: bool
triple_top(low_tol, up_tol)
triple top pattern condition
Parameters:
low_tol (float)
up_tol (float)
Returns: bool
bear_elliot()
bearish elliot wave pattern condition
Returns: bool
bull_elliot()
bullish elliot wave pattern condition
Returns: bool
bear_alt_flag(ab_ratio, bc_ratio)
bearish alternate flag pattern condition
Parameters:
ab_ratio (float)
bc_ratio (float)
Returns: bool
bull_alt_flag(ab_ratio, bc_ratio)
bullish alternate flag pattern condition
Parameters:
ab_ratio (float)
bc_ratio (float)
Returns: bool
bear_flag(ab_ratio, bc_ratio, be_ratio)
bearish flag pattern condition
Parameters:
ab_ratio (float)
bc_ratio (float)
be_ratio (float)
Returns: bool
bull_flag(ab_ratio, bc_ratio, be_ratio)
bullish flag pattern condition
Parameters:
ab_ratio (float)
bc_ratio (float)
be_ratio (float)
Returns: bool
bear_asc_head_shoulders()
bearish ascending head and shoulders pattern condition
Returns: bool
bull_asc_head_shoulders()
bullish ascending head and shoulders pattern condition
Returns: bool
bear_desc_head_shoulders()
bearish descending head and shoulders pattern condition
Returns: bool
bull_desc_head_shoulders()
bullish descending head and shoulders pattern condition
Returns: bool
bear_head_shoulders()
bearish head and shoulders pattern condition
Returns: bool
bull_head_shoulders()
bullish head and shoulders pattern condition
Returns: bool
bear_pennant(ab_ratio, bc_ratio)
bearish pennant pattern condition
Parameters:
ab_ratio (float)
bc_ratio (float)
Returns: bool
bull_pennant(ab_ratio, bc_ratio)
bullish pennant pattern condition
Parameters:
ab_ratio (float)
bc_ratio (float)
Returns: bool
asc_wedge()
ascending wedge pattern condition
Returns: bool
desc_wedge()
descending wedge pattern condition
Returns: bool
wedge()
wedge pattern condition
Returns: bool

Crab Harmonic Pattern [TradingFinder] Harmonic Chart patterns🔵 Introduction
The Crab pattern is recognized as a reversal pattern in technical analysis, utilizing Fibonacci numbers and percentages for chart analysis. This pattern can predict suitable price reversal areas on charts using Fibonacci ratios.
The structure of the Crab pattern can manifest in both bullish and bearish forms on the chart. By analyzing this structure, traders can identify points where the price direction changes, which are essential for making informed trading decisions.
The pattern's structure is visually represented on charts as shown below. To gain a deeper understanding of the Crab pattern's functionality, it is beneficial to become familiar with its various harmonic forms.
🟣 Types of Crab Patterns
The Crab pattern is categorized into two types based on its structure: bullish and bearish. The bullish Crab is denoted by the letter M, while the bearish Crab is indicated by the letter W in technical analysis.
Typically, a bullish Crab pattern signals a potential price increase, whereas a bearish Crab pattern suggests a potential price decrease on the chart.
The direction of price movement depends significantly on the price's position within the chart. By identifying whether the pattern is bullish or bearish, traders can determine the likely direction of the price reversal.
Bullish Crab :
Bearish Crab :
🔵 How to Use
When trading using the Crab pattern, crucial parameters include the end time of the correction and the point at which the chart reaches its peak. Generally, the best time to buy is when the chart nears the end of its correction, and the best time to sell is when it approaches the peak price.
As we discussed, the end of the price correction and the time to reach the peak are measured using Fibonacci ratios. By analyzing these levels, traders can estimate the end of the correction in the chart waves and select a buying position for their stock or asset upon reaching that ratio.
🟣 Bullish Crab Pattern
In this pattern, the stock price is expected to rise at the pattern's completion, transitioning into an upward trend. The bullish Crab pattern usually begins with an upward trend, followed by a price correction, after which the stock resumes its upward movement.
If a deeper correction occurs, the price will change direction at some point on the chart and rise again towards its target price. Price corrections play a critical role in this pattern, as it aims to identify entry and exit points using Fibonacci ratios, allowing traders to make purchases at the end of the corrections.
When the price movement lines are connected on the chart, the bullish Crab pattern resembles the letter M.
🟣 Bearish Crab Pattern
In this pattern, the stock price is expected to decline at the pattern's completion, leading to a strong downward trend. The bearish Crab pattern typically starts with a price correction in a downward trend and, after several fluctuations, reaches a peak where the direction changes downward, resulting in a significant price drop.
This pattern uses Fibonacci ratios to identify points where the price movement is likely to change direction, enabling traders to exit their positions at the chart's peak. When the price movement lines are connected on the chart, the bearish Crab pattern resembles the letter W.
🔵 Setting
🟣 Logical Setting
ZigZag Pivot Period : You can adjust the period so that the harmonic patterns are adjusted according to the pivot period you want. This factor is the most important parameter in pattern recognition.
Show Valid Format : If this parameter is on "On" mode, only patterns will be displayed that they have exact format and no noise can be seen in them. If "Off" is, the patterns displayed that maybe are noisy and do not exactly correspond to the original pattern.
Show Formation Last Pivot Confirm : if Turned on, you can see this ability of patterns when their last pivot is formed. If this feature is off, it will see the patterns as soon as they are formed. The advantage of this option being clear is less formation of fielded patterns, and it is accompanied by the latest pattern seeing and a sharp reduction in reward to risk.
Period of Formation Last Pivot : Using this parameter you can determine that the last pivot is based on Pivot period.
🟣 Genaral Setting
Show : Enter "On" to display the template and "Off" to not display the template.
Color : Enter the desired color to draw the pattern in this parameter.
LineWidth : You can enter the number 1 or numbers higher than one to adjust the thickness of the drawing lines. This number must be an integer and increases with increasing thickness.
LabelSize : You can adjust the size of the labels by using the "size.auto", "size.tiny", "size.smal", "size.normal", "size.large" or "size.huge" entries.
🟣 Alert Setting
Alert : On / Off
Message Frequency : This string parameter defines the announcement frequency. Choices include: "All" (activates the alert every time the function is called), "Once Per Bar" (activates the alert only on the first call within the bar), and "Once Per Bar Close" (the alert is activated only by a call at the last script execution of the real-time bar upon closing). The default setting is "Once per Bar".
Show Alert Time by Time Zone : The date, hour, and minute you receive in alert messages can be based on any time zone you choose. For example, if you want New York time, you should enter "UTC-4". This input is set to the time zone "UTC" by default.

Auto Volume Spread Analysis (VSA) [TANHEF]Auto Volume Spread Analysis (visible volume and spread bars auto-scaled): Understanding Market Intentions through the Interpretation of Volume and Price Movements.
All the sections below contain the same descriptions as my other indicator "Volume Spread Analysis" with the exception of 'Auto Scaling'.
█ Auto-Scaling
This indicator auto-scales spread bars to match the visible volume bars, unlike the previous "Volume Spread Analysis " version which limited the number of visible spread bars to a fixed count. The auto-scaling feature allows for easier navigation through historical data, enabling both more historical spread bars to be viewed and more historical VSA pattern labels being displayed without requiring using the bar replay tool. Please note that this indicator’s auto-scaling feature recalculates the visible bars on the chart, causing the indicator to reload whenever the chart is moved.
Auto-scaled spread bars have two display options (set via 'Spread Bars Method' setting):
Lines: a bar lookback limit of 500 bars.
Polylines: no bar lookback limit as only plotted on visible bars on chart, which uses multiple polylines are used.
█ Simple Explanation:
The Volume Spread Analysis (VSA) indicator is a comprehensive tool that helps traders identify key market patterns and trends based on volume and spread data. This indicator highlights significant VSA patterns and provides insights into market behavior through color-coded volume/spread bars and identification of bars indicating strength, weakness, and neutrality between buyers and sellers. It also includes powerful volume and spread forecasting capabilities.
█ Laws of Volume Spread Analysis (VSA):
The origin of VSA begins with Richard Wyckoff, a pivotal figure in its development. Wyckoff made significant contributions to trading theory, including the formulation of three basic laws:
The Law of Supply and Demand: This fundamental law states that supply and demand balance each other over time. High demand and low supply lead to rising prices until demand falls to a level where supply can meet it. Conversely, low demand and high supply cause prices to fall until demand increases enough to absorb the excess supply.
The Law of Cause and Effect: This law assumes that a 'cause' will result in an 'effect' proportional to the 'cause'. A strong 'cause' will lead to a strong trend (effect), while a weak 'cause' will lead to a weak trend.
The Law of Effort vs. Result: This law asserts that the result should reflect the effort exerted. In trading terms, a large volume should result in a significant price move (spread). If the spread is small, the volume should also be small. Any deviation from this pattern is considered an anomaly.
█ Volume and Spread Analysis Bars:
Display: Volume and spread bars that consist of color coded levels, with the spread bars scaled to match the volume bars. A displayable table (Legend) of bar colors and levels can give context and clarify to each volume/spread bar.
Calculation: Levels are calculated using multipliers applied to moving averages to represent key levels based on historical data: low, normal, high, ultra. This method smooths out short-term fluctuations and focuses on longer-term trends.
Low Level: Indicates reduced volatility and market interest.
Normal Level: Reflects typical market activity and volatility.
High Level: Indicates increased activity and volatility.
Ultra Level: Identifies extreme levels of activity and volatility.
This illustrates the appearance of Volume and Spread bars when scaled and plotted together:
█ Forecasting Capabilities:
Display: Forecasted volume and spread levels using predictive models.
Calculation: Volume and Spread prediction calculations differ as volume is linear and spread is non-linear.
Volume Forecast (Linear Forecasting): Predicts future volume based on current volume rate and bar time till close.
Spread Forecast (Non-Linear Dynamic Forecasting): Predicts future spread using a dynamic multiplier, less near midpoint (consolidation) and more near low or high (trending), reflecting non-linear expansion.
Moving Averages: In forecasting, moving averages utilize forecasted levels instead of actual levels to ensure the correct level is forecasted (low, normal, high, or ultra).
The following compares forecasted volume with actual resulting volume, highlighting the power of early identifying increased volume through forecasted levels:
█ VSA Patterns:
Criteria and descriptions for each VSA pattern are available as tooltips beside them within the indicator’s settings. These tooltips provide explanations of potential developments based on the volume and spread data.
Signs of Strength (🟢): Patterns indicating strong buying pressure and potential market upturns.
Down Thrust
Selling Climax
No Effort ➤ Bearish Result
Bearish Effort ➤ No Result
Inverse Down Thrust
Failed Selling Climax
Bull Outside Reversal
End of Falling Market (Bag Holder)
Pseudo Down Thrust
No Supply
Signs of Weakness (🔴): Patterns indicating strong selling pressure and potential market downturns.
Up Thrust
Buying Climax
No Effort ➤ Bullish Result
Bullish Effort ➤ No Result
Inverse Up Thrust
Failed Buying Climax
Bear Outside Reversal
End of Rising Market (Bag Seller)
Pseudo Up Thrust
No Demand
Neutral Patterns (🔵): Patterns indicating market indecision and potential for continuation or reversal.
Quiet Doji
Balanced Doji
Strong Doji
Quiet Spinning Top
Balanced Spinning Top
Strong Spinning Top
Quiet High Wave
Balanced High Wave
Strong High Wave
Consolidation
Bar Patterns (🟡): Common candlestick patterns that offer insights into market sentiment. These are required in some VSA patterns and can also be displayed independently.
Bull Pin Bar
Bear Pin Bar
Doji
Spinning Top
High Wave
Consolidation
This demonstrates the acronym and descriptive options for displaying bar patterns, with the ability to hover over text to reveal the descriptive text along with what type of pattern:
█ Alerts:
VSA Pattern Alerts: Notifications for identified VSA patterns at bar close.
Volume and Spread Alerts: Alerts for confirmed and forecasted volume/spread levels (Low, High, Ultra).
Forecasted Volume and Spread Alerts: Alerts for forecasted volume/spread levels (High, Ultra) include a minimum percent time elapsed input to reduce false early signals by ensuring sufficient bar time has passed.
█ Inputs and Settings:
Indicator Bar Color: Select color schemes for bars (Normal, Detail, Levels).
Indicator Moving Average Color: Select schemes for bars (Fill, Lines, None).
Price Bar Colors: Options to color price bars based on VSA patterns and volume levels.
Legend: Display a table of bar colors and levels for context and clarity of volume/spread bars.
Forecast: Configure forecast display and prediction details for volume and spread.
Average Multipliers: Define multipliers for different levels (Low, High, Ultra) to refine the analysis.
Moving Average: Set volume and spread moving average settings.
VSA: Select the VSA patterns to be calculated and displayed (Strength, Weakness, Neutral).
Bar Patterns: Criteria for bar patterns used in VSA (Doji, Bull Pin Bar, Bear Pin Bar, Spinning Top, Consolidation, High Wave).
Colors: Set exact colors used for indicator bars, indicator moving averages, and price bars.
More Display Options: Specify how VSA pattern text is displayed (Acronym, Descriptive), positioning, and sizes.
Alerts: Configure alerts for VSA patterns, volume, and spread levels, including forecasted levels.
█ Usage:
The Volume Spread Analysis indicator is a helpful tool for leveraging volume spread analysis to make informed trading decisions. It offers comprehensive visual and textual cues on the chart, making it easier to identify market conditions, potential reversals, and continuations. Whether analyzing historical data or forecasting future trends, this indicator provides insights into the underlying factors driving market movements.

Non-Sinusoidal Multi-Layered Moving Average OscillatorThis indicator utilizes multiple moving averages (MAs) of different lengths their difference and its rate of change to provide a comprehensive view of both short-term and long-term market trends. The output signal is characterized by its non-sinusoidal nature, offering distinct advantages in trend analysis and market forecasting.
Combining the difference between two moving averages with the ROC allows to assess not only the direction and strength of the trend but also the momentum behind it. Transforming these signal in to non-sinusoidal output enhances its utility.
The indicator allows traders to select any one or more of seven moving average options. Larger timeframes (e.g., MA89/MA144) provide a broader identification of the overall trend, helping to understand the general market direction. Smaller timeframes (e.g., MA5/MA8) are more sensitive to price changes and can indicate better entry and exit points, aiding in the identification of retracements and pullbacks. By combining multiple timeframes, traders can get a comprehensive view of the market, enabling more precise and informed trading decisions.
Key Features:
Multiple Moving Averages:
The indicator calculates several exponential moving averages (EMAs) based on different lengths: MA5, MA8, MA13, MA21, MA34, MA55, MA89, and MA144.
These MAs are further smoothed using a secondary exponential moving average, with the smoothing length customizable by the user.
Percentage Differences:
The indicator computes the percentage differences between successive MAs (e.g., (MA5 - MA8) / MA8 * 100). These differences highlight the relative movement of prices over different periods, providing insights into market momentum and trend strength.
Short-term MA differences (e.g., MA5/MA8) are more sensitive to recent price changes, making them useful for detecting quick market movements.
Long-term MA differences (e.g., MA89/MA144) smooth out short-term fluctuations, helping to identify major trends.
Rate of Change (ROC):
The indicator applies the Rate of Change (ROC) to the percentage differences of the MAs. ROC measures the speed at which the percentage differences are changing over time, providing an additional layer of trend analysis.
ROC helps in understanding the acceleration or deceleration of market trends, indicating the strength and potential reversals.
Transformations:
The percentage differences undergo a series of mathematical transformations (either inverse hyperbolic sine transformation or inverse fisher transformation) to refine the signal and enhance its interpretability. These transformations include adjustments to stabilize the values and highlight significant movements.
checkbox allows users to select which mathematical transformations to use.
Non-Sinusoidal Nature:
The output signal of this indicator is non-sinusoidal, characterized by abrupt changes and distinct patterns rather than smooth, wave-like oscillations.
The non-sinusoidal signal provides clearer demarcations of trend changes and is more responsive to sudden market shifts.
This nature reduces the lag typically associated with sinusoidal indicators, allowing for more timely and accurate trading decisions.
Customizable Options:
Users can select which MA pairs to include in the analysis using checkboxes. This flexibility allows the indicator to adapt to different trading strategies, whether focused on short-term movements or long-term trends.
Visual Representation:
The indicator plots the transformed values on a separate panel, making it easy for traders to visualize the trends and potential entry or exit points.
Usage Scenarios:
Short-Term Trading: By focusing on shorter MAs (e.g., MA5/MA8), traders can capture quick market movements and identify short-term trends.
Long-Term Analysis: Utilizing longer MAs (e.g., MA89/MA144) helps in identifying major market trends.
Combination of MAs: The ability to mix different MA lengths provides a balanced view, helping traders make decisions based on both immediate price actions and overall market direction.
Practical Benefits:
Early Signal Detection: The sensitivity of short-term MAs provides early signals for potential trend changes, assisting traders in timely decision-making.
Trend Confirmation: Long-term MAs offer stable trend confirmation, reducing the likelihood of false signals in volatile markets.
Noise Reduction: The mathematical transformations and ROC applied to the percentage differences help in filtering out market noise, focusing on meaningful price movements.
Improved Responsiveness: The non-sinusoidal nature of the signal allows the indicator to react more quickly to market changes, providing more accurate and timely trading signals.
Clearer Trend Demarcations: Non-sinusoidal signals make it easier to identify distinct phases of market trends, aiding in better interpretation and decision-making.
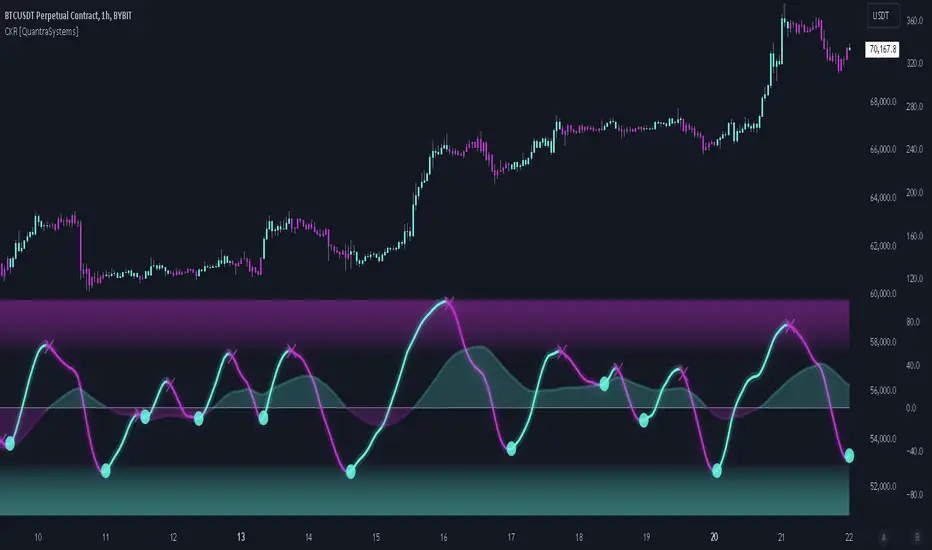
Cosine Kernel Regressions [QuantraSystems]Cosine Kernel Regressions
Introduction
The Cosine Kernel Regressions indicator (CKR) uses mathematical concepts to offer a unique approach to market analysis. This indicator employs Kernel Regressions using bespoke tunable Cosine functions in order to smoothly interpret a variety of market data, providing traders with incredibly clean insights into market trends.
The CKR is particularly useful for traders looking to understand underlying trends without the 'noise' typical in raw price movements. It can serve as a standalone trend analysis tool or be combined with other indicators for more robust trading strategies.
Legend
Fast Trend Signal Line - This is the foreground oscillator, it is colored upon the earliest confirmation of a change in trend direction.
Slow Trend Signal Line - This oscillator is calculated in a similar manner. However, it utilizes a lower frequency within the cosine tuning function, allowing it to capture longer and broader trends in one signal. This allows for tactical trading; the user can trade smaller moves without losing sight of the broader trend.
Case Study
In this case study, the CKR was used alongside the Triple Confirmation Kernel Regression Oscillator (KRO)
Initially, the KRO indicated an oversold condition, which could be interpreted as a signal to enter a long position in anticipation of a price rebound. However, the CKR’s fast trend signal line had not yet confirmed a positive trend direction - suggesting that entering a trade too early and without confirmation could be a mistake.
Waiting for a confirmed positive trend from the CKR proved beneficial for this trade. A few candles after the oversold signal, the CKR's fast trend signal line shifted upwards, indicating a strong upward momentum. This was the optimal entry point suggested by the CKR, occurring after the confirmation of the trend change, which significantly reduced the likelihood of entering during a false recovery or continuation of the downtrend.
This is one of the many uses of the CKR - by timing entries using the fast signal line , traders could avoid unnecessary losses by preventing premature entries.
Methodology
The methodology behind CKR is a multi-layered approach and utilizes many ‘base’ indicators.
Relative Strength Index
Stochastic Oscillator
Bollinger Band Percent
Chande Momentum Oscillator
Commodity Channel Index
Fisher Transform
Volume Zone Oscillator
The calculated output from each indicator is standardized and scaled before being averaged. This prevents any single indicator from overpowering the resulting signal.
// ╔════════════════════════════════╗ //
// ║ Scaling/Range Adjustment ║ //
// ╚════════════════════════════════╝ //
RSI_ReScale (_res ) => ( _res - 50 ) * 2.8
STOCH_ReScale (_stoch ) => ( _stoch - 50 ) * 2
BBPCT_ReScale (_bbpct ) => ( _bbpct - 0.5 ) * 120
CMO_ReScale (_chandeMO ) => ( _chandeMO * 1.15 )
CCI_ReScale (_cci ) => ( _cci / 2 )
FISH_ReScale (_fish1 ) => ( _fish1 * 30 )
VZO_ReScale (_VP, _TV ) => (_VP / _TV) * 110
These outputs are then fed into a customized cosine kernel regression function, which smooths the data, and combines all inputs into a single coherent output.
// ╔════════════════════════════════╗ //
// ║ COSINE KERNEL REGRESSIONS ║ //
// ╚════════════════════════════════╝ //
// Define a function to compute the cosine of an input scaled by a frequency tuner
cosine(x, z) =>
// Where x = source input
// y = function output
// z = frequency tuner
var y = 0.
y := math.cos(z * x)
Y
// Define a kernel that utilizes the cosine function
kernel(x, z) =>
var y = 0.
y := cosine(x, z)
math.abs(x) <= math.pi/(2 * z) ? math.abs(y) : 0. // cos(zx) = 0
// The above restricts the wave to positive values // when x = π / 2z
The tuning of the regression is adjustable, allowing users to fine-tune the sensitivity and responsiveness of the indicator to match specific trading strategies or market conditions. This robust methodology ensures that CKR provides a reliable and adaptable tool for market analysis.
Volume Spread Analysis [TANHEF]Volume Spread Analysis: Understanding Market Intentions through the Interpretation of Volume and Price Movements.
█ Simple Explanation:
The Volume Spread Analysis (VSA) indicator is a comprehensive tool that helps traders identify key market patterns and trends based on volume and spread data. This indicator highlights significant VSA patterns and provides insights into market behavior through color-coded volume/spread bars and identification of bars indicating strength, weakness, and neutrality between buyers and sellers. It also includes powerful volume and spread forecasting capabilities.
█ Laws of Volume Spread Analysis (VSA):
The origin of VSA begins with Richard Wyckoff, a pivotal figure in its development. Wyckoff made significant contributions to trading theory, including the formulation of three basic laws:
The Law of Supply and Demand: This fundamental law states that supply and demand balance each other over time. High demand and low supply lead to rising prices until demand falls to a level where supply can meet it. Conversely, low demand and high supply cause prices to fall until demand increases enough to absorb the excess supply.
The Law of Cause and Effect: This law assumes that a 'cause' will result in an 'effect' proportional to the 'cause'. A strong 'cause' will lead to a strong trend (effect), while a weak 'cause' will lead to a weak trend.
The Law of Effort vs. Result: This law asserts that the result should reflect the effort exerted. In trading terms, a large volume should result in a significant price move (spread). If the spread is small, the volume should also be small. Any deviation from this pattern is considered an anomaly.
█ Volume and Spread Analysis Bars:
Display: Volume and/or spread bars that consist of color coded levels. If both of these are displayed, the number of spread bars can be limited for visual appeal and understanding, with the spread bars scaled to match the volume bars. While automatic calculation of the number of visual bars for auto scaling is possible, it is avoided to prevent the indicator from reloading whenever the number of visual price bars on the chart is adjusted, ensuring uninterrupted analysis. A displayable table (Legend) of bar colors and levels can give context and clarify to each volume/spread bar.
Calculation: Levels are calculated using multipliers applied to moving averages to represent key levels based on historical data: low, normal, high, ultra. This method smooths out short-term fluctuations and focuses on longer-term trends.
Low Level: Indicates reduced volatility and market interest.
Normal Level: Reflects typical market activity and volatility.
High Level: Indicates increased activity and volatility.
Ultra Level: Identifies extreme levels of activity and volatility.
This illustrates the appearance of Volume and Spread bars when scaled and plotted together:
█ Forecasting Capabilities:
Display: Forecasted volume and spread levels using predictive models.
Calculation: Volume and Spread prediction calculations differ as volume is linear and spread is non-linear.
Volume Forecast (Linear Forecasting): Predicts future volume based on current volume rate and bar time till close.
Spread Forecast (Non-Linear Dynamic Forecasting): Predicts future spread using a dynamic multiplier, less near midpoint (consolidation) and more near low or high (trending), reflecting non-linear expansion.
Moving Averages: In forecasting, moving averages utilize forecasted levels instead of actual levels to ensure the correct level is forecasted (low, normal, high, or ultra).
The following compares forecasted volume with actual resulting volume, highlighting the power of early identifying increased volume through forecasted levels:
█ VSA Patterns:
Criteria and descriptions for each VSA pattern are available as tooltips beside them within the indicator’s settings. These tooltips provide explanations of potential developments based on the volume and spread data.
Signs of Strength (🟢): Patterns indicating strong buying pressure and potential market upturns.
Down Thrust
Selling Climax
No Effort → Bearish Result
Bearish Effort → No Result
Inverse Down Thrust
Failed Selling Climax
Bull Outside Reversal
End of Falling Market (Bag Holder)
Pseudo Down Thrust
No Supply
Signs of Weakness (🔴): Patterns indicating strong selling pressure and potential market downturns.
Up Thrust
Buying Climax
No Effort → Bullish Result
Bullish Effort → No Result
Inverse Up Thrust
Failed Buying Climax
Bear Outside Reversal
End of Rising Market (Bag Seller)
Pseudo Up Thrust
No Demand
Neutral Patterns (🔵): Patterns indicating market indecision and potential for continuation or reversal.
Quiet Doji
Balanced Doji
Strong Doji
Quiet Spinning Top
Balanced Spinning Top
Strong Spinning Top
Quiet High Wave
Balanced High Wave
Strong High Wave
Consolidation
Bar Patterns (🟡): Common candlestick patterns that offer insights into market sentiment. These are required in some VSA patterns and can also be displayed independently.
Bull Pin Bar
Bear Pin Bar
Doji
Spinning Top
High Wave
Consolidation
This demonstrates the acronym and descriptive options for displaying bar patterns, with the ability to hover over text to reveal the descriptive text along with what type of pattern:
█ Alerts:
VSA Pattern Alerts: Notifications for identified VSA patterns at bar close.
Volume and Spread Alerts: Alerts for confirmed and forecasted volume/spread levels (Low, High, Ultra).
Forecasted Volume and Spread Alerts: Alerts for forecasted volume/spread levels (High, Ultra) include a minimum percent time elapsed input to reduce false early signals by ensuring sufficient bar time has passed.
█ Inputs and Settings:
Display Volume and/or Spread: Choose between displaying volume bars, spread bars, or both with different lookback periods.
Indicator Bar Color: Select color schemes for bars (Normal, Detail, Levels).
Indicator Moving Average Color: Select schemes for bars (Fill, Lines, None).
Price Bar Colors: Options to color price bars based on VSA patterns and volume levels.
Legend: Display a table of bar colors and levels for context and clarity of volume/spread bars.
Forecast: Configure forecast display and prediction details for volume and spread.
Average Multipliers: Define multipliers for different levels (Low, High, Ultra) to refine the analysis.
Moving Average: Set volume and spread moving average settings.
VSA: Select the VSA patterns to be calculated and displayed (Strength, Weakness, Neutral).
Bar Patterns: Criteria for bar patterns used in VSA (Doji, Bull Pin Bar, Bear Pin Bar, Spinning Top, Consolidation, High Wave).
Colors: Set exact colors used for indicator bars, indicator moving averages, and price bars.
More Display Options: Specify how VSA pattern text is displayed (Acronym, Descriptive), positioning, and sizes.
Alerts: Configure alerts for VSA patterns, volume, and spread levels, including forecasted levels.
█ Usage:
The Volume Spread Analysis indicator is a helpful tool for leveraging volume spread analysis to make informed trading decisions. It offers comprehensive visual and textual cues on the chart, making it easier to identify market conditions, potential reversals, and continuations. Whether analyzing historical data or forecasting future trends, this indicator provides insights into the underlying factors driving market movements.

Weighted Moving Range with Trend Signals (WMR-TS)Weighted Moving Range with Trend Signals (WMR-TS)
Technical analysis involves analyzing statistical trends from trading activity , such as price movement and volume, to make trading decisions. Technical indicators are mathematical calculations based on the price, volume, or open interest of a security or contract. They are used by traders to analyze price movements and predict future market behavior. The WMR-TS indicator combines weighted moving averages and range calculations to identify key trading levels and generate buy/sell signals. It dynamically adjusts to market conditions, offering traders insights into potential support, resistance, and trend reversal points. Key levels are color-coded for quick interpretation. It utilizes weighted moving averages (WMA) and range calculations to determine these levels, making it a robust tool for both trending and ranging markets.
SUMMARY
Parameters :
WMA Length : Determines the length for the primary weighted moving average.
Highest High Length : Sets the period for calculating the highest high.
Lowest Low Length : Sets the period for calculating the lowest low.
Range Corrector : Adjusts the range calculation slightly for fine-tuning.
Top Level : Multiplier for determining the top level from the calculated range.
Bottom Level : Multiplier for determining the bottom level from the calculated range.
Levels Visibility : Sets how many recent bars will display the levels.
Trading Zones :
Short Area : Highlighted zone indicating potential shorting opportunities.
Long Area : Highlighted zone indicating potential buying opportunities.
The Levels :
Wave (Yellow): Midpoint of the calculated range, adjusted by WMA.
Top Level (Red): Calculated upper boundary of the trading range.
Sell Level (Pink): Intermediate sell level.
Resistance Level (Magenta): Immediate resistance level.
Support Level (Cyan): Immediate support level.
Buy Level (Light Green): Intermediate buy level.
Bottom Level (Dark Green): Calculated lower boundary of the trading range.
Interpreting the Signals :
Hammer Signal : Red circles above bars indicate potential sell signals.
Rocket Signal : Green circles below bars indicate potential buy signals.
KEY CONCEPTS
Highest High and Lowest Low :
These values represent the highest high ( HH ) and lowest low ( LL ) over a specified number of periods.
Support Level :
This is the lower boundary of the trading range. It is a price level where demand is strong enough to prevent the price from falling further. As the price approaches the support level, it is likely to bounce back up.
Resistance Level :
This is the upper boundary of the trading range. It is a price level where supply is strong enough to prevent the price from rising further. As the price approaches the resistance level, it is likely to pull back down.
THE USE OF MULTIPLIERS :
The script uses several multipliers to adjust and fine-tune the calculated support and resistance levels, as well as to control the range and sensitivity of these levels. Here is a detailed explanation of these multipliers and their purpose:
Range Corrector : This multiplier adjusts the calculated high ( H ) and low ( L ) levels, adding flexibility to how these levels are positioned relative to the highest high and lowest low. It ranges from -1 to 1 , with a default value of 0 . The use of positive values increase the range, making the calculated levels further apart. Thus, using negative values decrease the range, bringing the calculated levels closer together.
Top Level : This multiplier adjusts the distance of the top level from the calculated high H ) level. It fluctuates from 0 to 2 , with a default value of 0.382 . Higher values will push the top level further above the high level, while lower values will bring it closer.
Bottom Level : This multiplier adjusts the distance of the bottom support level from the calculated low support level. Ranging from 0 to 2, with a default value of 0.214, the higher values will push the bottom level further below the low level, while lower values will bring it closer.
The script plots the support and resistance levels on the chart, allowing traders to visualize the trading range. Color-coded zones are used to indicate areas where buying or selling opportunities may arise based on the current price relative to the trading range. A trading range refers to the area between a price's support and resistance levels over a specific period of time. Within this range, the price of the security fluctuates up and down but does not break out above the resistance or below the support. Support and resistance levels to make trading decisions. Buying near the support level and selling near the resistance level is a common strategy. When the price moves above the resistance level, it is called a breakout . A breakout often indicates that the price may start a new upward trend . Conversely, when the price moves below the support level, it is called a breakdown . A breakdown often indicates that the price may start a new downward trend . By understanding and utilizing trading ranges, traders can make more informed decisions, optimize their trading strategies, and manage risk more effectively.
Understanding Moving Averages
A moving average (MA) is a widely used technical indicator that helps smooth out price data by creating a constantly updated average price. The main purpose of using a moving average is to identify the direction of the trend and to reduce the "noise" of random price fluctuations. The Weighted Moving Average ( WMA ) assigns different weights to each period, with more recent periods typically given more weight. A 10-day WMA might give the most recent day a weight of 10, the second most recent day a weight of 9, and so on. It is useful for traders who want to emphasize recent price data more than older data. When the price is above the moving average, it suggests an Bullish trend . A Bearish Trend is expected to take place when the price is below the moving average. Understanding the price reactions around these levels can be used to make trading decisions.
APPLYING CONCEPTS
Support and Resistance Calculations in the Script :
The script calculates dynamic support and resistance levels using weighted moving averages ( WMA s) and the highest high and lowest low over specified periods. Buy ( Rocket ) and sell ( Hammer ) signals are generated based on the crossing of the price with calculated top and bottom levels.These signals help traders identify potential entry and exit points within the trading range .
Weighted Moving Average (WMA) Application in the Script
This script calculates a special trendWMA using the close price that helps in creating a more dynamic moving average that considers both high and low price actions. This modified WMA is used in conjunction with highest high and lowest low values over specified periods to calculate dynamic support and resistance levels.
Explanation of the Levels in the Script
By understanding these levels, traders can make more informed decisions about where to enter and exit trades, manage risk, and anticipate potential market movements. The script incorporates several key levels levels that traders can use to better anticipate price movements and make more informed trading decisions. Leveraging the principles of Fibonacci retracement ratios ( 23.6%, 38.2%, 50%, 61.8%, and 100% ) to identify key support and resistance zones can also serve for gauging the overall market sentiment.
Top Level and Sell Leve l: Used to identify potential resistance zones where the price may reverse or pause.
Support Level and Buy Level : Used to identify potential support zones where the price may bounce.
Upper and Lower Pivot Values : Serve as intermediate levels for possible price retracements or extensions within the trading range.
Wave Level : Indicates the central trend direction, which can be useful for gauging the overall market sentiment.
Alerts are a crucial part of the script as they notify traders of potential buy and sell signals based on predefined conditions. There are two main alerts: one for a " Hammer " signal (sell condition) and one for a " Rocket " signal (buy condition).
Adjust the input parameters to fit your trading style and the specific asset being analyzed. Shorter lengths may be more responsive to price changes but can produce more false signals , while longer lengths provide smoother signals but may lag . Always backtest the indicator on historical data to understand its behavior and performance. Also remember that different markets may require different parameter settings for optimal performance.
Keep in mind that by nature like all moving averages, WMAs lag behind price action. This means that signals may be delayed. The indicator performs differently in various market conditions. Always consider the overall market context when interpreting signals.
Adjusting parameters like the range corrector and visibility can help tailor the indicator to specific market conditions or trading strategies, improving its effectiveness. The script uses the calculated levels to plot lines and fill zones on the chart, helping traders visualize potential support, resistance, and trend reversal points. The use of multipliers allows for dynamic adjustment of these levels, making the indicator flexible and adaptable to different market conditions.
I think traders can make more informed decisions about where to enter and exit trades, manage risk, and anticipate potential market movements following this code. Stay safe and always remember that market is always changing. Use this tool if you want, please stay informed and plan safe trades,
D.

MACD 4C with DivergenceMACD 4C Indicator with Divergence
This indicator, named MACD 4C, enhances the traditional MACD (Moving Average Convergence Divergence) by providing a visually intuitive representation with four distinct colors for the histogram bars. It offers a clear interpretation of market momentum and potential trend reversals.
Key Features:
Customizable Parameters: Users can adjust the fast and slow moving average periods along with the signal smoothing parameter to tailor the indicator to their preferred trading style and market conditions.
Four-color Histogram: The histogram bars are color-coded for easy interpretation. Lime and green bars indicate increasing bullish momentum, while maroon and red bars signify increasing bearish momentum.
Bullish and Bearish Divergence Detection: The indicator identifies bullish and bearish divergences between the MACD histogram and price action. Bullish divergence occurs when the price makes a lower low while the MACD histogram forms a higher low, indicating potential bullish reversal. Conversely, bearish divergence occurs when the price makes a higher high while the MACD histogram forms a lower high, suggesting a potential bearish reversal.
How to Use:
Trend Confirmation: Monitor the color of the histogram bars. A series of green (or lime) bars suggests a strengthening bullish trend, while a series of red (or maroon) bars indicates a strengthening bearish trend.
Divergence Identification: Watch for divergences between the MACD histogram and price action. Bullish divergence may signal a potential bullish reversal, while bearish divergence may indicate a potential bearish reversal. These signals can be used in conjunction with other technical analysis tools to confirm trade entries and exits.
The MACD 4C indicator was developed by user vkno422 You can find the original author and their work on their TradingView profile: www.tradingview.com

Hurst Future Lines of Demarcation StrategyJ. M. Hurst introduced a concept in technical analysis known as the Future Line of Demarcation (FLD), which serves as a forward-looking tool by incorporating a simple yet profound line into future projections on a financial chart. Specifically, the FLD is constructed by offsetting the price half a cycle ahead into the future on the time axis, relative to the Hurst Cycle of interest. For instance, in the context of a 40 Day Cycle, the FLD would be represented by shifting the current price data 20 days forward on the chart, offering an idea of future price movement anticipations.
The utility of FLDs extends into three critical areas of insight, which form the backbone of the FLD Trading Strategy:
A price crossing the FLD signifies the confirmation of either a peak or trough formation, indicating pivotal moments in price action.
Such crossings also help determine precise price targets for the upcoming peak or trough, aligned with the cycle of examination.
Additionally, the occurrence of a peak in the FLD itself signals a probable zone where the price might experience a trough, helping to anticipate of future price movements.
These insights by Hurst in his "Cycles Trading Course" during the 1970s, are instrumental for traders aiming to determine entry and exit points, and to forecast potential price movements within the market.
To use the FLD Trading Strategy, for example when focusing on the 40 Day Cycle, a trader should primarily concentrate on the interplay between three Hurst Cycles:
The 20 Day FLD (Signal) - Half the length of the Trade Cycle
The 40 Day FLD (Trade) - The Cycle you want to trade
The 80 Day FLD (Trend) - Twice the length of the Trade Cycle
Traders can gauge trend or consolidation by watching for two critical patterns:
Cascading patterns, characterized by several FLDs running parallel with a consistent separation, typically emerge during pronounced market trends, indicating strong directional momentum.
Consolidation patterns, on the other hand, occur when multiple FLDs intersect and navigate within the same price bandwidth, often reversing direction to traverse this range multiple times. This tangled scenario results in the formation of Pause Zones, areas where price momentum is likely to temporarily stall or where the emergence of a significant trend might be delayed.
This simple FLD indicator provides 3 FLDs with optional source input and smoothing, A-through-H FLD interaction background, adjustable “Close the Trade” triggers, and a simple strategy for backtesting it all.
The A-through-H FLD interactions are a framework designed to classify the different types of price movements as they intersect with or diverge from the Future Line of Demarcation (FLD). Each interaction (designated A through H by color) represents a specific phase or characteristic within the cycle, and understanding these can help traders anticipate future price movements and make informed decisions.
The adjustable “Close the Trade” triggers are for setting the crossover/under that determines the trade exits. The options include: Price, Signal FLD, Trade FLD, or Trend FLD. For example, a trader may want to exit trades only when price finally crosses the Trade FLD line.
Shoutouts & Credits for all the raw code, helpful information, ideas & collaboration, conversations together, introductions, indicator feedback, and genuine/selfless help:
🏆 @TerryPascoe
🏅 @Hpotter
👏 @parisboy

Ghost Tangent Crossings [ChartPrime]Ghost Tangent Crossings (ChartPrime) is a revolutionary way to visualize pivot points and zig-zag patterns that utilizes ellipses. This indicator makes sure that each pivot is plotted from high to low, ensuring a correct zig-zag wave pattern. Before a zig-zag is confirmed Ghost Tangent Crossings (ChartPrime) plots an estimate of the next valid move allowing you to plan well ahead of time. Once it is confirmed, the indicator will fill in the plot with a solid color and print a break label.
Unlike other zig-zag or pivot point indicators, Ghost Tangent Crossings (ChartPrime) only has a pivot lookforward input. This is because the lookback is automatically adjusted based on the last known zig-zag. This allows the indicator to dynamically look for the most recent valid market movement. The equipoint is calculated as the point along the ellipse with an equal change in price on either side. From this point we plot a line with the slope at that location and when the price breaks this level a break label is plotted. Alternatively you can plot this point as a horizontal line. This area works as support and resistance for the market as its the point where the balance in movement is found. We feel that this is a simple and elegant solution to connected zig-zag patterns that utilizes a novel method of visualization that many traders will find useful. With its simple controls and intuitive style, we believe that Ghost Tangent Crossings (ChartPrime) will find a home on most traders charts.
To use Ghost Tangent Crossings (ChartPrime) simply add it to your chart and adjust the lookforward to your taste. From there you can adjust the color of the zig-zags and enable or disable any of the visual features. We have included both wick and body pivot types to accommodate most trading style. From there, you are all done and ready to trade!
Enjoy
ZigZag Library [TradingFinder]🔵 Introduction
The "Zig Zag" indicator is an analytical tool that emerges from pricing changes. Essentially, it connects consecutive high and low points in an oscillatory manner. This method helps decipher price changes and can also be useful in identifying traditional patterns.
By sifting through partial price changes, "Zig Zag" can effectively pinpoint price fluctuations within defined time intervals.
🔵 Key Features
1. Drawing the Zig Zag based on Pivot points :
The algorithm is based on pivots that operate consecutively and alternately (switch between high and low swing). In this way, zigzag lines are connected from a swing high to a swing low and from a swing low to a swing high.
Also, with a very low probability, it is possible to have both low pivots and high pivots in one candle. In these cases, the algorithm tries to make the best decision to make the most suitable choice.
You can control what period these decisions are based on through the "PiPe" parameter.
2.Naming and labeling each pivot based on its position as "Higher High" (HH), "Lower Low" (LL), "Higher Low" (HL), and "Lower High" (LH).
Additionally, classic patterns such as HH, LH, LL, and HL can be recognized. All traders analyzing financial markets using classic patterns and Elliot Waves can benefit from the "zigzag" indicator to facilitate their analysis.
" HH ": When the price is higher than the previous peak (Higher High).
" HL ": When the price is higher than the previous low (Higher Low).
" LH ": When the price is lower than the previous peak (Lower High).
" LL ": When the price is lower than the previous low (Lower Low).
🔵 How to Use
First, you can add the library to your code as shown in the example below.
import TFlab/ZigZagLibrary_TradingFinder/1 as ZZ
Function "ZigZag" Parameters :
🟣 Logical Parameters
1. HIGH : You should place the "high" value here. High is a float variable.
2. LOW : You should place the "low" value here. Low is a float variable.
3. BAR_INDEX : You should place the "bar_index" value here. Bar_index is an integer variable.
4. PiPe : The desired pivot period for plotting Zig Zag is placed in this parameter. For example, if you intend to draw a Zig Zag with a Swing Period of 5, you should input 5.
PiPe is an integer variable.
Important :
Apart from the "PiPe" indicator, which is part of the customization capabilities of this indicator, you can create a multi-time frame mode for the indicator using 3 parameters "High", "Low" and "BAR_INDEX". In this way, instead of the data of the current time frame, use the data of other time frames.
Note that it is better to use the current time frame data, because using the multi-time frame mode is associated with challenges that may cause bugs in your code.
🟣 Setting Parameters
5. SHOW_LINE : It's a boolean variable. When true, the Zig Zag line is displayed, and when false, the Zig Zag line display is disabled.
6. STYLE_LINE : In this variable, you can determine the style of the Zig Zag line. You can input one of the 3 options: line.style_solid, line.style_dotted, line.style_dashed. STYLE_LINE is a constant string variable.
7. COLOR_LINE : This variable takes the input of the line color.
8. WIDTH_LINE : The input for this variable is a number from 1 to 3, which is used to adjust the thickness of the line that draws the Zig Zag. WIDTH_LINE is an integer variable.
9. SHOW_LABEL : It's a boolean variable. When true, labels are displayed, and when false, label display is disabled.
10. COLOR_LABEL : The color of the labels is set in this variable.
11. SIZE_LABEL : The size of the labels is set in this variable. You should input one of the following options: size.auto, size.tiny, size.small, size.normal, size.large, size.huge.
12. Show_Support : It's a boolean variable that, when true, plots the last support line, and when false, disables its plotting.
13. Show_Resistance : It's a boolean variable that, when true, plots the last resistance line, and when false, disables its plotting.
Suggestion :
You can use the following code snippet to import Zig Zag into your code for time efficiency.
//import Library
import TFlab/ZigZagLibrary_TradingFinder/1 as ZZ
// Input and Setting
// Zig Zag Line
ShZ = input.bool(true , 'Show Zig Zag Line', group = 'Zig Zag') //Show Zig Zag
PPZ = input.int(5 ,'Pivot Period Zig Zag Line' , group = 'Zig Zag') //Pivot Period Zig Zag
ZLS = input.string(line.style_dashed , 'Zig Zag Line Style' , options = , group = 'Zig Zag' )
//Zig Zag Line Style
ZLC = input.color(color.rgb(0, 0, 0) , 'Zig Zag Line Color' , group = 'Zig Zag') //Zig Zag Line Color
ZLW = input.int(1 , 'Zig Zag Line Width' , group = 'Zig Zag')//Zig Zag Line Width
// Label
ShL = input.bool(true , 'Label', group = 'Label') //Show Label
LC = input.color(color.rgb(0, 0, 0) , 'Label Color' , group = 'Label')//Label Color
LS = input.string(size.tiny , 'Label size' , options = , group = 'Label' )//Label size
Show_Support= input.bool(false, 'Show Last Support',
tooltip = 'Last Support' , group = 'Support and Resistance')
Show_Resistance = input.bool(false, 'Show Last Resistance',
tooltip = 'Last Resistance' , group = 'Support and Resistance')
//Call Function
ZZ.ZigZag(high ,low ,bar_index ,PPZ , ShZ ,ZLS , ZLC, ZLW ,ShL , LC , LS , Show_Support , Show_Resistance )

BTC Purchasing Power 2009-20XX! Hello, today I'm going to show you something that shifts our perspective on Bitcoin's value, not just in nominal terms, but adjusted for the real buying power over the years. This Pine Script TAS developed for TradingView does exactly that by taking into account inflation rates from 2009 to the present.
As you know, inflation erodes the purchasing power of money. That $100 in 2009 does not buy you the same amount in goods or services today. The same concept applies to Bitcoin. While we often look at its price in terms of dollars, pounds, or euros, it's crucial to understand what that price really means in terms of purchasing power.
What this script does is adjust the price of Bitcoin for cumulative inflation since 2009, allowing us to see not just how the nominal price has changed, but how its value as a means of purchasing goods and services has evolved.
For example, if we see Bitcoin's price at $60,000 today, that number might seem high compared to its early years. However, when we adjust this price for inflation, we might find that in terms of 2009's purchasing power, the effective price might be somewhat lower. This adjusted price gives us a more accurate reflection of Bitcoin's true value over time.
This script plots two lines on the chart:
The Original BTC Price: This is the unadjusted price of Bitcoin as we typically see it.
BTC Purchasing Power: This line shows Bitcoin's price adjusted for inflation, reflecting how many goods or services Bitcoin could buy at that point in time compared to 2009.
By comparing these lines, we can observe periods where Bitcoin's purchasing power significantly increased, even if the nominal price was not at its peak. This can help us identify moments when Bitcoin was undervalued or overvalued in real terms.
This analysis is crucial for long-term investors and traders who want to understand Bitcoin's value beyond the surface-level price movements. It helps us appreciate Bitcoin's potential as a store of value, especially in contexts where traditional currencies are losing purchasing power due to inflation.
Remember, investing is not just about riding price waves; it's about understanding the underlying value. And that's precisely what this script helps us to uncover

ATH finder showing passed daysATH Finder Showing Passed Days Indicator
Introducing the "ATH Finder Showing Passed Days" – a cutting-edge TradingView indicator meticulously designed for traders and investors focused on capturing and analyzing the all-time highs (ATHs) of financial markets. Whether you're navigating the volatile waves of cryptocurrencies, the dynamic shifts of the stock market, forex, or any other trading instrument, this indicator is your essential tool for highlighting and understanding ATHs with precision.
Core Features:
Dynamic ATH Tracking: Seamlessly identifies and marks the most recent ATHs in any given market, ensuring that you are always up-to-date with significant price levels that matter the most.
Days Since ATH Visualization: Innovatively displays the number of days that have passed since the last ATH was reached. This powerful feature provides crucial insights into market sentiment, offering a clear view of how long the current price has been consolidating or retreating from its peak.
Visual Enhancements: Features a striking yellow arrow precisely at the ATH point, drawing immediate attention to pivotal market moments without cluttering your chart.
Strategic Placement of Information: Incorporates a non-intrusive label placed in the top right corner of your chart, summarizing the ATH value alongside the days elapsed since its occurrence. This approach ensures your chart remains clean and organized, allowing for other analyses to be conducted without distraction.
Customizable to Fit Your Needs: While it's ready to use out of the box, the indicator provides flexibility for customization, making it adaptable to various timeframes and individual trading strategies.
Benefits for Traders and Investors:
Provides a historical context to current price levels, helping to gauge the strength and potential of market trends.
Aids in identifying potential resistance levels, offering strategic insights for entry and exit points.
Enhances market analysis with a clear, visual representation of significant price milestones and their temporal context.
Easy Setup:
To integrate the "ATH Finder Showing Passed Days" indicator into your trading strategy, simply add it from the TradingView Indicators menu to your chart. Customize according to your preferences and let the indicator illuminate your path to more informed decision-making.
Why Choose the ATH Finder Showing Passed Days?
In the quest for market excellence, understanding the nuances of price movements and their historical significance is paramount. The "ATH Finder Showing Passed Days" indicator not only highlights where and when the market reached its zenith but also contextualizes these moments within the broader tapestry of trading days. Equip yourself with the insight to discern the momentum and potential retracements, elevating your trading to new heights.

Genuine Liquidation Delta [Mxwll] - No EstimatesTHANK YOU TradingView for allowing us to upload custom data!!!
As a result, Mxwll Capital is providing an indicator that shows REAL liquidation delta for over 100 cryptocurrencies sourced directly from a popular crypto exchange!
Features
Crypto exchange sourced liquidation delta
Crypto exchange sourced long liquidation daily count
Crypto exchange sourced short liquidation daily count
All provided data extends back 2 years!!
Various aesthetic components to illustrate data
Liquidation delta data (sourced from a popular exchange) is provided for:
1000shib
aave
ada
algo
alice
arb
audio
alpha
ankr
ape
apt
atom
avax
axs
bal
band
bat
bch
bel
blz
blur
bnb
bnx
btc
chr
chz
comp
coti
crv
ctk
dash
defi
doge
dot
dydx
edu
egld
enj
ens
eos
etc
eth
fil
flm
ftm
fxs
gala
gmx
grt
hbar
hnt
icx
id
inj
iost
iota
joe
kava
knc
ksm
ldo
lina
link
lit
lrc
ltc
mana
mask
matic
mkr
near
neo
ocean
omg
one
ont
op
people
qtum
reef
ren
rndr
rose
rlc
rsr
rune
rvn
sand
sfp
skl
snx
sol
stmx
storj
sui
sushi
sxp
theta
tomo
trb
trx
unfi
uni
vet
waves
xem
xlm
xmr
xrp
xtz
yfi
zec
zen
zil
zrx
How-To
The image above shows the indicator with default settings.
The image above shows the start point of our data!
Over 2-years of data, allowing for plentiful analysis!
The image above explains the primary plot.
Filled blue columns reflect liquidation delta exceeding the long side. When the liquidation delta plot is aqua and exceeds 0 to the upside, longs were liquidated more than shorts for the
day.
Filled red columns reflect liquidation delta exceeding the short side. When the liquidation delta plot is red and exceeds 0 to the downside, shorts were liquidated more than longs for the day.
The image above explains the solid line (polyline) plot and its intentions!
Filled, solid, blue line reflects the total number of long liquidation events for the period.
Filled, solid, red line reflects the total number of short liquidation events for the period.
Keep in mind that the total number of liquidation events is normalized to plot alongside the total liquidation delta for the day. So, there aren't "millions" of liquidation events taking place, the total liquidation count for the long and short side is simply normalized to fit atop total liquidation delta.
The image above explains the liquidation count meter the indicator provides!
The left (blue columns) reflect the intensity of long liquidation events for the day. The right (red columns) reflect the intensity of short liquidation events for the day.
The "Max" numbers at the top show the maximum number of long liquidation events, or short liquidation events, for their respective columns.
Therefore, if the number of long liquidation events were "1.241k", as stated for this cryptocurrency in the table, the blue meter would be full. Similar logic applies to the red meter.
Once more, THANK YOU @TradingView and @PineCoders for allowing us to upload custom data! This project wouldn't be possible without it!
Alligator + Fractals + Divergent & Squat Bars + Signal AlertsThe indicator includes Williams Alligator, Williams Fractals, Divergent Bars, Market Facilitation Index, Highest and Lowest Bars, maximum and minimum peak of Awesome Oscillator, and signal alerts based on Bill Williams' Profitunity strategy.
MFI and Awesome Oscillator
According to the Market Facilitation Index Oscillator, the Squat bar is colored blue, all other bars are colored according to the Awesome Oscillator color, except for the Fake bars, colored with a lighter AO color. In the indicator settings, you can enable the display of "Green" bars (in the "Green Bars > Show" field). In the indicator style settings, you can disable changing the color of bars in accordance with the AO color (in the "AO bars" field), including changing the color for Fake bars (in the "Fake AO bars" field).
MFI is calculated using the formula: (high - low) / volume.
A Squat bar means that, compared to the previous bar, its MFI has decreased and at the same time its volume has increased, i.e. MFI < previous bar and volume > previous bar. A sign of a possible price reversal, so this is a particularly important signal.
A Fake bar is the opposite of a Squat bar and means that, compared to the previous bar, its MFI has increased and at the same time its volume has decreased, i.e. MFI > previous bar and volume < previous bar.
A "Green" bar means that, compared to the previous bar, its MFI has increased and at the same time its volume has increased, i.e. MFI > previous bar and volume > previous bar. A sign of trend continuation. But a more significant trend confirmation or warning of a possible reversal is the Awesome Oscillator, which measures market momentum by calculating the difference between the 5 Period and 34 Period Simple Moving Averages (SMA 5 - SMA 34) based on the midpoints of the bars (hl2). Therefore, by default, the "Green" bars and their opposite "Fade" bars are colored according to the color of the Awesome Oscillator.
According to Bill Williams' Profitunity strategy, using the Awesome Oscillator, the third Elliott wave is determined by the maximum peak of AO in the range from 100 to 140 bars. The presence of divergence between the maximum AO peak and the subsequent lower AO peak in this interval also warns of a possible correction, especially if the AO crosses the zero line between these AO peaks. Therefore, the chart additionally displays the prices of the highest and lowest bars, as well as the maximum or minimum peak of AO in the interval of 140 bars from the last bar. In the indicator settings, you can hide labels, lines, change the number of bars and any parameters for the AO indicator - method (SMA, Smoothed SMA, EMA and others), length, source (open, high, low, close, hl2 and others).
Bullish Divergent bar
🟢 A buy signal (Long) is a Bullish Divergent bar with a green circle displayed above it if such a bar simultaneously meets all of the following conditions:
The high of the bar is below all lines of the Alligator indicator.
The closing price of the bar is above its middle, i.e. close > (high + low) / 2.
The low of the bar is below the low of 2 previous bars or below the low of one previous bar, and the low of the second previous bar is a lower fractal (▼). By default, Divergent bars are not displayed, the low of which is lower than the low of only one previous bar and the low of the 2nd previous bar is not a lower fractal (▼), but you can enable the display of any Divergent bars in the indicator settings (by setting the value "no" in the " field Divergent Bars > Filtration").
The following conditions strengthen the Bullish Divergent bar signal:
The opening price of the bar, as well as the closing price, is higher than its middle, i.e. Open > (high + low) / 2.
The high of the bar is below all lines of the open Alligator indicator, i.e. the green line (Lips) is below the red line (Teeth) and the red line is below the blue line (Jaw). In this case, the color of the circle above the Bullish Divergent bar is dark green.
Squat Divergent bar.
The bar following the Bullish Divergent bar corresponds to the green color of the Awesome Oscillator.
Divergence on Awesome Oscillator.
Formation of the lower fractal (▼), in which the low of the Divergent bar is the peak of the fractal.
Bearish Divergent bar
🔴 A signal to sell (Short) is a Bearish Divergent bar under which a red circle is displayed if such a bar simultaneously meets all the following conditions:
The low of the bar is above all lines of the Alligator indicator.
The closing price of the bar is below its middle, i.e. close < (high + low) / 2.
The high of the bar is higher than the high of 2 previous bars or higher than the high of one previous bar, and the high of the second previous bar is an upper fractal (▲). By default, Divergent bars are not displayed, the high of which is higher than the high of only one previous bar and the high of the 2nd previous bar is not an upper fractal (▲), but you can enable the display of any Divergent bars in the indicator settings (by setting the value "no" in the " field Divergent Bars > Filtration").
The following conditions strengthen the Bearish Divergent bar signal:
The opening price of the bar, as well as the closing price, is below its middle, i.e. open < (high + low) / 2.
The low of the bar is above all lines of the open Alligator indicator, i.e. the green line (Lips) is above the red line (Teeth) and the red line is above the blue line (Jaw). In this case, the color of the circle under the Bearish Divergent bar is dark red.
Squat Divergent bar.
The bar following the Bearish Divergent bar corresponds to the red color of the Awesome Oscillator.
Divergence on Awesome Oscillator.
Formation of the upper fractal (▲), in which the high of the Divergent bar is the peak of the fractal.
Alligator lines crossing
Bars crossing the green line (Lips) of the open Alligator indicator is the first warning of a possible correction (price rollback) if one of the following conditions is met:
If the bar closed below the Lips line, which is above the Teeth line, and the Teeth line is above the Jaw line, while the closing price of the previous bar is above the Lips line.
If the bar closed above the Lips line, which is below the Teeth line, and the Teeth line is below the Jaw line, while the closing price of the previous bar is below the Lips line.
The intersection of all open Alligator lines by bars is a sign of a deep correction and a warning of a possible trend change.
Frequent intersection of Alligator lines with each other is a sign of a sideways trend (flat).
Signal Alerts
To receive notifications about signals when creating an alert, you must select the condition "Any alert() function is call", in which case notifications will arrive in the following format:
D — timeframe, for example: D, 4H, 15m.
🟢 BDB⎾ - a signal for a Bullish Divergent bar to buy (Long), triggers once after the bar closes and includes additional signals:
/// — if Alligator is open.
⏉ — if the opening price of the bar, as well as the closing price, is above its middle.
+ Squat 🔷 - Squat bar or + Green ↑ - "Green" bar or + Fake ↓ - Fake bar.
+ AO 🟩 - if after the Divergent bar closes, the oscillator color change for the next bar corresponds the green color of the Awesome Oscillator. ┴/┬ — AO above/below the zero line. ∇ — if there is divergence on AO in the interval of 140 bars from the last bar.
🔴 BDB⎿ - a signal for a Bearish Divergent bar to sell (Short), triggers once after the bar closes and includes additional signals:
/// — if Alligator is open.
⏊ — if the opening price of the bar, as well as the closing price, is below its middle.
+ Squat 🔷 - Squat bar or + Green ↑ - "Green" bar or + Fake ↓ - Fake bar.
+ AO 🟥 - if after the Divergent bar closes, the oscillator color change for the next bar corresponds to the red color of the Awesome Oscillator. ┴/┬ — AO above/below the zero line. ∇ — if there is divergence on AO in the interval of 140 bars from the last bar.
Alert for bars crossing the green line (Lips) of the open Alligator indicator (can be disabled in the indicator settings in the "Alligator > Enable crossing lips alerts" field):
🔴 Crossing Lips ↓ - if the bar closed below the Lips line, which is above than the other lines, while the closing price of the previous bar is above the Lips line.
🟢 Crossing Lips ↑ - if the bar closed above the Lips line, which is below the other lines, while the closing price of the previous bar is below the Lips line.
The fractal signal is triggered after the second bar closes, completing the formation of the fractal, if alerts about fractals are enabled in the indicator settings (the "Fractals > Enable alerts" field):
🟢 Fractal ▲ - upper (Bearish) fractal.
🔴 Fractal ▼ — lower (Bullish) fractal.
⚪️ Fractal ▲/▼ - both upper and lower fractal.
↳ (H=high - L=low) = difference.
If you redirect notifications to a webhook URL, for example, to a Telegram bot, then you need to set the notification template for the webhook in the indicator settings in the "Webhook > Message" field (contains a tooltip with an example), in which you just need to specify the text {{message}}, which will be automatically replaced with the alert text with a ticker and a link to TradingView.
‼️ A signal is not a call to action, but only a reason to analyze the chart to make a decision based on the rules of your strategy.
***
Индикатор включает в себя Williams Alligator, Williams Fractals, Дивергентные бары, Market Facilitation Index, самый высокий и самый низкий бары, максимальный и минимальный пик Awesome Oscillator, а также оповещения о сигналах на основе стратегии Profitunity Билла Вильямса.
MFI и Awesome Oscillator
В соответствии с осциллятором Market Facilitation Index Приседающий бар окрашен в синий цвет, все остальные бары окрашены в соответствии с цветом Awesome Oscillator, кроме Фальшивых баров, которые окрашены более светлым цветом AO. В настройках индикатора вы можете включить отображение "Зеленых" баров (в поле "Green Bars > Show"). В настройках стиля индикатора вы можете выключить изменение цвета баров в соответствии с цветом AO (в поле "AO bars"), в том числе изменить цвет для Фальшивых баров (в поле "Fake AO bars").
MFI рассчитывается по формуле: (high - low) / volume.
Приседающий бар означает, что по сравнению с предыдущим баром его MFI снизился и в тоже время вырос его объем, т.е. MFI < предыдущего бара и объем > предыдущего бара. Признак возможного разворота цены, поэтому это особенно важный сигнал.
Фальшивый бар является противоположностью Приседающему бару и означает, что по сравнению с предыдущим баром его MFI увеличился и в тоже время снизился его объем, т.е. MFI > предыдущего бара и объем < предыдущего бара.
"Зеленый" бар означает, что по сравнению с предыдущим баром его MFI увеличился и в тоже время вырос его объем, т.е. MFI > предыдущего бара и объем > предыдущего бара. Признак продолжения тренда. Но более значимым подтверждением тренда или предупреждением о возможном развороте является Awesome Oscillator, который измеряет движущую силу рынка путем вычисления разницы между 5 Периодной и 34 Периодной Простыми Скользящими Средними (SMA 5 - SMA 34) по средним точкам баров (hl2). Поэтому по умолчанию "Зеленые" бары и противоположные им "Увядающие" бары окрашены в соответствии с цветом Awesome Oscillator.
По стратегии Profitunity Билла Вильямса с помощью осциллятора Awesome Oscillator определяется третья волна Эллиота по максимальному пику AO в интервале от 100 до 140 баров. Наличие дивергенции между максимальным пиком AO и следующим за ним более низким пиком AO в этом интервале также предупреждает о возможной коррекции, особенно если AO переходит через нулевую линию между этими пиками AO. Поэтому на графике дополнительно отображаются цены самого высокого и самого низкого баров, а также максимальный или минимальный пик АО в интервале 140 баров от последнего бара. В настройках индикатора вы можете скрыть метки, линии, изменить количество баров и любые параметры для индикатора AO – метод (SMA, Smoothed SMA, EMA и другие), длину, источник (open, high, low, close, hl2 и другие).
Бычий Дивергентный бар
🟢 Сигналом на покупку (Long) является Бычий Дивергентный бар над которым отображается зеленый круг, если такой бар соответствует одновременно всем следующим условиям:
Максимум бара ниже всех линий индикатора Alligator.
Цена закрытия бара выше его середины, т.е. close > (high + low) / 2.
Минимум бара ниже минимума 2-х предыдущих баров или ниже минимума одного предыдущего бара, а минимум второго предыдущего бара является нижним фракталом (▼). По умолчанию не отображаются Дивергентные бары, минимум которых ниже минимума только одного предыдущего бара и минимум 2-го предыдущего бара не является нижним фракталом (▼), но вы можете включить отображение любых Дивергентных баров в настройках индикатора (установив значение "no" в поле "Divergent Bars > Filtration").
Усилением сигнала Бычьего Дивергентного бара являются следующие условия:
Цена открытия бара, как и цена закрытия, выше его середины, т.е. Open > (high + low) / 2.
Максимум бара ниже всех линий открытого индикатора Alligator, т.е. зеленая линия (Lips) ниже красной линии (Teeth) и красная линия ниже синей линии (Jaw). В этом случае цвет круга над Бычьим Дивергентным баром окрашен в темно-зеленый цвет.
Приседающий Дивергентный бар.
Бар, следующий за Бычьим Дивергентным баром, соответствует зеленому цвету Awesome Oscillator.
Дивергенция на Awesome Oscillator.
Образование нижнего фрактала (▼), у которого минимум Дивергентного бара является пиком фрактала.
Медвежий Дивергентный бар
🔴 Сигналом на продажу (Short) является Медвежий Дивергентный бар под которым отображается красный круг, если такой бар соответствует одновременно всем следующим условиям:
Минимум бара выше всех линий индикатора Alligator.
Цена закрытия бара ниже его середины, т.е. close < (high + low) / 2.
Максимум бара выше маскимума 2-х предыдущих баров или выше максимума одного предыдущего бара, а максимум второго предыдущего бара является верхним фракталом (▲). По умолчанию не отображаются Дивергентные бары, максимум которых выше максимума только одного предыдущего бара и максимум 2-го предыдущего бара не является верхним фракталом (▲), но вы можете включить отображение любых Дивергентных баров в настройках индикатора (установив значение "no" в поле "Divergent Bars > Filtration").
Усилением сигнала Медвежьего Дивергентного бара являются следующие условия:
Цена открытия бара, как и цена закрытия, ниже его середины, т.е. open < (high + low) / 2.
Минимум бара выше всех линий открытого индикатора Alligator, т.е. зеленая линия (Lips) выше красной линии (Teeth) и красная линия выше синей линии (Jaw). В этом случае цвет круга под Медвежьим Дивергентным Баром окрашен в темно-красный цвет.
Приседающий Дивергентный бар.
Бар, следующий за Медвежьим Дивергентным баром, соответствует красному цвету Awesome Oscillator.
Дивергенция на Awesome Oscillator.
Образование верхнего фрактала (▲), у которого максимум Дивергентного бара является пиком фрактала.
Пересечение линий Alligator
Пересечение барами зеленой линии (Lips) открытого индикатора Alligator является первым предупреждением о возможной коррекции (откате цены) при выполнении одного из следующих условий:
Если бар закрылся ниже линии Lips, которая выше линии Teeth, а линия Teeth выше линии Jaw, при этом цена закрытия предыдущего бара находится выше линии Lips.
Если бар закрылся выше линии Lips, которая ниже линии Teeth, а линия Teeth ниже линии Jaw, при этом цена закрытия предыдущего бара находится ниже линии Lips.
Пересечение барами всех линий открытого Alligator является признаком глубокой коррекции и предупреждением о возможной смене тренда.
Частое пересечение линий Alligator между собой является признаком бокового тренда (флэт).
Оповещения о сигналах
Для получения уведомлений о сигналах при создании оповещения необходимо выбрать условие "При любом вызове функции alert()", в таком случае уведомления будут приходить в следующем формате:
D — таймфрейм, например: D, 4H, 15m.
🟢 BDB⎾ — сигнал Бычьего Дивергентного бара на покупку (Long), срабатывает один раз после закрытия бара и включает дополнительные сигналы:
/// — если Alligator открыт.
⏉ — если цена открытия бара, как и цена закрытия, выше его середины.
+ Squat 🔷 — Приседающий бар или + Green ↑ — "Зеленый" бар или + Fake ↓ — Фальшивый бар.
+ AO 🟩 — если после закрытия Дивергентного бара, изменение цвета осциллятора для следующего бара соответствует зеленому цвету Awesome Oscillator. ┴/┬ — AO выше/ниже нулевой линии. ∇ — если есть дивергенция на AO в интервале 140 баров от последнего бара.
🔴 BDB⎿ — сигнал Медвежьего Дивергентного бара на продажу (Short), срабатывает один раз после закрытия бара и включает дополнительные сигналы:
/// — если Alligator открыт.
⏊ — если цена открытия бара, как и цена закрытия, ниже его середины.
+ Squat 🔷 — Приседающий бар или + Green ↑ — "Зеленый" бар или + Fake ↓ — Фальшивый бар.
+ AO 🟥 — если после закрытия Дивергентного бара, изменение цвета осциллятора для следующего бара соответствует красному цвету Awesome Oscillator. ┴/┬ — AO выше/ниже нулевой линии. ∇ — если есть дивергенция на AO в интервале 140 баров от последнего бара.
Сигнал пересечения барами зеленой линии (Lips) открытого индикатора Alligator (можно отключить в настройках индикатора в поле "Alligator > Enable crossing lips alerts"):
🔴 Crossing Lips ↓ — если бар закрылся ниже линии Lips, которая выше остальных линий, при этом цена закрытия предыдущего бара находится выше линии Lips.
🟢 Crossing Lips ↑ — если бар закрылся выше линии Lips, которая ниже остальных линий, при этом цена закрытия предыдущего бара находится ниже линии Lips.
Сигнал фрактала срабатывает после закрытия второго бара, завершающего формирование фрактала, если оповещения о фракталах включены в настройках индикатора (поле "Fractals > Enable alerts"):
🟢 Fractal ▲ — верхний (Медвежий) фрактал.
🔴 Fractal ▼ — нижний (Бычий) фрактал.
⚪️ Fractal ▲/▼ — одновременно верхний и нижний фрактал.
↳ (H=high - L=low) = разница.
Если вы перенаправляете оповещения на URL вебхука, например, в бота Telegram, то вам необходимо установить шаблон оповещения для вебхука в настройках индикатора в поле "Webhook > Message" (содержит подсказку с примером), в котором в качестве текста сообщения достаточно указать текст {{message}}, который будет автоматически заменен на текст оповещения с тикером и ссылкой на TradingView.
‼️ Сигнал — это не призыв к действию, а лишь повод проанализировать график для принятия решения на основе правил вашей стратегии.

Interest Bricks @shrilssInterest Bricks utilize a unique approach to visualize changes in interest over time. It calculates the difference between the current and previous values of a specified asset's closing price on a daily basis. The resulting value indicates whether there has been an increase, decrease, or no change in interest.
This indicator employs a sine wave plot to represent the trend of interest changes. Positive values of the sine wave indicate increasing interest, while negative values denote decreasing interest. The color of the plot dynamically changes based on the direction of the trend: lime for upward trends and red for downward trends.
