OPEN-SOURCE SCRIPT
GRIB Trendline
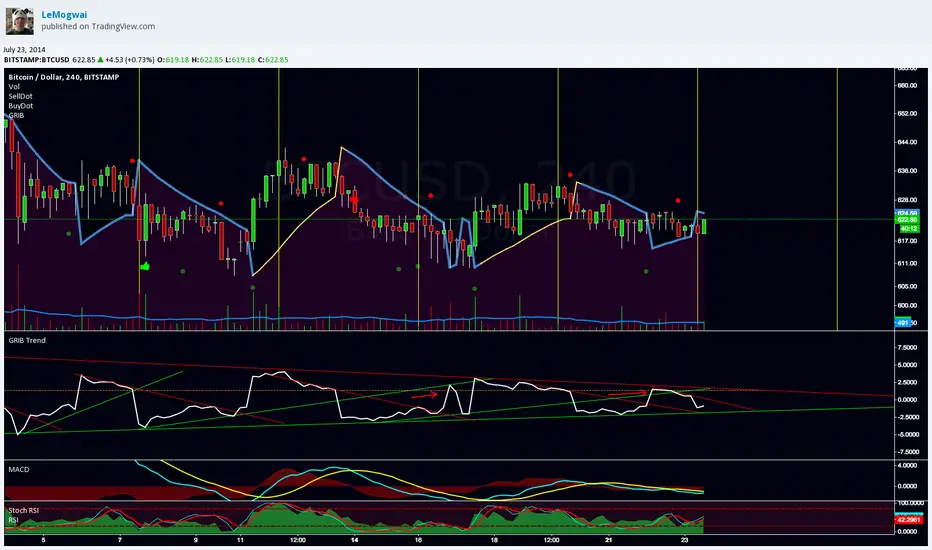
GRIB Trendline show the distance betwen the price and the SAR with the GRIB settings in percentage. It highlight the elasticity of the wave. It's designed to be used with trendlines to spot the bottoms and the tops.
More explanation here :

and here :

note : do not use "selldot" and "buydot", i was testing something and gave up about the idea
More explanation here :
and here :
note : do not use "selldot" and "buydot", i was testing something and gave up about the idea
Açık kaynak kodlu komut dosyası
Gerçek TradingView ruhuna uygun olarak, bu komut dosyasının oluşturucusu bunu açık kaynaklı hale getirmiştir, böylece yatırımcılar betiğin işlevselliğini inceleyip doğrulayabilir. Yazara saygı! Ücretsiz olarak kullanabilirsiniz, ancak kodu yeniden yayınlamanın Site Kurallarımıza tabi olduğunu unutmayın.
Feragatname
Bilgiler ve yayınlar, TradingView tarafından sağlanan veya onaylanan finansal, yatırım, işlem veya diğer türden tavsiye veya tavsiyeler anlamına gelmez ve teşkil etmez. Kullanım Şartları'nda daha fazlasını okuyun.