"wave" için komut dosyalarını ara

The WaveRunner Multiple Moving AveragesThe WaveRunner consists of a Triple Exponential Moving Average (or TEMA). This study first calculates the exponential moving average(EMA) of the security. It then finds the EMA of that first EMA and then finally calculates a third EMA based on the second EMA. Then, we added in a volume weighted moving average, allowing us to place greater emphasis on periods with higher volume.
Due to its minimal lag, the triple exponential moving average is a good tool for trend identification and volatility measurement. Adding in a VWMA further improves its accuracy as it provides another way to check the strength of a trend.
The first EMA is shown as the green line of circles. The EMA of that line is then plotted as the middle yellow line. Finally, the third EMA is the red line of circles. When the first EMA is greater than the third, it indicates a sustained positive trend and the area between the two lines is filled green. On the other hand, when the third EMA is greater than the first EMA, it indicates a negative trend and the area between the two lines is filled red. Finally, the VWMA is shown as the darker green and red areas both below and above the first EMA.
This indicator is best used for trend identification and confirmation, filtering out volatility. Reduced lag allows traders to interpret sharp price fluctuations.

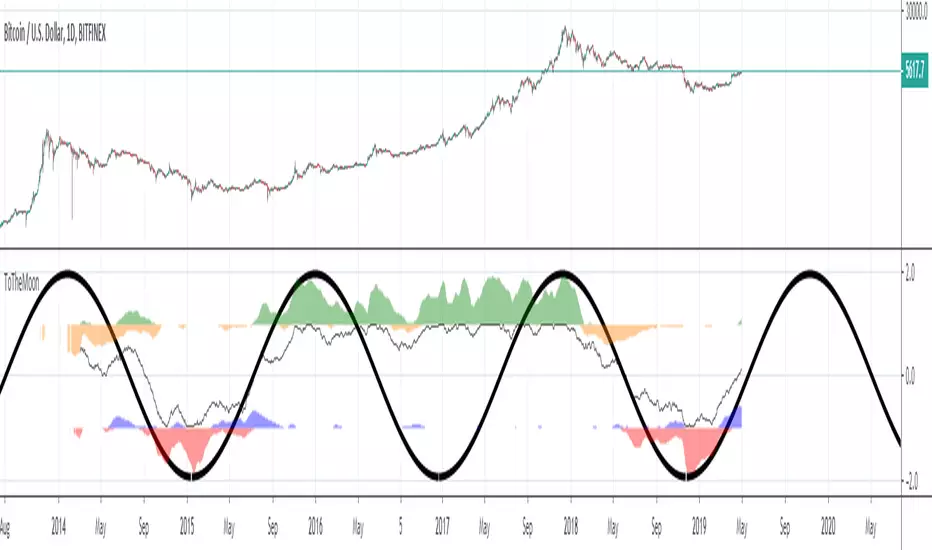
ToTheMoonVolatility direction and strength, normalized oscillator.
200 candles moving average analysis. Always zoom out and examine the neighboring waves.
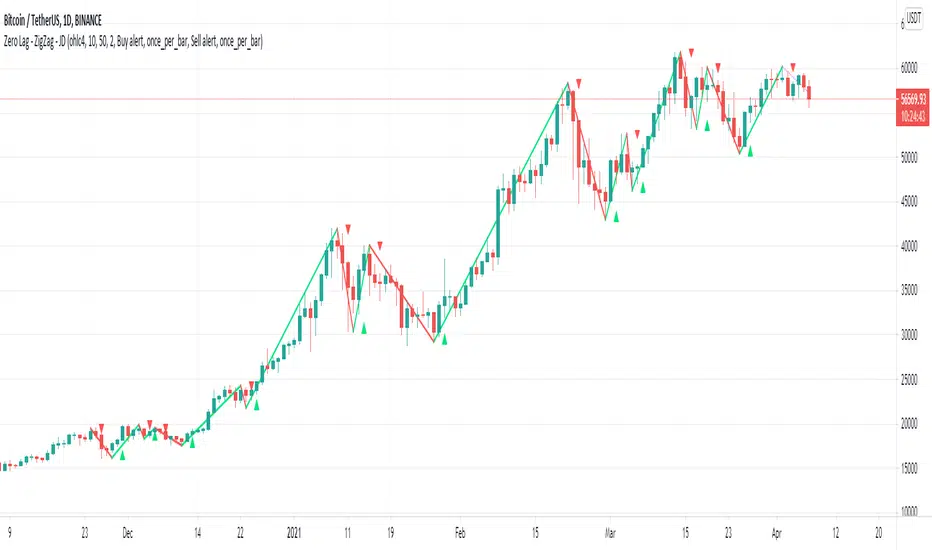
Zero Lag - ZigZag - JDThis is a alternative version of the well known "ZigZag indicator" but it uses turning points of the Jurik ma
instead of the traditional "pivot points" that are by definition lagging by a large lookback period, the (almost-) Zero Lag ZigZag lags by about 2 bars on average (depending on the candles forming)
The ZigZag pattern can be used to draw trendlines and S/R lines
It can also be used for "wave counting" in a way that reduces interpretation.
If you find other uses, please leave your ideas in the comments!
Shoutout to Everget for the awesome Jurik code!!
JD.
#NotTradingAdvice #DYOR
RSI|The Wave PrincipleThe Wave Principle | Modified RSI
30 green | 70 red = Strong Movement (Possible Impulse)
20 cyan | 80 Yellow = Strongest Movement
Support and Resistance Level (Trend Continuation)
Uptrend= 40
Downtrend = 60
Break+Retest = BR
Div = Divergence (Change in trend)
--------------------------------------------
This indicator has been modified from original RSI to fit Wave Principle characteristics:
Uptrend Impulsive Wave over 70 RSI it changes color to red, and > 80 yellow stronger impulse | Usually means continuation, at least once more.
Downtrend Impulsive Wave under 30 RSI it changes color to green, and < 20 cyan stronger impulse | Usually means continuation, at least once more.
Once RSI reached these levels, it doesn't mean trend reversal but a correction is expected. If it shows divergence along with an Ending Diagonal, it's a confirmation for trend reversal.
In a corrective wave, levels 40-60 represents support and resistance levels where price won't go further. Indicating Corrective Waves, not as strong as Impulsives.
Prices can breakout RSI trend lines and retest from the other side before continue the new trend as also described in the Wave Principle.
--------------------------------------------


JSE Wyckoff Wave Volume Code// The Stock Market Institute (SMI) describes an propriety indicator the "SMI Wyckoff Wave" for US Stocks. This code is an attempt to make a Wyckoff Wave for the Johannesburg Stock Exchange (JSE).
// The JSE Wyckoff Wave is in a separate code. This is the code for the volume of the wave. Please see code for the JSE Wyckoff Wave which goes with this indicator.
//
// The Wave presents a normalized price for the 10 selected stocks (An Index for the 10 stocks).
// The theory is to select stocks that are widely held, market leaders, actively traded and participate in important market moves.
// This is only my attempt to select 10 stocks and a different selection can be made.
// I am not certain how SMI determine their weightings but what I have done it to equalize the Rand value of the stock volumne so that moves are of equal magnitude.
// The then provides a view of the overall condition of the market and volume flow in the market.
//
// I have used the September 2018 price to normalize the stock price for the 10 selected stocks based. The stocks and weightings can be changed periodically depending on the performance and leadership.
//
// Please, let me know if there is a better work around this.
The stocks and their weightings are:
"JSE:BTI"/0.79
"JSE:SHP"/2.87
"JSE:NPN"/0.18
"JSE:AGL"/1.96
"JSE:SOL"/1.0
"JSE:CFR"/4.42
"JSE:MND"/1.40
"JSE:MTN"/7.63
"JSE:SLM"/7.29
"JSE:FSR"/8.25

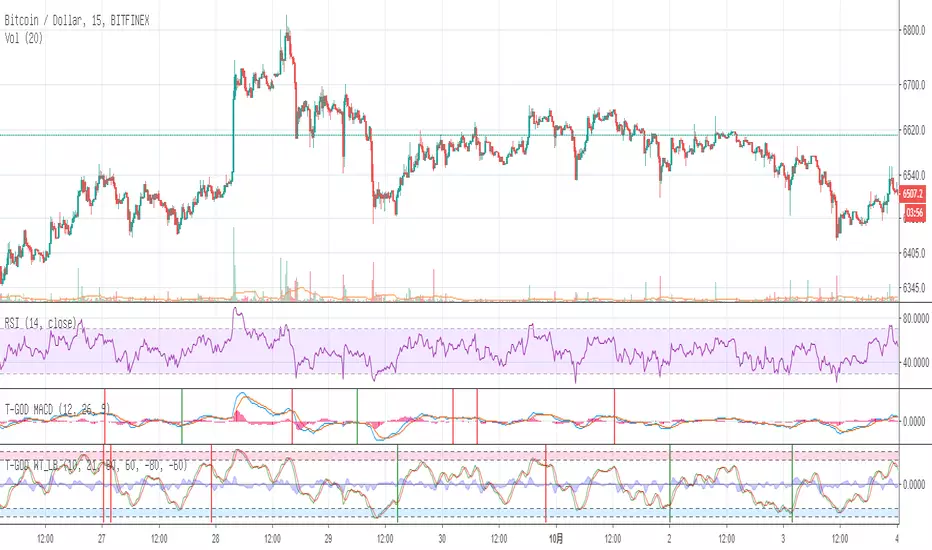
[NMC]RSI MTF, StochasticRSI MTF, BB%, WavetrendThis is our second indicator and is very useful if you want to create a strategy based on multiple indicators and time frames. RSI and Stochastic RSI are multi-timeframe and they are based on ChrisMoody's multi-timeframe scripts.
You can choose from RSI, Stochastic RSI, BB% and Wavetrend. In the near future we my add CCI, CMF, TSI or any similar indicator with the possibility to plot from a higher timeframe.
Vegas Wave - BronzeThe bronze edition of my code will be the most basic of a series of Vegas Wave codes which I will publish.
EMA 144, 169, 233
Vegas Tunnel - Highlights the price band between the 144 and 169 EMA.
Identifies support and resistance areas
Target price bounces and aid identifying EW counts.
Wave 2 retrace through the waves. Wave 4 bounce off Vegas Tunnel for example.
Provides confluence when used with fib targets and other indicators.
Identify EMA cross-overs and price crosses.
Easy to customise colours and shading for all time periods.
Multiple indicators in one (for those with TV limits).
Silver/Gold versions
I will include highlights/alerts for EMA/Price crossovers.
I hope its helpful and hopefully the first of many scripts to come.
Feel free to leave ideas and tips for future versions.

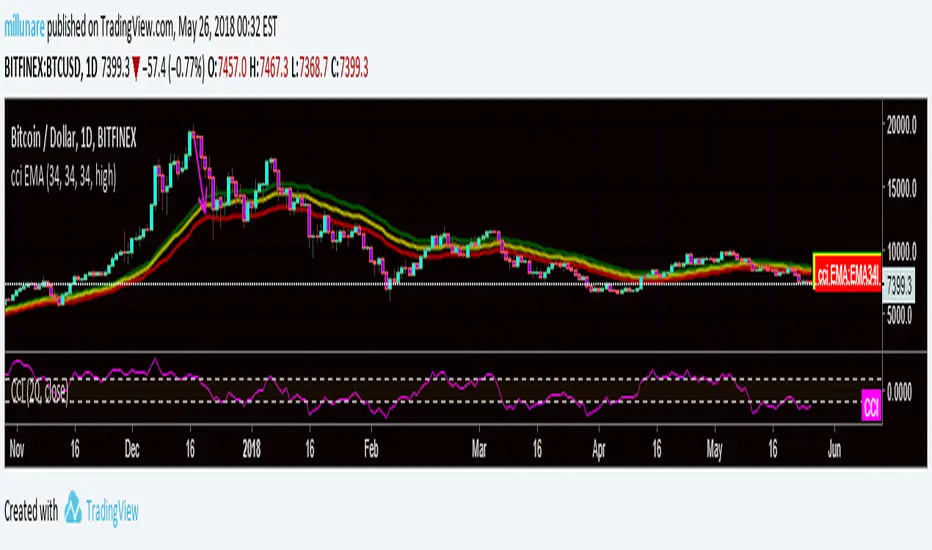
CMR CCI WAVEThe Funnel consists of 3 EMA's all set at the 34 EMA ( 1 on 34 Close, 1 on 34 Low and 1 on 34 High )
We couple this with a CCI of +100 / 0 / -100 ( The CCI is used as an RSI would be to determining crossings and overbought and oversold)
The Funnel should not be used as your primary entries, it is more of a verification process to show where the market is heading and where it has been. Best couple with the Elliott Wave of Swing Trading Fibs.
The Wave Funnel moves in clock angles ( remember to always think of a clock when working with the wave)
* 12-2 = A North Move
* 4-6 = A South Move
* A 9-3 = A Flat Move signaling Consolidation / Market Stall
* A 2-4 = When the wave is not steep enough to be a 12-2 or 4-6 and not flat enough to be a Consolidation of the 9-3.. We can verify this by looking at the CCI to confirm.
Wave confirms Direction, CCI confirms 2-4 ( We only range trade a 2-4 or Stay out of the Market if volume is non existent.
Add a MACD for a Flat 9-3 clock angle.
* Congestion/Consolidation is evident we look for other chart patterns to form in this angle. ( Triangles/ Rectangles/ Flags etc)
* Only use the MACD on Sideways markets
* If and when it breaks the Flat Angle we then look at the MACD for entry.
* If MACD is over 0 we BUY the Break
* If MACD is under the 0 we Sell
A 2-4 angle we trade the range of the emas, it will poke through the bottom and back out the top and repeat until we see a breakout to the north or south.
So if it is a 2-4 oclock angle we trade based off the macd's -100 we buy, 100 we sell. Repeat as the funnel continues the clock angle.
We trade with a Stop Loss on the other side of the Wave.
Do Not jump the gun on the trades. Wait for Pull Backs into the Wave
Pivots and Fibs will help determine the pullback ranges
The price always pullback to the Wave ( No different than any other ema, they act as magnets to price action)
ANy Questions hit up mill in CMR

Take Profit Again Score (Starting Wave Catcher)_BinanceTPA (Starting Wave Catcher)_BINANCE ver
또땃 스코어 보조용 스타팅 파동 감지지표 바이낸스 ver
------------------------------------------------------------------------------
This indicator was created to complement "Take Profit Again Trend Score (Crpto Catcher) _Binance".
It is aimed to start or stop the decline in value and detect the beginning of the wave.
The coin that goes up the river of score wave is likely to give a good performance.
The TPA Trend Score indicator is a good indicator of the adequacy of a sell-off.
If the starting score is negative even though the TPA score is the highest, you have to set and hold a loss cut on the chart or chart.
---------------------------------------------------------------------------------------------
이 지표는 "Take Profit Again Trend Score(Crpto Catcher)_Binance"를 보완하기 위해 만들어졌습니다.
시작하거나 대세가치하락에서 견뎌내고 파동시작을 감지하는 목적입니다.
점수 파동의 강물을 거슬러 올라가는 코인이 좋은 성과를 줄 확률이 높습니다.
TPA Trend Score 지표와 함께 매수매도의 적절성을 판단하기에 좋습니다.
TPA스코어가 가장 높더라도 Starting 스코어가 음수로 가게 된다면 매도 내지는 차트상 로스컷을 정하고 홀딩해야합니다.

Elliott Wave Oscillator (EWO)Simple Elliott Wave Oscillator: the fast moving average is a 5-period SMA, the slow moving average is a 35-period SMA, the EWO is the difference between the two.
It lines up almost perfectly with Elliott Waves.


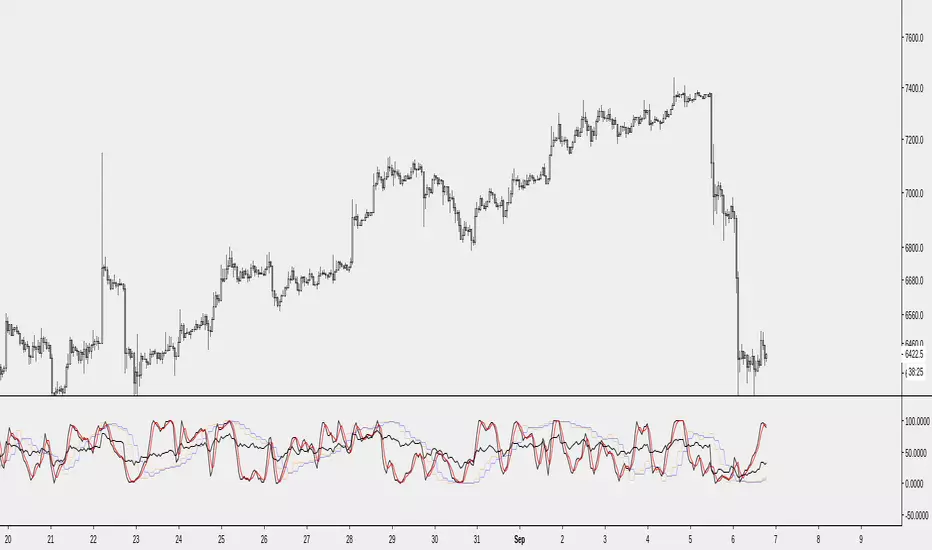
Fractal Composites Ribbon (V2)Compresses 8 fractal oscillator timescales into a ribbon of up to 5 composite lines.
This is a smoother version of the original Fractal Composite with alerts on reversals in the overbought/oversold zones.
Fractal Composites normalize and 'cartoonize' the price chart to fit and bounce between statistically-defined overbought and oversold zones. Each lines resembles the shape of the price wave on a different time/size scale, with some distortion as the size of price movement fluctuates. Conceptually, reaching the overbought/oversold zone corresponds to price reaching a ribbon of Bollinger bands, though our 'band statistics' are much smoother and more mathematically sophisticated than standard Bollinger.
Because markets have similar fractal behavior across all timescales, this indicator applies to any timescale, from 1 minute to 1 hour or 1 day. You shouldn't really need to futz with the numerical parameters -- the most important choice is your chart timescale for how fast you want to trade. A faster timescale will show you more dotted reversals in the overbought/oversold zones to trade. The 'Show...' checkboxes let you choose how many composite lines, lag lines, and crosses to see. Information overload? Or a reminder that any single indicator embeds many assumptions about time and price scale in its signal...

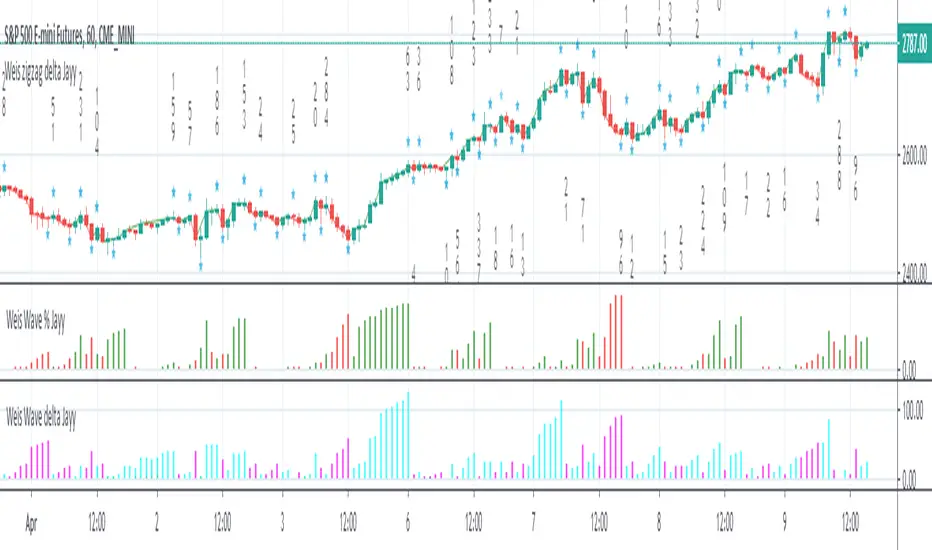
Weis Wave Jayy This is the Weis Volume Wave. Wave sizes are in dollars. If, for example, you want a 10 cent wave enter .100. (a 25 cent wave will be .2500) A few extra zeros will be useful. If using forex pairs then simply add the value desired. Weis often talks in wave sizes for forex such as an eighth (1/8). An eighth as a fraction is .12500 (again an extra zero or two). Read the David Weis book and/or watch this video to learn more about the Weis Wave and the associated method www.youtube.com Each security or pair - on each timeframe - will require its own wave size.
Cheers Jayy

alpha Renko intraday wave timeI was asked to share my experimental Renko intraday wave time. So here it is warts and all. The same for the rest - except the Weis cumulative volume.
Renko wave time is in minutes. This script is strictly intraday and has not been played with extensively.
You must use traditional Renko and set the script wave size to the same size as the Renko brick size.
If you click on the sideways wishbone or "V" in the middle upper part of the chart you will get all of the scripts in this particular sandbox. After clicking the sideways wish bone click on "make it mine". You will then have the whole sandbox. The only published script is the Weis cumulative wave.
The "Boys MAs" is supposed to be a script for daily charts and from within some kind of consolidation. In any case I am intrigued by some signals. You have a variety of sandbox options in the format section of the boys MAs.
These codes are pretty rough with lots of abandoned lines of script.

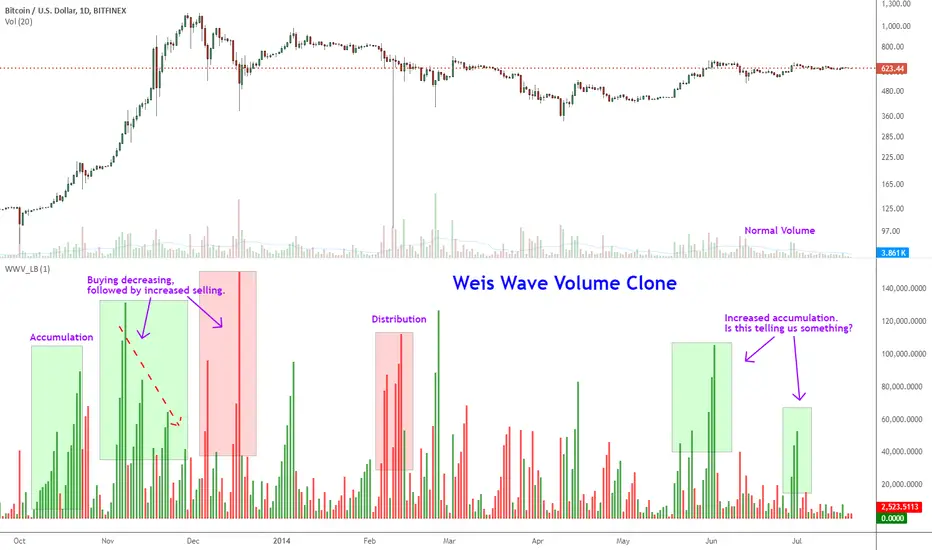
Indicator: Weis Wave Volume [LazyBear]This indicator takes market volume and organizes it into wave charts, clearly highlighting inflection points and regions of supply/demand.
Try tuning this for your instrument (Forex not supported) by adjusting the "Trend Detection Length". This "clubs together" minor waves. If you like an oscillator-kind-of display, enable "ShowDistributionBelowZero" option.
Note: This indicator is a port of a clone of WeisVolumePlugin available for another platform. I don't know how close this is to the original Weis, if any has access to it, do let me know how this compares. Thanks.
More info:
weisonwyckoff.com
Complete list of my indicators:
Elliott Wave - Wave 3 Entry EngineThis indicator is a Wave 3 entry engine built on top of an Elliott Wave–style 1-2-3 structure. It automatically finds potential Wave 3 trades, manages a simple R-multiple target/stop model, and marks outcomes directly on the chart.
What the indicator does
At a high level, the script:
Detects swing points on three “degrees”
Small (S) – fast, local swings
Medium (M) – broader swings
Large (L) – higher-timeframe context only
Looks for a 3-pivot pattern (W0 → W1 → W2)
Bullish setup: Low → High → Higher Low (L-H-L)
Bearish setup: High → Low → Lower High (H-L-H)
Checks whether that pattern is a valid Wave 1–2 structure
Using multiple rules:
Wave 2 retraces Wave 1 by a configurable fraction
Wave 1 is strong enough (percentage move + slope)
Wave 2 doesn’t overshoot Wave 0 too far
Trend direction and swing “consensus” across S/M/L degrees line up
Scores the setup (Pre-W3 Score)
The script calculates a 0–1 score based on:
How “nice” the Wave 2 retracement is vs the ideal level
How much stronger Wave 1’s slope is vs Wave 2’s pullback
How much consensus there is across the swing engine (S/M/L)
Only setups above your chosen minimum Pre-W3 score and that pass alignment checks become Wave 3 candidates.
Waits for breakout → creates a Wave 3 “entry”
For longs: price breaks above the Wave 1 high (plus an optional tick buffer)
For shorts: price breaks below the Wave 1 low (minus buffer)
When triggered, the indicator:
Stores entry price (close at breakout)
Sets a stop beyond Wave 2 (with optional extra ticks)
Calculates a target based on a fixed R multiple (e.g., 2R)
Tracks the trade until exit or timeout
For each open W3 trade, it monitors:
Target hit → marks “W3 ✅”
Stop hit → marks “W3 ❌”
Bar where both could have hit → conservative loss “W3 ?/❌”
Time-based expiry (too many bars in trade) → “W3 ⏰”
Candidates that never get a breakout within your chosen max bars from W2 can also be marked as timeout (⏰).
Visual elements on the chart
The script can plot several helpful visuals:
Swing connector lines (Small/Medium/Large)
Small = blue
Medium = purple
Large = orange
These show the detected swings at each degree
Pre-W3 labels at Wave 2 (optional)
Signals :
"Pre-W3 Long XX%" or"Pre-W3 Short XX%"
Placed at the Wave 2 pivot
Colored yellow, with the % score rounded to an integer
W3 Entry labels (optional)
"W3 Long Entry" below the bar for longs (green)
"W3 Short Entry" above the bar for shorts (red)
Outcome labels (optional)
W3 ✅ – target hit
W3 ❌ – stop hit
W3 ?/❌ – both hit on same bar, treated as loss
W3 ⏰ – candidate or trade timed out
All these can be toggled in the “Wave 3 Engine (Pre-W3 + Entries + Outcomes)” group.
Input groups & how to use them
Swing Detection (Small / Medium / Large)
These groups control how the script finds swing highs/lows using a multi-parameter pivot scan:
Left Min / Left Max / Right Min / Right Max
Define the pivot “strength” ranges (how many bars to the left/right the high/low must dominate).
Minimum swing % (post-aggregation)
Ensures that, once swings are merged and cleaned up, each swing is at least this % move from the prior opposite swing.
Loop Filters (Small/Medium/Large loop min % change)
Extra gating inside the pivot-search loop, so small noise pivots can be ignored even before final swing construction.
Practical use:
Tighten % thresholds or increase left/right bars to reduce noise.
Loosen them to get more swings and more potential W3 setups.
Wave 3 Logic
Wave 2 depth
W2 min / max retracement of W1 (fraction)
Example: 0.30–0.80 means W2 must retrace 30–80% of W1.
Ideal W2 retracement (for scoring)
Often set around 0.618 (classic fib). The closer W2 is to this, the higher the retracement part of the score.
Max W2 beyond W0 (%)
How far W2 may push past W0 (in %) before the setup is invalid. Set to 0 to disable this filter.
Wave 1 strength
Min W1 move (%)
Ensures Wave 1 itself is meaningful.
Min |W1 slope| / |W2 slope|
Wave 1 must be “steeper” than Wave 2’s correction.
Slope ratio for max score
Above this, extra slope advantage doesn’t improve the score further.
Scoring & Trend Alignment
Min Pre-W3 score (0..1)
Hard gate: anything below this won’t become a W3 candidate.
Trend alignment (S/M/L)
Options:
None – ignore swing directions, purely pattern/score based
Majority – at least 2 of S/M/L must point in the W3 direction
AllThree, S+M, S+L, M+L – stricter alignment variants
Alignment uses the latest swing direction (up or down) for each degree.
Max W3 candidates to track
Limits how many candidates + trades are stored. Old, already-closed items are pruned first; open trades are never pruned.
This is an indicator, not an order engine**:** it doesn’t place trades; it only marks hypothetical Wave 3 entries and outcomes based on your settings. Always validate on historical data and combine with your own analysis and risk management before using it in live trading.

[iQ]PRO Fractals in Dealing Range and Fib Levels+⚡️ PRO Combined Fractal & Dealing Range THEORY W QUADRANTS AND FIB LEVELS: Dynamic Price Structure Analysis
The PRO Combined Fractal & Dealing Range indicator is a proprietary, cutting-edge market structure analysis tool designed to give serious traders a tactical edge by merging advanced Fractal-based wave detection with a sophisticated Dynamic Dealing Range system. This professional-grade utility provides a crystal-clear, multi-layered view of key supply and demand zones, trend reversals, and structural boundaries.
Key Features & Proprietary Logic
This indicator is built on two harmoniously integrated engines, providing a comprehensive view that goes far beyond standard technical analysis.
📈 Adaptive Fractal Wave Engine
Our custom-tuned Fractal Engine employs a unique, multi-degree detection process to identify both Base Swings and Higher Degree Swings with unparalleled precision.
Proprietary Period Calculation: The engine utilizes a specialized formula based on the Golden Ratio (ϕ) to determine a refined higher-degree lookback period: Period
F
=floor(Period
Base
ϕ
). This adaptive logic helps filter market noise and highlight only the most significant structural turning points.
Dynamic Labeling: Automatically places visual markers on the chart to define confirmed Highs and Lows, simplifying the interpretation of market structure and potential directional shifts.
🎯 Dynamic Dealing Range System
This core component provides a detailed, automatically calculated framework of critical price levels, serving as a roadmap for potential entries, targets, and risk management.
Strategic Quadrant Mapping: Automatically establishes a significant Dealing Range based on a customizable lookback period, then divides it into four distinct Quadrants (Q1-Q4). These zones highlight areas of Premium, Equilibrium (Q2-Q3), and Discount, guiding trading decisions relative to the overall range.
Advanced Level Detection:
Fibonacci Retracement: Displays key Fibonacci levels (e.g., 50%, 61.8%, 78.6%) within a user-defined range, identifying high-probability reversal and reaction areas.
Liquidity & Pivots: The indicator incorporates a proprietary Liquidity Detection Algorithm using adaptive pivot sensitivity to identify significant historical support and resistance zones.
Inter-Timeframe Structure: Features a non-repainting method to display Important Highs/Lows (such as Monthly, Weekly, and Daily extremes) right on your current chart, bridging the gap between timeframes.
Professional Trader Utility
Clarity on Price Action: Instantly see the structure of the market and which direction the momentum is flowing based on the confirmed fractal swings.
Actionable Alerts: Receive timely and precise alerts when price approaches critical psychological and structural levels, including the Quadrant boundaries and the highly reactive Fibonacci 0.618 level.
Information at a Glance: A clean, professional table is displayed on the chart, summarizing the calculated range boundaries (Quadrant and Fibonacci Highs/Lows) for immediate reference.
The PRO Combined Fractal & Dealing Range is an indispensable tool for traders focused on market structure, institutional price action, and trading within clearly defined ranges. It is designed to minimize subjectivity and maximize clarity on your TradingView chart.
NO REPAINT ;)
