OPEN-SOURCE SCRIPT
Indicator: Weis Wave Volume [LazyBear]
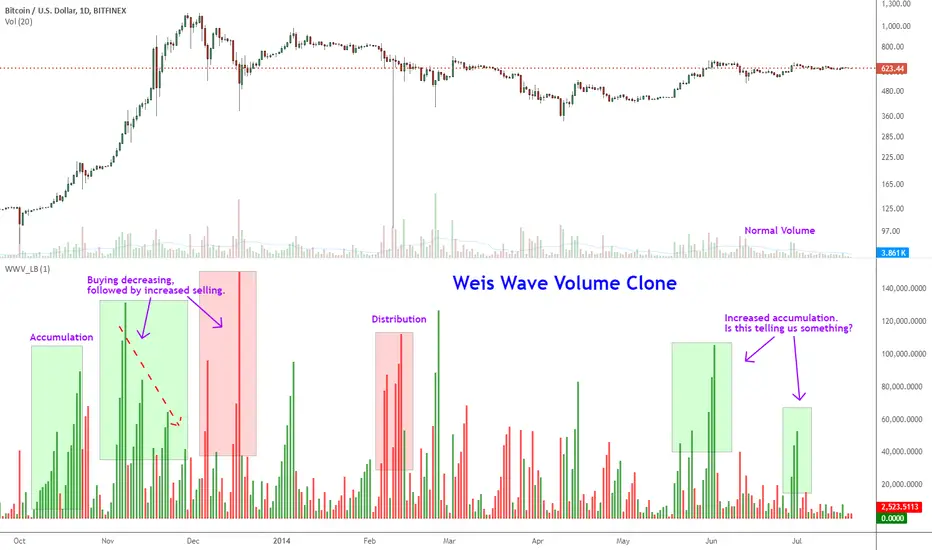
This indicator takes market volume and organizes it into wave charts, clearly highlighting inflection points and regions of supply/demand.
Try tuning this for your instrument (Forex not supported) by adjusting the "Trend Detection Length". This "clubs together" minor waves. If you like an oscillator-kind-of display, enable "ShowDistributionBelowZero" option.
Note: This indicator is a port of a clone of WeisVolumePlugin available for another platform. I don't know how close this is to the original Weis, if any has access to it, do let me know how this compares. Thanks.
More info:
weisonwyckoff.com/weis-wave/
Complete list of my indicators:
tradingview.com/v/4IneGo8h/
Açık kaynak kodlu komut dosyası
Gerçek TradingView ruhuna uygun olarak, bu komut dosyasının oluşturucusu bunu açık kaynaklı hale getirmiştir, böylece yatırımcılar betiğin işlevselliğini inceleyip doğrulayabilir. Yazara saygı! Ücretsiz olarak kullanabilirsiniz, ancak kodu yeniden yayınlamanın Site Kurallarımıza tabi olduğunu unutmayın.
List of my free indicators: bit.ly/1LQaPK8
List of my indicators at Appstore: blog.tradingview.com/?p=970
List of my indicators at Appstore: blog.tradingview.com/?p=970
Feragatname
Bilgiler ve yayınlar, TradingView tarafından sağlanan veya onaylanan finansal, yatırım, işlem veya diğer türden tavsiye veya tavsiyeler anlamına gelmez ve teşkil etmez. Kullanım Şartları'nda daha fazlasını okuyun.